. 2014 Aug;35(8):1862-72.
doi: 10.1016/j.neurobiolaging.2014.02.008. Epub 2014 Feb 15.

Widespread age-related differences in the human brain microstructure revealed by quantitative magnetic resonance imaging

Affiliations

Widespread age-related differences in the human brain microstructure revealed by quantitative magnetic resonance imaging

Martina F Callaghan et al. Neurobiol Aging. 2014 Aug.

Abstract

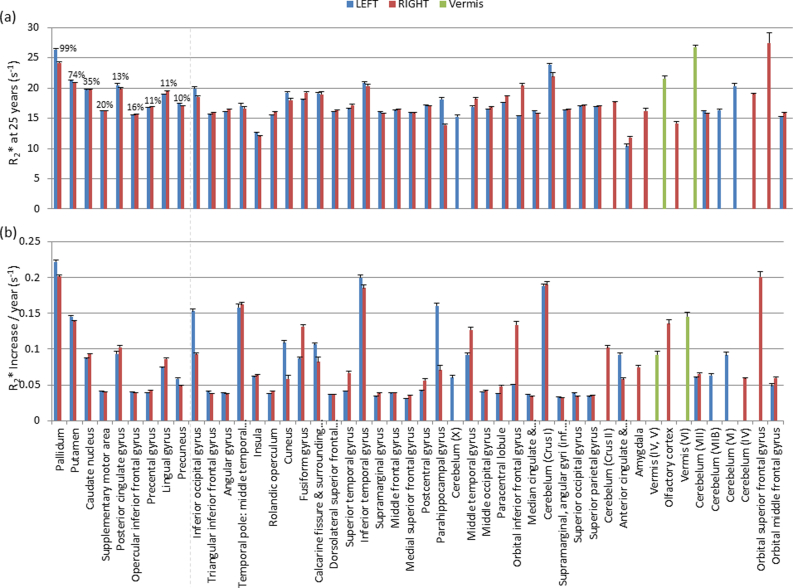
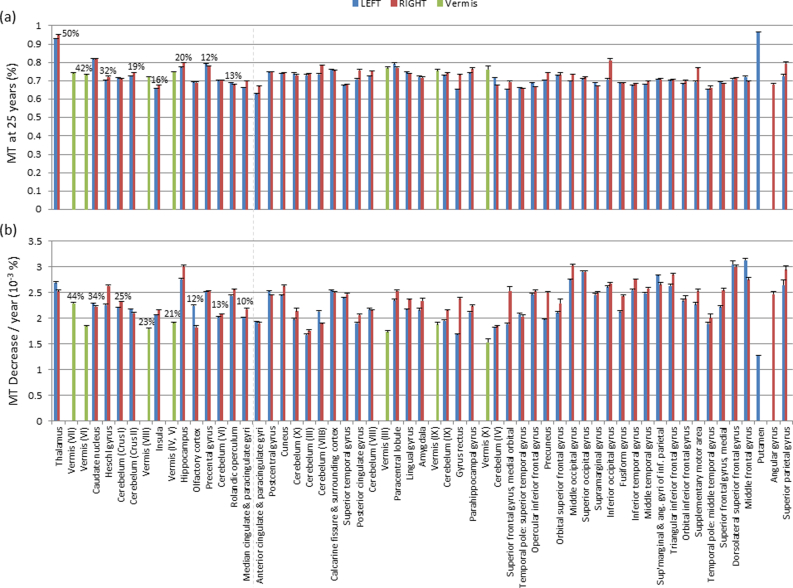
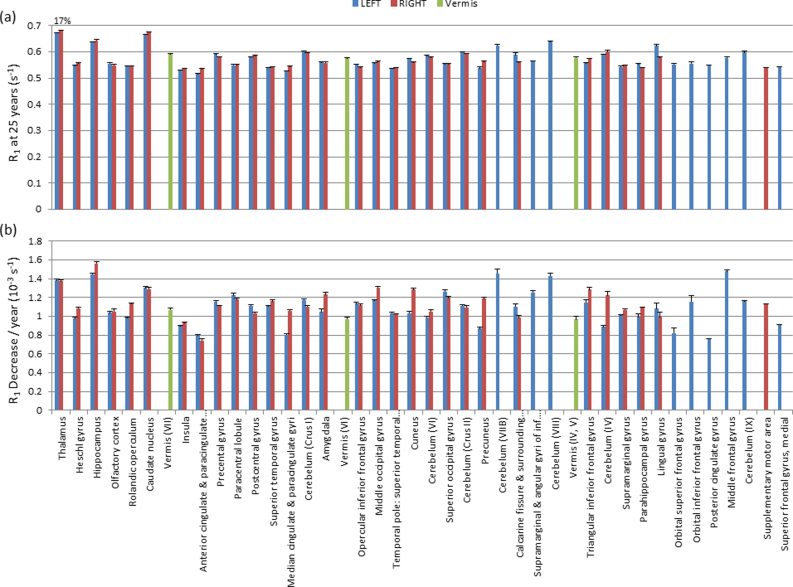
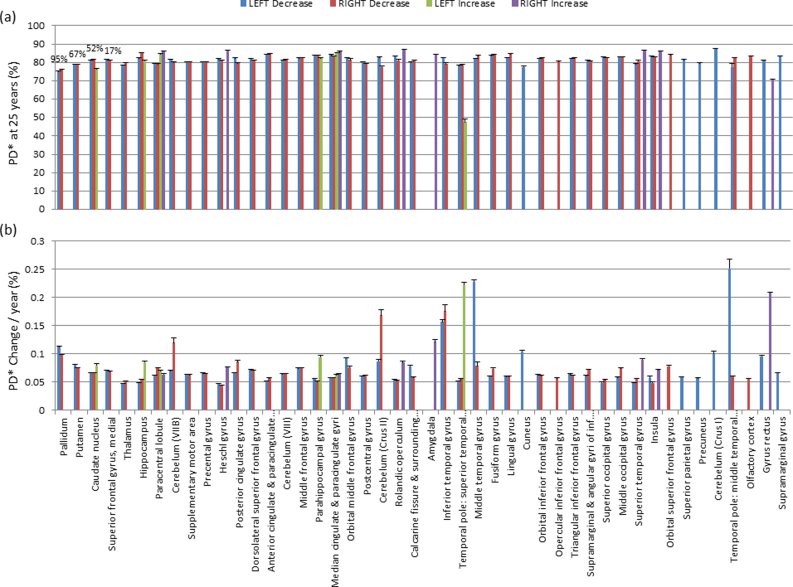
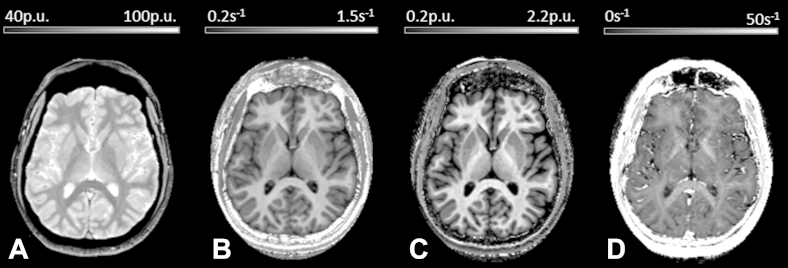
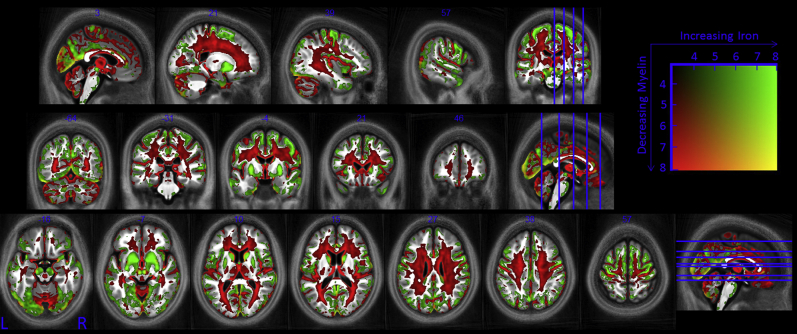
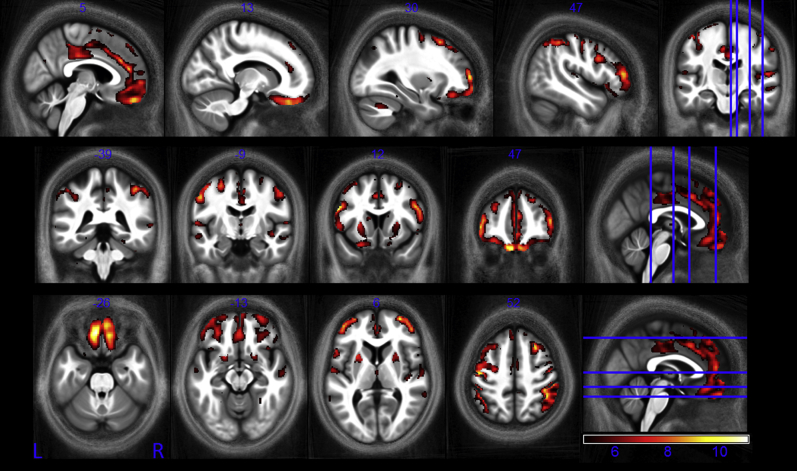
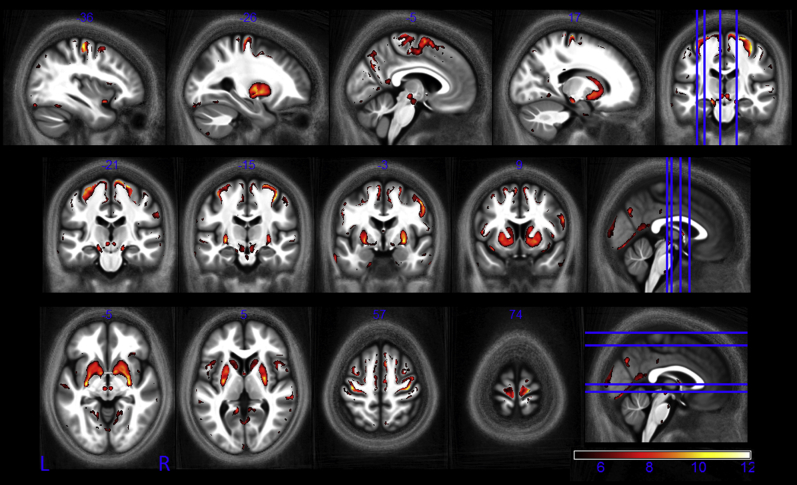
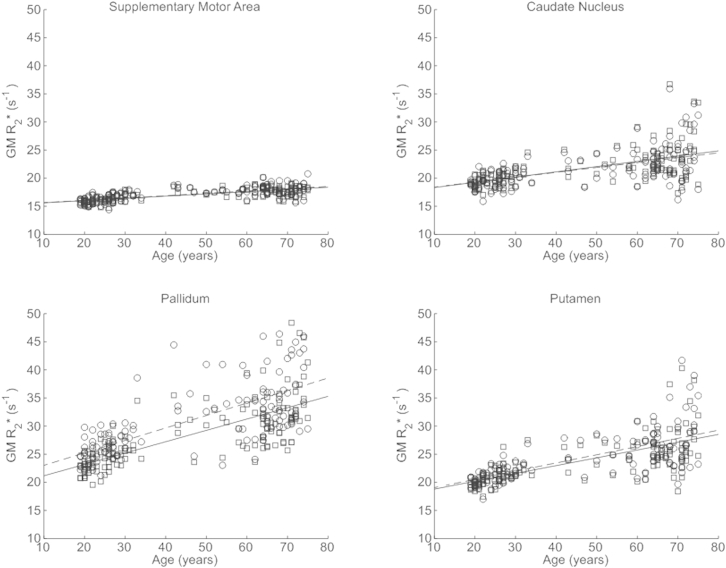
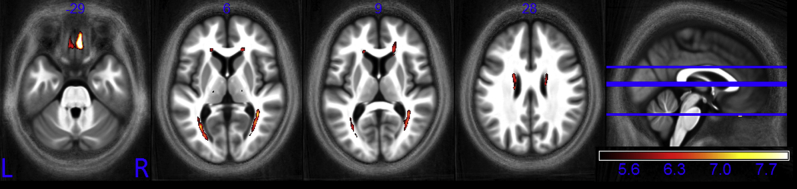
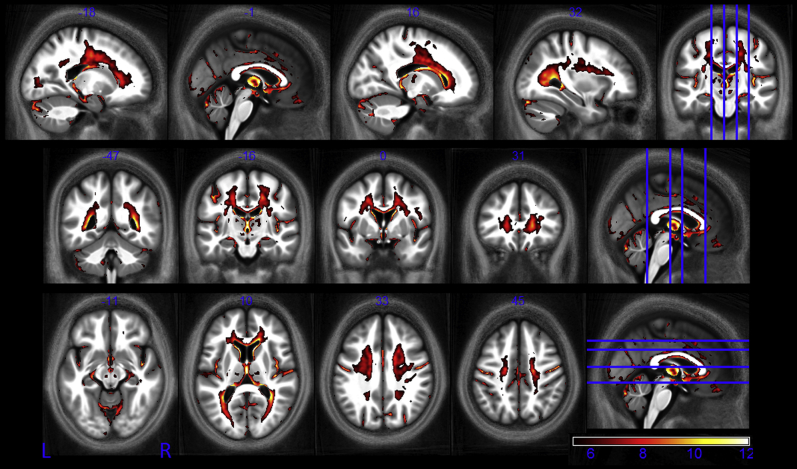
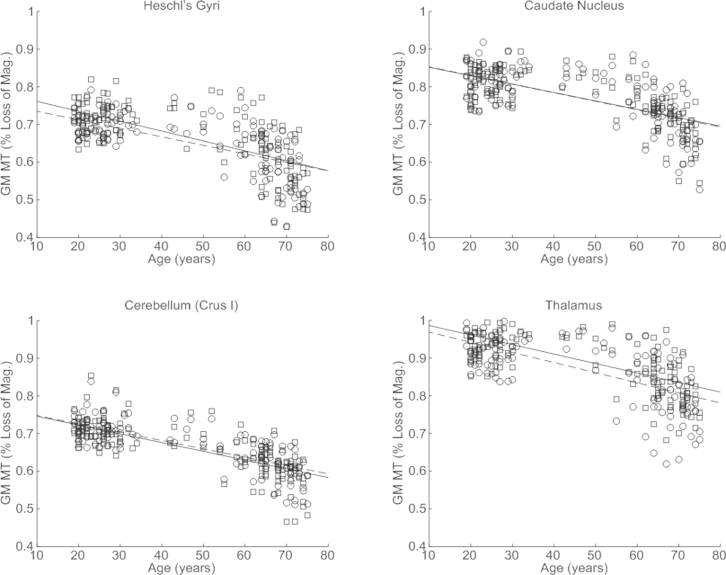
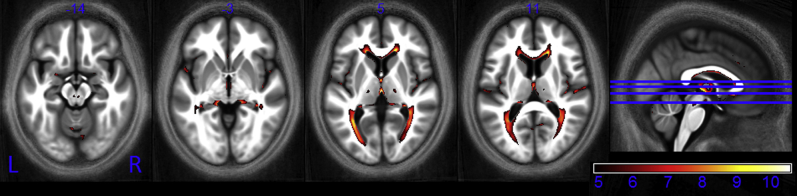
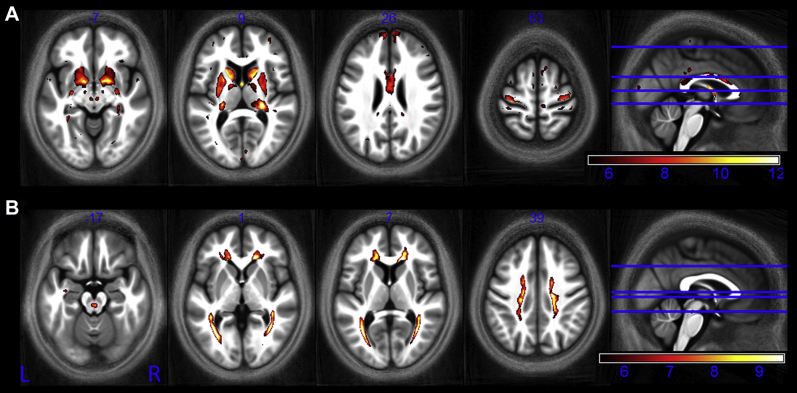
A pressing need exists to disentangle age-related changes from pathologic neurodegeneration. This study aims to characterize the spatial pattern and age-related differences of biologically relevant measures in vivo over the course of normal aging. Quantitative multiparameter maps that provide neuroimaging biomarkers for myelination and iron levels, parameters sensitive to aging, were acquired from 138 healthy volunteers (age range: 19-75 years). Whole-brain voxel-wise analysis revealed a global pattern of age-related degeneration. Significant demyelination occurred principally in the white matter. The observed age-related differences in myelination were anatomically specific. In line with invasive histologic reports, higher age-related differences were seen in the genu of the corpus callosum than the splenium. Iron levels were significantly increased in the basal ganglia, red nucleus, and extensive cortical regions but decreased along the superior occipitofrontal fascicle and optic radiation. This whole-brain pattern of age-associated microstructural differences in the asymptomatic population provides insight into the neurobiology of aging. The results help build a quantitative baseline from which to examine and draw a dividing line between healthy aging and pathologic neurodegeneration.

Keywords: 3T; Aging; MT; Magnetization transfer; Quantitative; R1; R2*; Relaxation; T1; T2*; VBQ; Water content.


Figures

Supplementary Fig. 1
Parameters of the linear fit to R2* in gray matter masked areas defined by the AAL atlas that showed significant increase with age. R2* at the age of 25 years is shown in (A) and the rate of increase of R2* with age is shown in (B). The ROIs are ordered from left to right with decreasing percentage of ROI that significantly correlated with age. The mean (across hemispheres) percentage of significant voxels is noted for those ROIs exceeding 10%. The peak t score within the ROIs ranged from 5.4 to 11.2. Abbreviations: AAL, automated anatomical labeling; ROI, region of interest.
Supplementary Fig. 2
Parameters of the linear fit to MT in gray matter masked areas defined by the AAL atlas that showed significant decrease with age. MT at the age of 25 years is shown in (A) and the rate of decrease of MT with age is shown in (B). The ROIs are ordered from left to right with decreasing percentage of ROI that significantly correlated with age. The mean (across hemispheres) percentage of significant voxels is noted for those ROIs exceeding 10%. The peak t score within the ROIs ranged from 5.7 to 13.9. Abbreviations: AAL, automated anatomical labeling; MT, magnetization transfer; ROI, region of interest.
Supplementary Fig. 3
Parameters of the linear fit to R1 in gray matter masked areas defined by the AAL atlas that showed significant decrease with age. R1 at the age of 25 years is shown in (A) and the rate of decrease of R1 with age is shown in (B). The ROIs are ordered from left to right with decreasing percentage of ROI that significantly correlated with age. Across both hemispheres, a mean of 17% of thalamus voxels had a significant negative correlation with age. Less than 6% of consitutent voxels were significantly correlated for the other ROIs. The peak t score within the ROIs ranged from 5.4 to 10.9. Abbreviations: AAL, automated anatomical labeling; ROI, region of interest.
Supplementary Fig. 4
Parameters of the linear fit to PD* in gray matter masked areas defined by the AAL atlas that showed significant change with age. PD* at the age of 25 years is shown in (A) and the rate of increase (green, purple) or decrease (blue, red) of PD* with age is shown in (B). The ROIs are ordered from left to right with decreasing percentage of ROI that significantly correlated with age. The mean percentage (across hemispheres) of the ROIs with more than 10% of constituent voxels showing a negative correlation with age are noted. No positive correlation had more than 1.2% of consituent voxels showing significance. The peak tscore within the ROIs ranged from 5.5 to 11.8. Abbreviations: AAL, automated anatomical labeling; ROI, region of interest.
Fig. 1
Fig. 1
Example maps of an individual volunteer: effective proton density, PD* (A); longitudinal relaxation rate, R1 (B); magnetization transfer, MT (C), and transverse relaxation rate, R2* (D).
Fig. 2
Fig. 2
Whole brain pattern of aging. Myelin reductions are estimated from R1 and MT decreases while iron increases are estimated from increased R2*. This figure is thresholded at the p < 0.001 uncorrected level for display purposes only. The t score for the combined effects is indicated by the color square. Abbreviations: MT, magnetization transfer; R1, longitudinal relaxation rate; R2*, transverse relaxation rate.
Fig. 3
Fig. 3
Statistical parameter maps identify regions in which GM atrophy occurs with age at the p < 0.05 FWE corrected level. The statistical parametric maps were superimposed on the mean MT map for the cohort in MNI space. Abbreviations: FWE, family-wise error; GM, gray matter; MT, magnetization transfer.
Fig. 4
Fig. 4
Statistical parametric maps of regions in which R2* significantly increased with age at the p < 0.05 FWE corrected level. The SPMs (of both the GM and WM analyses) are superimposed on the mean MT map for the cohort in MNI space. The color bar indicates the t score. Abbreviations: FWE, family-wise error; GM, gray matter; MT, magnetization transfer; WM, white matter.
Fig. 5
Fig. 5
Significant increase in apparent transverse relaxation rate (R2*) in gray matter masked regions of the supplementary motor cortex, caudate nucleus, pallidum, and putamen as a function of age. Similar patterns were observed in the left (circles) and right (squares) hemisphere. The lines (left dashed, right solid) depict the linear model fit. These data are shown for illustration purposes only and were not used for any additional analyses.
Fig. 6
Fig. 6
Statistical parametric maps of regions in which R2* significantly decreased with age at the p < 0.05 FWE corrected level. The SPMs (of both the GM and WM analyses) are superimposed on the mean MT map for the cohort in MNI space. The color bar indicates the t score. Abbreviations: FWE, family-wise error; GM, gray matter; MT, magnetization transfer; WM, white matter.
Fig. 7
Fig. 7
Statistical parametric maps of regions in which MT significantly decreased with age at the p < 0.05 FWE corrected level. The SPMs are superimposed on the mean MT map for the cohort in MNI space. The color bar indicates the t score. Abbreviations: FWE, family-wise error; MT, magnetization transfer.
Fig. 8
Fig. 8
Significant decrease in magnetization transfer (MT) in Heschl gyri, the caudate nucleus, cerebellum (crus I), and thalamus as a function of age. Similar patterns were observed in the left (circles) and right (squares) hemisphere. The lines (left dashed, right solid) depict the mean behavior modeled by the linear fit. There appear to be nonlinear effects and rapid decline after 60 years in all regions. These data are shown for illustration purposes only and were not used for any additional analyses.
Fig. 9
Fig. 9
Statistical parametric maps of regions in which R1 significantly decreased with age at the p < 0.05 FWE corrected level. The SPMs were superimposed on the mean MT map for the cohort in MNI space. The color bar indicates the t score. Abbreviations: FWE, family-wise error; MT, magnetization transfer.
Fig. 10
Fig. 10
Statistical parametric maps identify regions in which PD* significantly (A) decreased with age and (B) increased with age at the p < 0.05 FWE corrected level. The SPMs were superimposed on the mean MT map for the cohort in MNI space. The color bar indicates the t score for the decrease with age in A and the increase with age in B. Abbreviations: FWE, family-wise error; MT, magnetization transfer.

Similar articles

Cited by

References

    1. Adinolfi A.M., Yamuy J., Morales F.R., Chase M.H. Segmental demyelination in peripheral nerves of old cats. Neurobiol. Aging. 1991;12:175–179. - PubMed
    1. Ashburner J. A fast diffeomorphic image registration algorithm. Neuroimage. 2007;38:95–113. - PubMed
    1. Ashburner J., Friston K.J. Unified segmentation. Neuroimage. 2005;26:839–851. - PubMed
    1. Aston-Jones G., Rogers J., Shaver R.D., Dinan T.G., Moss D.E. Age-impaired impulse flow from nucleus basalis to cortex. Nature. 1985;318:462–464. - PubMed
    1. Barkhof F., Calabresi P.A., Miller D.H., Reingold S.C. Imaging outcomes for neuroprotection and repair in multiple sclerosis trials. Nat. Rev. Neurol. 2009;5:256–266. - PubMed

Publication types

Supplementary concepts