. 2014 May;8(3):753-65.
doi: 10.1016/j.molonc.2014.02.008. Epub 2014 Mar 6.

Sialyl Tn-expressing bladder cancer cells induce a tolerogenic phenotype in innate and adaptive immune cells

Affiliations

Sialyl Tn-expressing bladder cancer cells induce a tolerogenic phenotype in innate and adaptive immune cells

Mylène A Carrascal et al. Mol Oncol. 2014 May.

Abstract

Despite the wide acceptance that glycans are centrally implicated in immunity, exactly how they contribute to the tilt immune response remains poorly defined. In this study, we sought to evaluate the impact of the malignant phenotype-associated glycan, sialyl-Tn (STn) in the function of the key orchestrators of the immune response, the dendritic cells (DCs). In high grade bladder cancer tissue, the STn antigen is significantly overexpressed and correlated with the increased expression of ST6GALNAC1 sialyltransferase. Bladder cancer tissue presenting elevated expression of ST6GALNAC1 showed a correlation with increased expression of CD1a, a marker for bladder immature DCs and showed concomitant low levels of Th1-inducing cytokines IL-12 and TNF-α. In vitro, human DCs co-incubated with STn(+) bladder cancer cells, had an immature phenotype (MHC-II(low), CD80(low) and CD86(low)) and were unresponsive to further maturation stimuli. When contacting with STn(+) cancer cells, DCs expressed significantly less IL-12 and TNF-α. Consistent with a tolerogenic DC profile, T cells that were primed by DCs pulsed with antigens derived from STn(+) cancer cells were not activated and showed a FoxP3(high) IFN-γ(low) phenotype. Blockade of STn antigens and of STn(+) glycoprotein, CD44 and MUC1, in STn(+) cancer cells was able to lower the induction of tolerance and DCs become more mature. Overall, our data suggest that STn-expressing cancer cells impair DC maturation and endow DCs with a tolerogenic function, limiting their capacity to trigger protective anti-tumour T cell responses. STn antigens and, in particular, STn(+) glycoproteins are potential targets for circumventing tumour-induced tolerogenic mechanisms.

Keywords: CD44; Dendritic cells; Immunological potency; Mucins; Sialyl-Tn; T cells.


Figures

Figure 1
Figure 1
Bladder cancer tissues show differential expression of STn antigen, CD1a, IL‐12 and TNF‐α cytokines. A: Analysis of STn expression in high grade tumour bladder cancer tissue. Representative image of a paraffin embedded section, processed for immunohistochemical staining with anti‐STn mAb. STn expression was detected in tumour tissue. B: Association between ST6GALNAC1 and STn expression in bladder tumours. STn expression was determined in low and high grade bladder tumours, by immunohistochemistry, using TKH2 mAbs. Specimens were then selected and distributed into three groups, according to their expression of STn related with the tumour bulk: 0%, 0–15% and more than 15% of tissue expressing STn. The relative mRNA levels of ST6GALNAC1 gene, in the paraffin‐embedded sections, was analysed individually, by real time PCR and paired compared with data regarding STn expression. Values infer the number of mRNA molecules of a ST6GALNAC1 gene, per 1000 molecules of the average of the endogenous controls. C: Gene expression analysis in bladder tissue. The relative mRNA levels of CD1a, IL‐12 and TNF‐α cytokines and ST6GALNAC1 genes were analysed by real time RT‐PCR in specimens from low and high grade non‐muscle invasive bladder cancer (NMIBC) (n = 22 and n = 21, respectively) and muscle invasive bladder cancer (MIBC) (n = 6) tissues and also from matched normal urothelium (n = 49). Values infer the number of mRNA molecules of each gene per 1000 molecules of the average of the endogenous controls. CD1a and ST6GALNAC1 expression was significantly increased in all tumour tissue, as compared with matched urothelium; while IL‐12 and TNF‐α cytokines were decreased (p < 0.05 (*) and p < 0.01 (**)). In general, the differences were more evident in high grade NMIBC.
Figure 2
Figure 2
Mo‐DCs adhere preferentially to STn+ MCR cell line and show a less mature phenotype. A: Overexpression of ST6GALNAC1 in MCR bladder cancer cells. MCR cells were transduced or not with a retroviral vector expressing the whole coding region of human ST6GALNAC1. Both negative control (MCRcont) and ST6GALNAC1‐transduced (MCRSTn) cell lines were stained with anti‐STn or anti‐ST6GALNAC1 mAbs and then analysed by confocal microscopy. The MCRSTn cell line, but not MCRcont cells expressed the STn antigen and ST6GALNAC1. B: Characteristics of mo‐DCs adherent to MCR cell lines. Mo‐DCs were cocultured with MCR cell lines and after 2 h incubation, non‐adherent mo‐DCs were washed and the percentage of mo‐DCs adherent to MCR cell lines was estimated by flow cytometry, as the total of MHC‐II+ cells in the coculture, following staining with APC‐labelled anti‐MHC‐II mAb. The mean number of mo‐DCs adhering to MCR cells was significantly higher in the co‐incubation with MCRSTn than with MCRcont (p = 0.045 (*), n = 14). C‐E: Analysis of mo‐DC maturation and co‐stimulatory profile. Adherent mo‐DCs were stained with anti‐MHC‐II (C), anti‐CD80 (D) or CD86 (E) mAbs and then analysed by flow cytometry. The expression level of the antigens was inferred from the mean fluorescence intensity (MFI) of the cells. Values are displayed as box‐and‐whisker plot with mean and quartiles ± maximum/minimum of 5 independent assays. The expression of MHC‐II and CD80 was significantly different in mo‐DCs co‐incubated with MCRSTn, as compared with MCRcont (p = 0.0043 (**) and p = 0.0438 (*), respectively). MFI values in mo‐DCs alone were comparable to mo‐DCs co‐incubated with MCRSTn, while mo‐DCs co‐incubated with MCRcont showed a significant more mature phenotype.
Figure 3
Figure 3
Co‐incubation with STn+ MCR cell line downregulates cytokine expression levels. A: The expression of TNF‐α, IL‐23, IL‐12 and IL‐10 cytokine genes was evaluated by quantitative real‐time PCR. The relative mRNA levels for each cytokine are expressed as the permillage (‰) of the expression of the endogenous positive controls. Values represent the means of at least 5 independent assays. The expression of TNF‐α, IL‐12, IL‐23 and IL‐10 were significantly decreased (p = 0.015 (*), p = 0.031 (*), p = 0.034 (*) and p = 0.015 (*) respectively) in mo‐DCs co‐incubated with MCRSTn as compared with those incubated with MCRcont.
Figure 4
Figure 4
STn+ MCR cell lines are better phagocytosed by mo‐DCs. Both MCRcont and MCRSTn cell lines were labelled with CFSE and then induced to apoptosis. Cells were then incubated with mo‐DCs to allow phagocytosis, in the proportion of 1:2 for 6 h at 37 °C or 4 °C and then stained with anti‐MHC‐II mAb. A: Flow cytometric analysis of percentage of mo‐DCs that phagocytosed MCR cells lines. The percentage of mo‐DCs that phagocytosed MCR cells was calculated based on the positivity for both MHC‐II and CFSE staining. The values obtained at 4 °C were subtracted from the 37 °C values. MCRSTn cells were significantly more phagocytosed than MCRcont (p = 0.001 (**), n = 4). B: Microscopic analysis of mo‐DCs that phagocytosed MCR cells lines. Representative confocal microscopy image showing mo‐DCs that phagocytosed MCRSTn cells [MHC‐II+ (red)/CFSE+ (green)]. The image is representative of a confocal cross‐section image, selected from Z‐stack images.
Figure 5
Figure 5
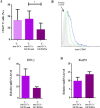
T cell activation is reduced when primed with mo‐DCs that phagocytosed STn+ cancer cells. Mo‐DCs were allowed to phagocytose MCR cells and then incubated with autologous T cells (1:8 proportion). A–B: The coculture was analysed by flow cytometry for the expression of the T cell early activation marker CD69. A: Graphical representation of the percentage of CD69+ T cells. Data was determined by the percentage of CD69+, within the CD3 population (n = 3). Mo‐DCs that phagocytosed MCRSTn cells induce significantly less activation in T cells than mo‐DCs that phagocytosed MCRcont cells (p = 0.026 (*)). B: A representative CD69 histogram for T cells following priming with mo‐DCs that phagocytosed MCRcont (solid line) or MCRSTn (dashed line) cell line. Expression of CD69 by resting T cells is shown as staining control (grey filled peak). C–D: The coculture was analysed by quantitative real‐time PCR regarding the expression of IFN‐γ and FoxP3 genes. The relative mRNA levels for each gene are expressed as the permillage (‰) of the expression of the endogenous positive controls. C: The expression of IFN‐γ was reduced by 54% (p = 0.074) in T cells co‐incubated with mo‐DCs that phagocytosed MCRSTn as compared to controls (n = 4). D: T cells co‐incubated with mo‐DCs that phagocytosed MCRSTn expressed 39% (p = 0.081) more FoxP3 than control mo‐DCs (n = 4).
Figure 6
Figure 6
STn+ glycoproteins blockade restore mo‐DCs maturation. A–B: MCR cell lines were analysed by flow cytometry regarding the expression of possible scaffolds of STn, CD44 and MUC1 glycoproteins. MCRcont (dashed line) and MCRSTn (solid line) cell lines were stained with anti‐CD44 (A) or anti‐MUC1 (B) mAb (not filled peaks) or only with secondary mAb (grey filled peak) as staining control. Both MCR cell lines express similarly CD44 and MUC1 glycoproteins. C: Analysis of STn+ proteins in cancer cells. Total protein lysates from MCRSTn cell line (left image) and primary bladder tumour samples (right image) were treated (T) or not (NT) with sialidase. CD44 immunoprecipitation (IP) from MCRSTn total proteins was performed using Pierce Direct IP Kit (middle image). Cell lysates and CD44 IP were separated and the proteins were transferred to nitrocellulose membrane and stained with anti‐STn mAb (clone TKH2). MCRSTn cells showed three proteins (≈75 KDa, 150 KDa and 260 KDa) decorated with STn and the most prominent STn+ protein showed a molecular weight of ≈75 KDa. As control, when the lysate was treated with sialidase, staining with anti‐STn was completely abrogated. The CD44 IP analysis showed that CD44 protein is decorated with STn in MCRSTn cells. D: The expression of MHC‐II, IL‐12 and TNF‐α is restored when blocking STn and STn+ glycoproteins. Gene expression was evaluated by quantitative real‐time PCR in mo‐DCs incubated with MCRSTn cell line in presence of anti‐CD44, ‐MUC1 or ‐STn blocking mAbs. Mo‐DC Fc receptors were previously blocked to avoid non‐specific Fc receptor‐mediated antibody binding. The expression values were calculated as described in the Material and Method section and correspond to the ratio between the expression of mo‐DCs incubated with MCRSTn cell line in presence of blocking mAbs and the expression of mo‐DCs incubated with MCRSTn in presence of isotypic control. CD44 blockade was able to increase the expression of MHC‐II, IL‐12 and TNF‐α (p = 0.0294 (*), p = 0.0357 (*), p = 0.0035 (**), n = 3). Similarly, the expression of MHC‐II, IL‐12 and TNF‐α was also increased by MUC1 and STn blockage.

Similar articles

Cited by

References

    1. Adis International, L. , 2003. Cancer vaccine THERATOPE-Biomira. Drugs R&D. 4, 236–240. - PubMed
    1. Almand, B. , Clark, J.I. , Nikitina, E. , van Beynen, J. , English, N.R. , Knight, S.C. , Carbone, D.P. , Gabrilovich, D.I. , 2001. Increased production of immature myeloid cells in cancer patients: a mechanism of immunosuppression in cancer. J. Immunol.. 166, 678–689. - PubMed
    1. Banchereau, J. , Steinman, R.M. , 1998. Dendritic cells and the control of immunity. Nature. 392, 245–252. - PubMed
    1. Beatty, J.D. , Islam, S. , North, M.E. , Knight, S.C. , Ogden, C.W. , 2004. Urine dendritic cells: a noninvasive probe for immune activity in bladder cancer?. BJU Int.. 94, 1377–1383. - PubMed
    1. Cao, Y. , Stosiek, P. , Springer, G.F. , Karsten, U. , 1996. Thomsen-Friedenreich-related carbohydrate antigens in normal adult human tissues: a systematic and comparative study. Histochem. Cell Biol.. 106, 197–207. - PubMed

Publication types

MeSH terms

Substances