Methotrexate modulates folate phenotype and inflammatory profile in EA.hy 926 cells
- PMID: 24657277
- PMCID: PMC4402228
- DOI: 10.1016/j.ejphar.2014.03.004
Methotrexate modulates folate phenotype and inflammatory profile in EA.hy 926 cells
Abstract
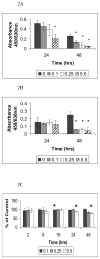
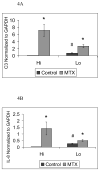
EA.hy 926 cells grown under low folate conditions adopt a "pro-atherosclerotic" morphology and biochemical phenotype. Pharmacologically relevant doses of the antifolate drug methotrexate (MTX) were applied to EA.hy 926 cells maintained in normal (Hi) and low (Lo) folate culture media. Under both folate conditions, MTX caused inhibition of cell proliferation without significantly compromising metabolic activity. MTX treated Hi cells were depleted of folate derivatives, which were present in altered proportions relative to untreated cells. Transcript profiling using microarrays indicated that MTX treatment modified the transciptome in similar ways for both Hi and Lo cells. Many inflammation-related genes, most prominently those encoding C3 and IL-8, were up-regulated, whereas many genes involved in cell division were down-regulated. The results for C3 and IL-8 were confirmed by quantitative RT-PCR and ELISA. MTX appears to modify the inflammatory potential of EA.hy 926 cells such that its therapeutic properties may, at least under some conditions, be accompanied by the induction of a subset of gene products that promote and/or maintain comorbid pathologies.
Keywords: Folate; Gene expression; Immune modulation; Inflammation; Methotrexate.
Copyright © 2014 Elsevier B.V. All rights reserved.
Conflict of interest statement
The authors have no financial conflicts of interest.
Figures


Similar articles
-
Pemetrexed alters folate phenotype and inflammatory profile in EA.hy 926 cells grown under low-folate conditions.Eur J Pharmacol. 2012 Dec 5;696(1-3):12-7. doi: 10.1016/j.ejphar.2012.08.008. Epub 2012 Sep 5. Eur J Pharmacol. 2012. PMID: 22975265 Free PMC article.
-
The up-regulation of monocyte chemoattractant protein-1 (MCP-1) in Ea.hy 926 endothelial cells under long-term low folate stress is mediated by the p38 MAPK pathway.Atherosclerosis. 2009 Jul;205(1):48-54. doi: 10.1016/j.atherosclerosis.2008.12.008. Epub 2008 Dec 13. Atherosclerosis. 2009. PMID: 19152916 Free PMC article.
-
Regulation of carrier-mediated transport of folates and antifolates in methotrexate-sensitive and-resistant leukemia cells.Adv Enzyme Regul. 1997;37:59-76. doi: 10.1016/s0065-2571(96)00012-x. Adv Enzyme Regul. 1997. PMID: 9381986
-
The role of multidrug resistance efflux transporters in antifolate resistance and folate homeostasis.Drug Resist Updat. 2006 Aug-Oct;9(4-5):227-46. doi: 10.1016/j.drup.2006.09.001. Epub 2006 Nov 7. Drug Resist Updat. 2006. PMID: 17092765 Review.
-
Folate and antifolate pharmacology.Semin Oncol. 1997 Oct;24(5 Suppl 18):S18-30-S18-39. Semin Oncol. 1997. PMID: 9420019 Review.
Cited by
-
The actions of methotrexate on endothelial cells are dependent on the shear stress-induced regulation of one carbon metabolism.Front Immunol. 2023 Jun 30;14:1209490. doi: 10.3389/fimmu.2023.1209490. eCollection 2023. Front Immunol. 2023. PMID: 37457690 Free PMC article.
-
Protective Effects of Methotrexate against Proatherosclerotic Cytokines: A Review of the Evidence.Mediators Inflamm. 2017;2017:9632846. doi: 10.1155/2017/9632846. Epub 2017 Dec 21. Mediators Inflamm. 2017. PMID: 29430085 Free PMC article. Review.
-
Berberine improves mesenteric artery insulin sensitivity through up-regulating insulin receptor-mediated signalling in diabetic rats.Br J Pharmacol. 2016 May;173(10):1569-79. doi: 10.1111/bph.13466. Epub 2016 Apr 5. Br J Pharmacol. 2016. PMID: 26914282 Free PMC article.
References
-
- Brown KS, Huang Y, Lu ZY, Jian W, Blair IA, Whitehead AS. Mild folate deficiency induces a proatherosclerotic phenotype in endothelial cells. Atherosclerosis. 2006;189:133–141. - PubMed
-
- Choi HK, Hernan MA, Seeger JD, Robins JM, Wolfe F. Methotrexate and mortality in patients with rheumatoid arthritis: a prospective study. Lancet. 2002;359:1173–1177. - PubMed
-
- Coury FF, Weinblatt ME. Clinical trials to establish methotrexate as a therapy for rheumatoid arthritis. Clin Exp Rheumatol. 2010;28:S9–12. - PubMed
-
- Hammons AL, Summers CM, Woodside JV, McNulty H, Strain JJ, Young IS, Murray L, Boreham CA, Scott JM, Mitchell LE, Whitehead AS. Folate/homocysteine phenotypes and MTHFR 677C>T genotypes are associated with serum levels of monocyte chemoattractant protein-1. Clin Immunol. 2009;133:132–137. - PMC - PubMed
Publication types
MeSH terms
Substances
Grants and funding
LinkOut - more resources
Full Text Sources
Other Literature Sources
Medical
Miscellaneous

