

Coupling interval variability differentiates ventricular ectopic complexes arising in the aortic sinus of valsalva and great cardiac vein from other sources: mechanistic and arrhythmic risk implications
- PMID: 24657687
- PMCID: PMC4282189
- DOI: 10.1016/j.jacc.2014.02.551
Coupling interval variability differentiates ventricular ectopic complexes arising in the aortic sinus of valsalva and great cardiac vein from other sources: mechanistic and arrhythmic risk implications
Abstract
Objectives: The objective of this study was to determine whether premature ventricular contractions (PVCs) arising from the aortic sinuses of Valsalva (SOV) and great cardiac vein (GCV) have coupling interval (CI) characteristics that differentiate them from other ectopic foci.
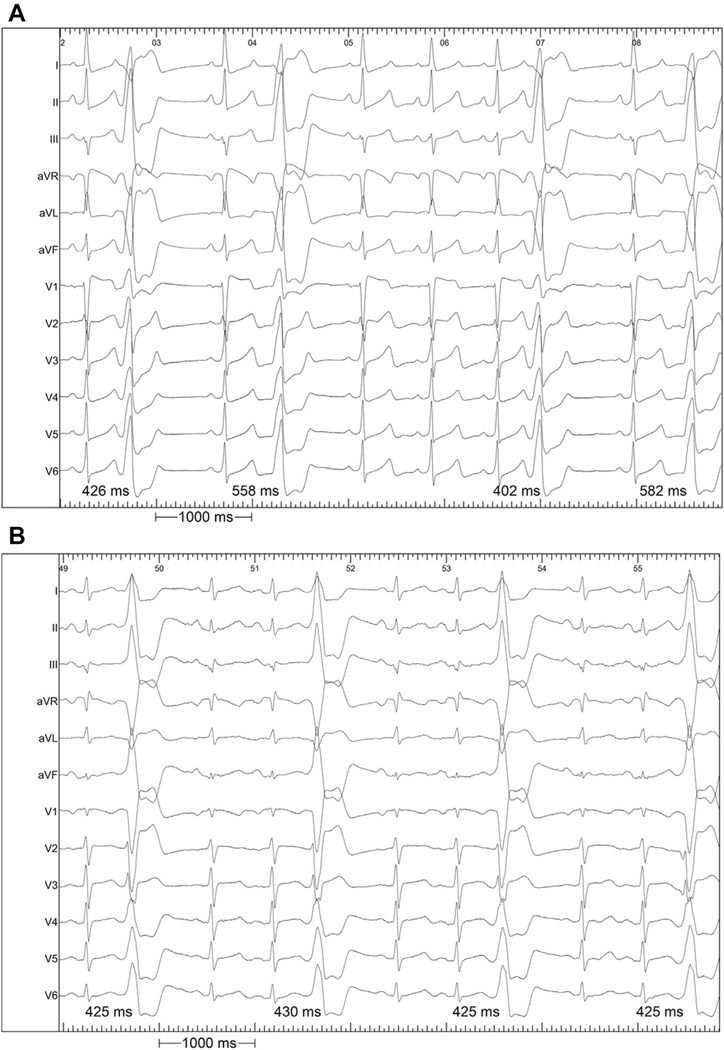
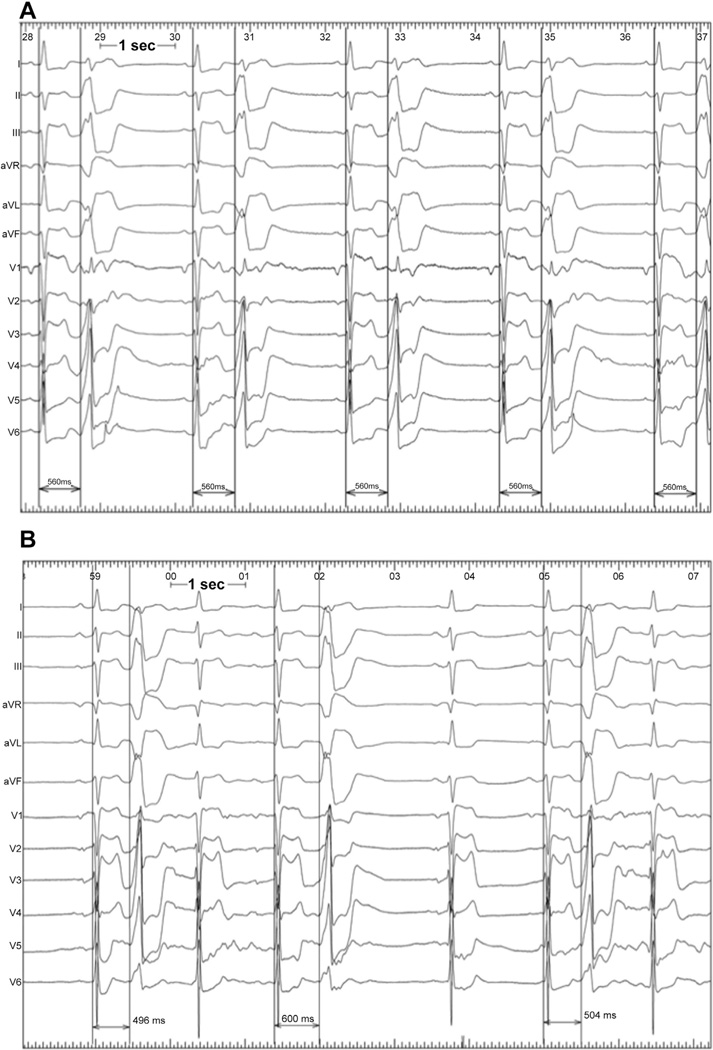
Background: PVCs occur at relatively fixed CI from the preceding normal QRS complex in most patients. However, we observed patients with PVCs originating in unusual areas (SOV and GCV) in whom the PVC CI was highly variable. We hypothesized that PVCs from these areas occur seemingly randomly because of the lack of electrotonic effects of the surrounding myocardium.
Methods: Seventy-three consecutive patients referred for PVC ablation were assessed. Twelve consecutive PVC CIs were recorded. The ΔCI (maximum - minimum CI) was measured.
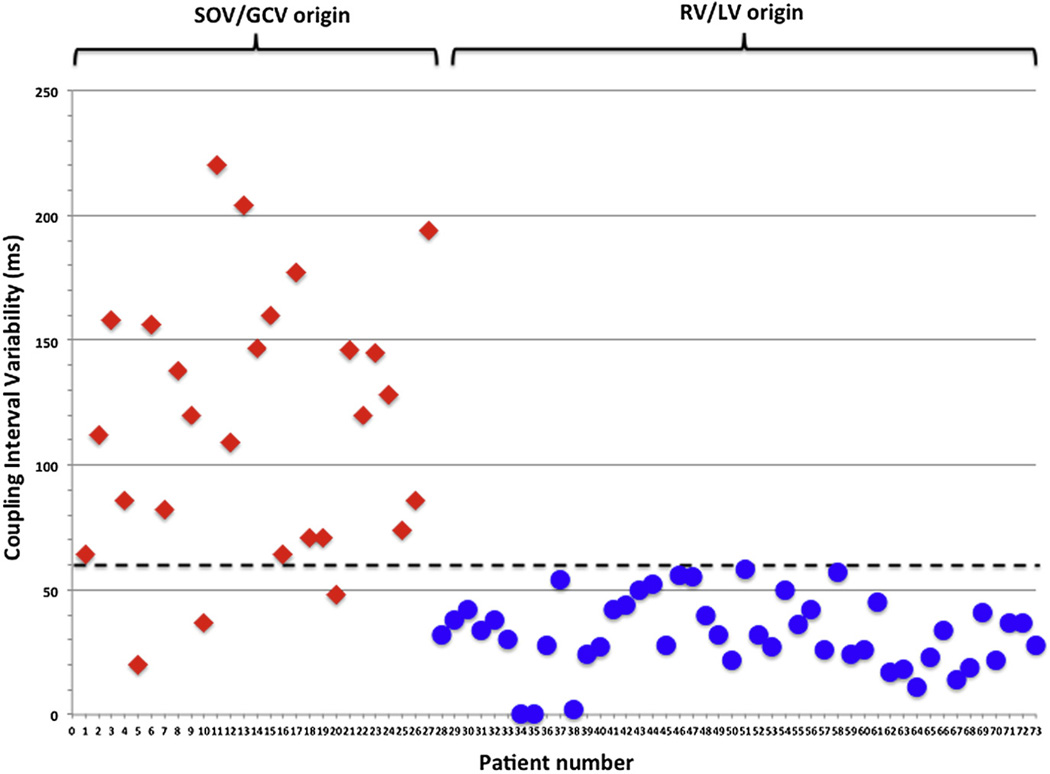
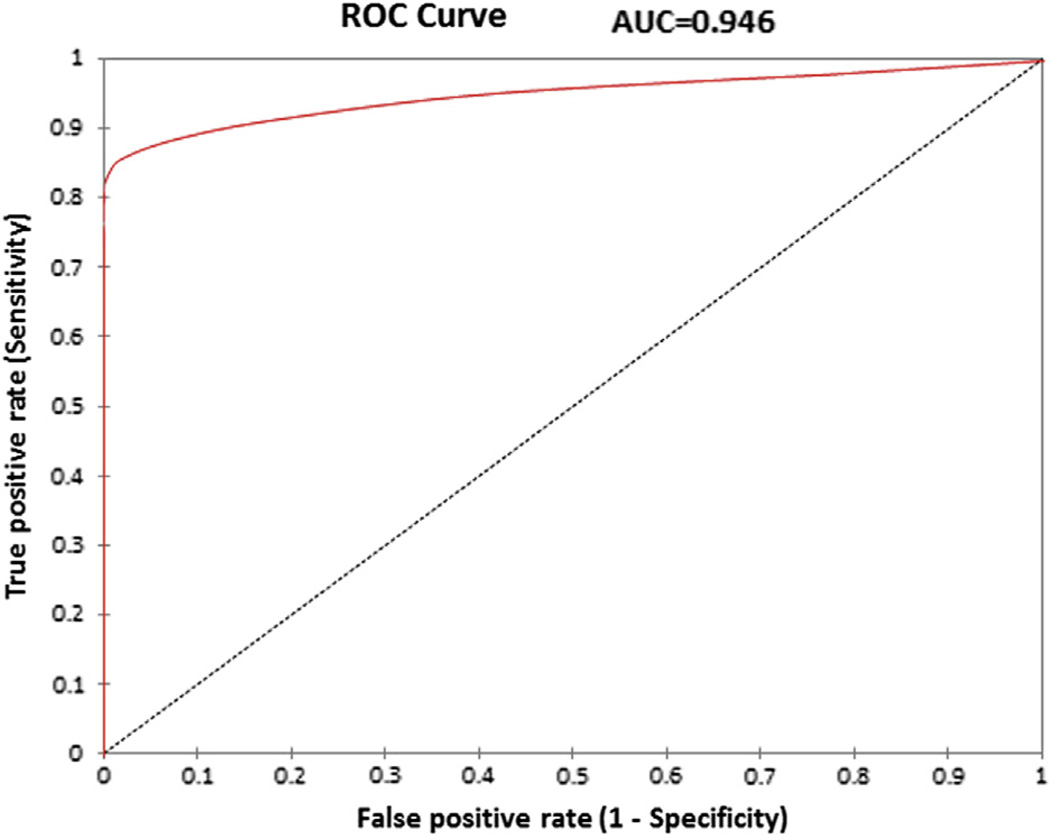
Results: We studied 73 patients (age 50 ± 16 years, 47% male). The PVC origin was right ventricular (RV) in 29 (40%), left ventricular (LV) in 17 (23%), SOV in 21 (29%), and GCV in 6 (8%). There was a significant difference between the mean ΔCI of RV/LV PVCs compared with SOV/GCV PVCs (33 ± 15 ms vs. 116 ± 52 ms, p < 0.0001). A ΔCI of >60 ms demonstrated a sensitivity of 89%, specificity of 100%, positive predictive value of 100%, and negative predictive value of 94%. Cardiac events were more common in the SOV/GCV group versus the RV/LV group (7 of 27 [26%] vs. 2 of 46 [4%], p < 0.02).
Conclusions: ΔCI is more pronounced in PVCs originating from the SOV or GCV. A ΔCI of 60 ms helps discriminate the origin of PVCs before diagnostic electrophysiological study and may be associated with increased frequency of cardiac events.
Keywords: aortic sinus of Valsalva; coupling interval; great cardiac vein; premature ventricular contraction.
Copyright © 2014 American College of Cardiology Foundation. Published by Elsevier Inc. All rights reserved.
Figures
Similar articles
-
Predicting value of coupling interval variability in determining the origin of ventricular premature contractions with V3 transition.J Interv Card Electrophysiol. 2018 Nov;53(2):169-174. doi: 10.1007/s10840-018-0381-8. Epub 2018 May 8. J Interv Card Electrophysiol. 2018. PMID: 29737447
-
Catheter Ablation of Premature Ventricular Contractions Originating in the Aortic Sinus Cusp or Great Cardiac Vein: Two QRS Morphologies with One Origin.Pacing Clin Electrophysiol. 2015 Sep;38(9):1029-38. doi: 10.1111/pace.12652. Epub 2015 Jun 20. Pacing Clin Electrophysiol. 2015. PMID: 25953101
-
Idiopathic premature ventricular complexes originating from the distal great cardiac vein: Clinical, cardiac and electrophysiological characteristics and catheter ablation outcome.Life Sci. 2018 Jun 1;202:61-69. doi: 10.1016/j.lfs.2018.04.001. Epub 2018 Apr 4. Life Sci. 2018. PMID: 29625195
-
Electrocardiographic characteristics of ventricular arrhythmias arising from the aortic sinuses of valsalva: a case report and review of the literature.J Interv Card Electrophysiol. 2002 Dec;7(3):203-7. doi: 10.1023/a:1021375628767. J Interv Card Electrophysiol. 2002. PMID: 12510130 Review.
-
Evaluation and management of premature ventricular complexes.Cleve Clin J Med. 2013 Jun;80(6):377-87. doi: 10.3949/ccjm.80a.12168. Cleve Clin J Med. 2013. PMID: 23733905 Review.
Cited by
-
Importance Of Delayed Enhanced Cardiac MRI In Idiopathic RVOT-VT: Differentiating Mimics Including Early Stage ARVC And Cardiac Sarcoidosis.J Atr Fibrillation. 2014 Dec 31;7(4):1097. doi: 10.4022/jafib.1097. eCollection 2014 Dec. J Atr Fibrillation. 2014. PMID: 27957128 Free PMC article. Review.
-
Triptolide Attenuates Transplant Vasculopathy Through Multiple Pathways.Front Immunol. 2020 Apr 21;11:612. doi: 10.3389/fimmu.2020.00612. eCollection 2020. Front Immunol. 2020. PMID: 32373115 Free PMC article.
-
Predicting value of coupling interval variability in determining the origin of ventricular premature contractions with V3 transition.J Interv Card Electrophysiol. 2018 Nov;53(2):169-174. doi: 10.1007/s10840-018-0381-8. Epub 2018 May 8. J Interv Card Electrophysiol. 2018. PMID: 29737447
-
Catheter Ablation of Left Ventricular Summit Arrhythmia in a Patient with Critical Coronary Artery Stenosis: A Sequential Approach.J Innov Card Rhythm Manag. 2020 Oct 15;11(10):4266-4271. doi: 10.19102/icrm.2020.111004. eCollection 2020 Oct. J Innov Card Rhythm Manag. 2020. PMID: 33123415 Free PMC article.
-
Pathophysiological Mechanisms of Premature Ventricular Complexes.Front Physiol. 2020 May 13;11:406. doi: 10.3389/fphys.2020.00406. eCollection 2020. Front Physiol. 2020. PMID: 32528299 Free PMC article. Review.
References
-
- Ouyang F, Fotuhi P, Ho SY, et al. Repetitive monomorphic ventricular tachycardia originating from the aortic sinus cusp: electrocardiographic characterization for guiding catheter ablation. J Am Coll Cardiol. 2002;39:500–508. - PubMed
-
- Kanagaratnam L, Tomassoni G, Schweikert R, et al. Ventricular tachycardias arising from the aortic sinus of Valsalva: an under-recognized variant of left outflow tract ventricular tachycardia. J Am Coll Cardiol. 2001;37:1408–1414. - PubMed
-
- Yamada T, Yoshida N, Murakami Y, et al. Electrocardiographic characteristics of ventricular arrhythmias originating from the junction of the left and right coronary sinuses of Valsalva in the aorta: the activation pattern as a rationale for the electrocardiographic characteristics. Heart Rhythm. 2008;5:184–192. - PubMed
-
- Yamada T, McElderry HT, Doppalapudi H, et al. Idiopathic ventricular arrhythmias originating from the aortic root prevalence, electrocardiographic and electrophysiologic characteristics, and results of radiofrequency catheter ablation. J Am Coll Cardiol. 2008;52:139–147. - PubMed
-
- Bala R, Garcia FC, Hutchinson MD, et al. Electrocardiographic and electrophysiologic features of ventricular arrhythmias originating from the right/left coronary cusp commissure. Heart Rhythm. 2010;7:312–322. - PubMed
Publication types
MeSH terms
Grants and funding
LinkOut - more resources
Full Text Sources
Other Literature Sources
Medical
