

Salivary microbiota and metabolome associated with celiac disease
- PMID: 24657864
- PMCID: PMC4018861
- DOI: 10.1128/AEM.00362-14
Salivary microbiota and metabolome associated with celiac disease
Abstract
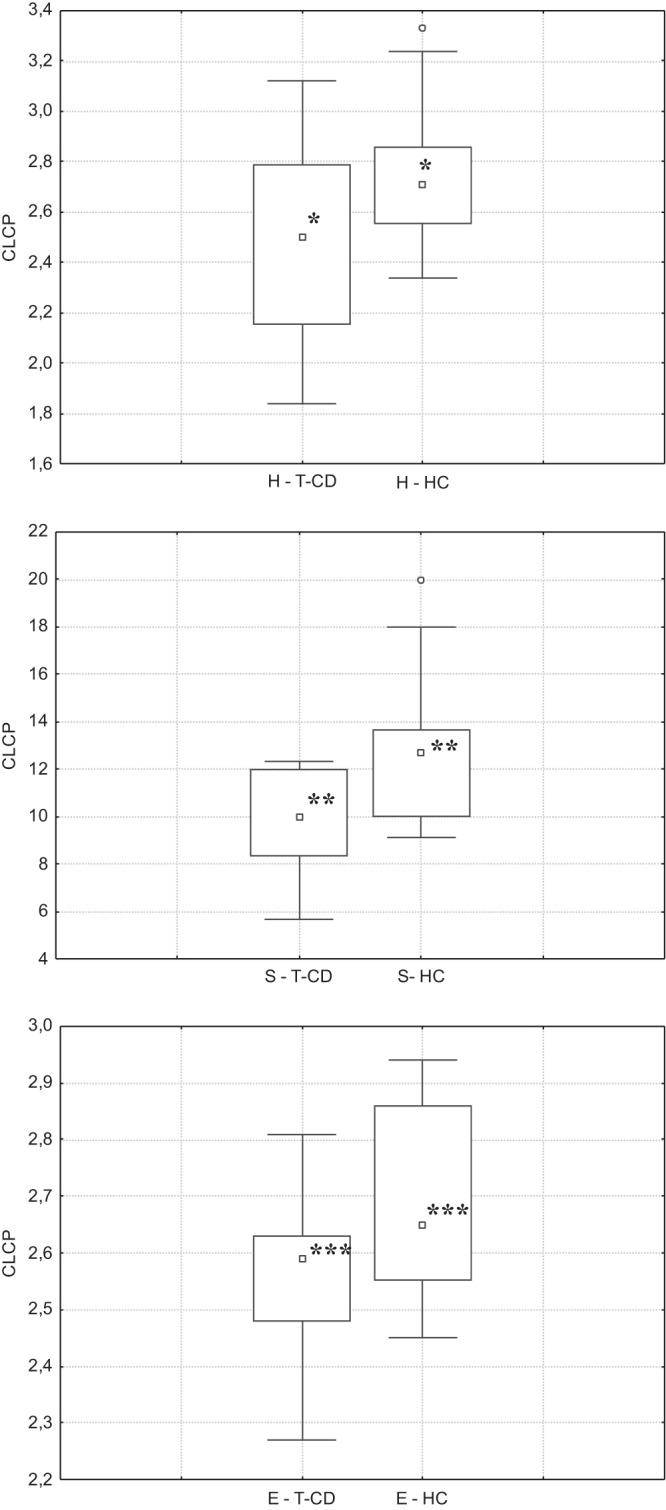
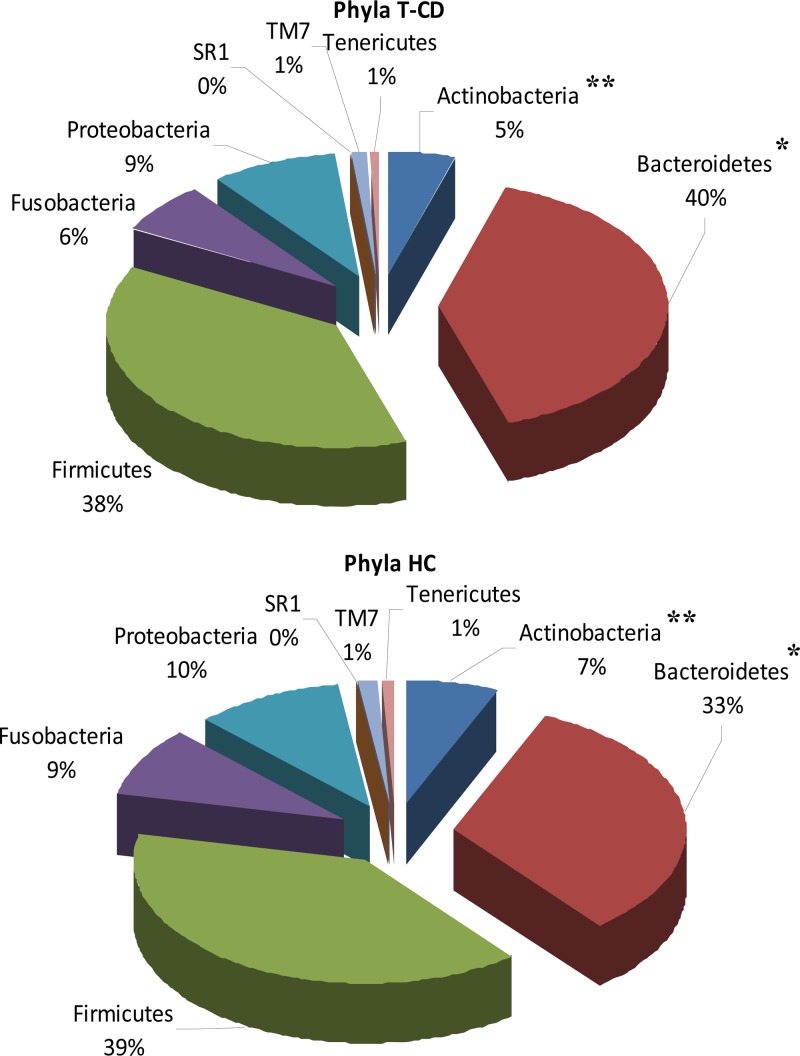
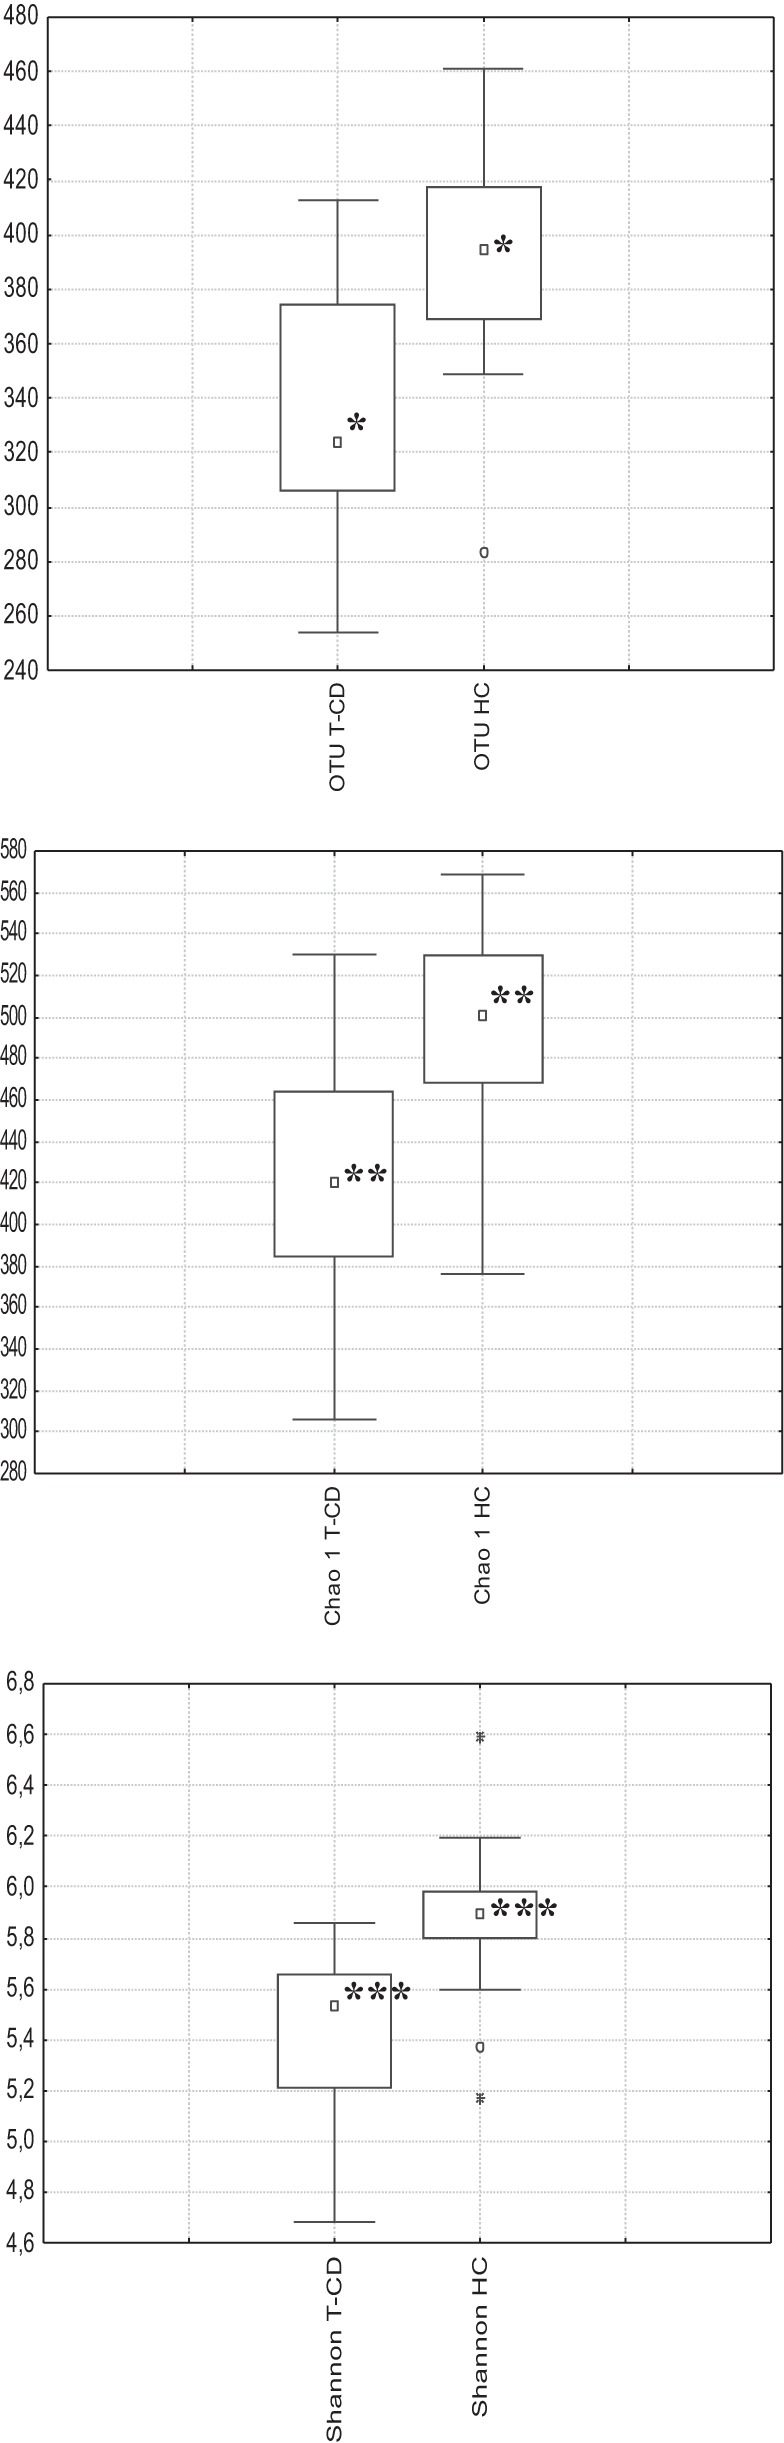
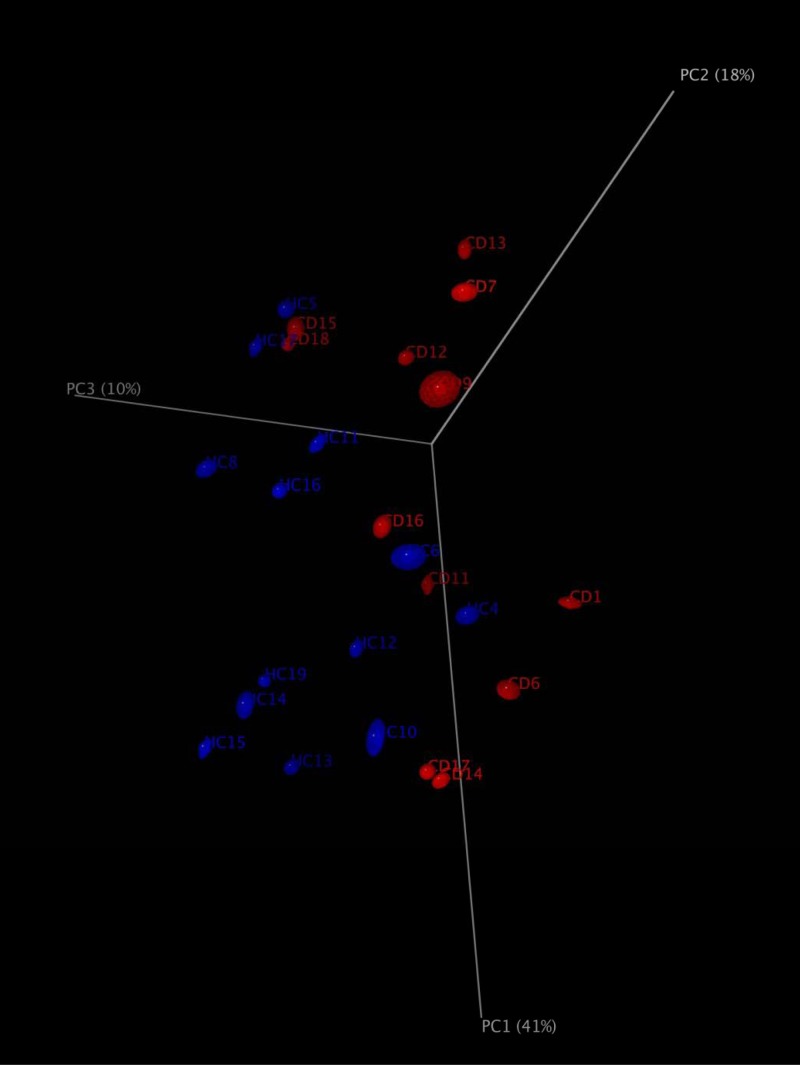
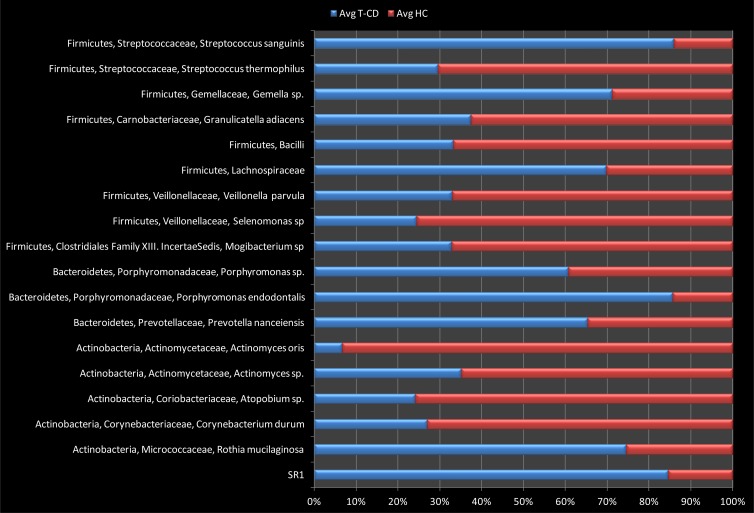
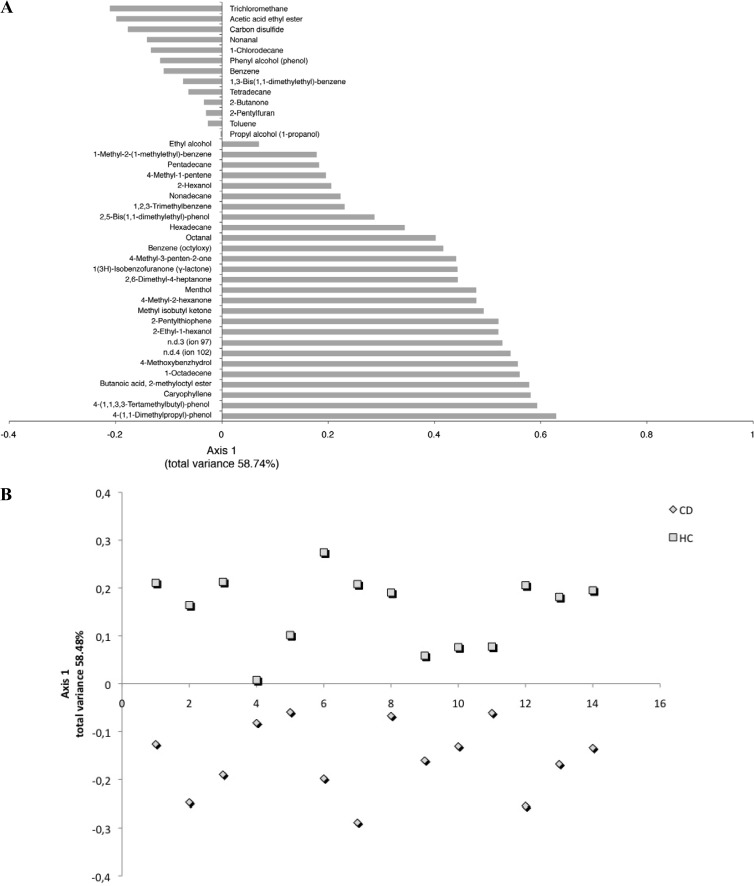
This study aimed to investigate the salivary microbiota and metabolome of 13 children with celiac disease (CD) under a gluten-free diet (treated celiac disease [T-CD]). The same number of healthy children (HC) was used as controls. The salivary microbiota was analyzed by an integrated approach using culture-dependent and -independent methods. Metabolome analysis was carried out by gas chromatography-mass spectrometry-solid-phase microextraction. Compared to HC, the number of some cultivable bacterial groups (e.g., total anaerobes) significantly (P < 0.05) differed in the saliva samples of the T-CD children. As shown by community-level catabolic profiles, the highest Shannon's diversity and substrate richness were found in HC. Pyrosequencing data showed the highest richness estimator and diversity index values for HC. Levels of Lachnospiraceae, Gemellaceae, and Streptococcus sanguinis were highest for the T-CD children. Streptococcus thermophilus levels were markedly decreased in T-CD children. The saliva of T-CD children showed the largest amount of Bacteroidetes (e.g., Porphyromonas sp., Porphyromonas endodontalis, and Prevotella nanceiensis), together with the smallest amount of Actinobacteria. T-CD children were also characterized by decreased levels of some Actinomyces species, Atopobium species, and Corynebacterium durum. Rothia mucilaginosa was the only Actinobacteria species found at the highest level in T-CD children. As shown by multivariate statistical analyses, the levels of organic volatile compounds markedly differentiated T-CD children. Some compounds (e.g., ethyl-acetate, nonanal, and 2-hexanone) were found to be associated with T-CD children. Correlations (false discovery rate [FDR], <0.05) were found between the relative abundances of bacteria and some volatile organic compounds (VOCs). The findings of this study indicated that CD is associated with oral dysbiosis that could affect the oral metabolome.
Figures
Similar articles
-
Assessment of salivary microbiota profile as a potential diagnostic tool for pediatric celiac disease.Sci Rep. 2024 Jul 19;14(1):16712. doi: 10.1038/s41598-024-67677-4. Sci Rep. 2024. PMID: 39030381 Free PMC article.
-
Duodenal and faecal microbiota of celiac children: molecular, phenotype and metabolome characterization.BMC Microbiol. 2011 Oct 4;11:219. doi: 10.1186/1471-2180-11-219. BMC Microbiol. 2011. PMID: 21970810 Free PMC article.
-
Salivary and fecal microbiota and metabolome of celiac children under gluten-free diet.Int J Food Microbiol. 2016 Dec 19;239:125-132. doi: 10.1016/j.ijfoodmicro.2016.07.025. Epub 2016 Jul 19. Int J Food Microbiol. 2016. PMID: 27452636 Review.
-
Different fecal microbiotas and volatile organic compounds in treated and untreated children with celiac disease.Appl Environ Microbiol. 2009 Jun;75(12):3963-71. doi: 10.1128/AEM.02793-08. Epub 2009 Apr 17. Appl Environ Microbiol. 2009. PMID: 19376912 Free PMC article.
-
Intestinal Microbiota and Celiac Disease: Cause, Consequence or Co-Evolution?Nutrients. 2015 Aug 17;7(8):6900-23. doi: 10.3390/nu7085314. Nutrients. 2015. PMID: 26287240 Free PMC article. Review.
Cited by
-
Assessment of salivary microbiota profile as a potential diagnostic tool for pediatric celiac disease.Sci Rep. 2024 Jul 19;14(1):16712. doi: 10.1038/s41598-024-67677-4. Sci Rep. 2024. PMID: 39030381 Free PMC article.
-
Cerumenogram: a new frontier in cancer diagnosis in humans.Sci Rep. 2019 Aug 13;9(1):11722. doi: 10.1038/s41598-019-48121-4. Sci Rep. 2019. PMID: 31409861 Free PMC article.
-
The microbiome of the oral mucosa in irritable bowel syndrome.Gut Microbes. 2016 Jul 3;7(4):286-301. doi: 10.1080/19490976.2016.1162363. Epub 2016 Mar 10. Gut Microbes. 2016. PMID: 26963804 Free PMC article.
-
Gluten-free diet affects fecal small non-coding RNA profiles and microbiome composition in celiac disease supporting a host-gut microbiota crosstalk.Gut Microbes. 2023 Jan-Dec;15(1):2172955. doi: 10.1080/19490976.2023.2172955. Gut Microbes. 2023. PMID: 36751856 Free PMC article.
-
Salivary Gluten Degradation and Oral Microbial Profiles in Healthy Individuals and Celiac Disease Patients.Appl Environ Microbiol. 2017 Mar 2;83(6):e03330-16. doi: 10.1128/AEM.03330-16. Print 2017 Mar 15. Appl Environ Microbiol. 2017. PMID: 28087531 Free PMC article.
References
-
- Murray JA. 1999. The widening spectrum of celiac disease. Am. J. Clin. Nutr. 69:354–365 - PubMed
-
- Mina SS, Azcurra AI, Dorronsoro S, Brunotto MN. 2008. Alterations of the oral ecosystem in children with celiac disease. Acta Odontol. Latinoam. 21:121–126 http://www.actaodontologicalat.com/archivo/v21n2/fulltext/articulo2.pdf - PubMed
MeSH terms
Substances
Associated data
LinkOut - more resources
Full Text Sources
Other Literature Sources
Medical
Research Materials
