

Brain entropy mapping using fMRI
- PMID: 24657999
- PMCID: PMC3962327
- DOI: 10.1371/journal.pone.0089948
Brain entropy mapping using fMRI
Abstract
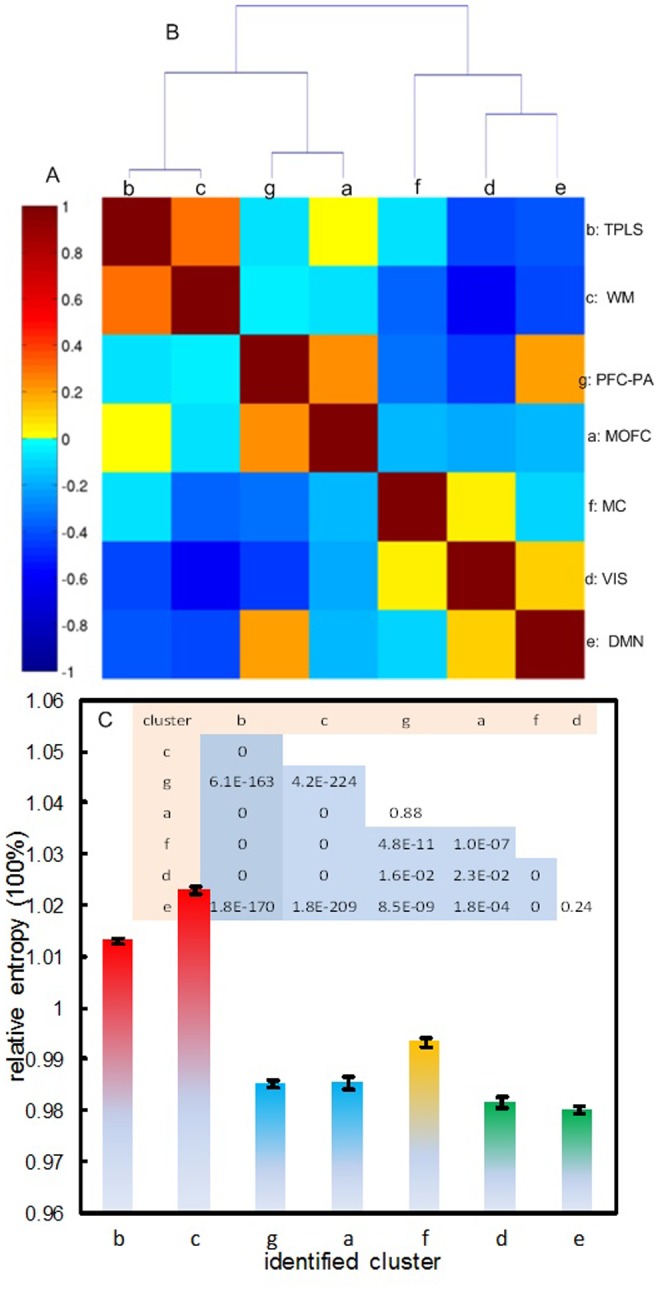
Entropy is an important trait for life as well as the human brain. Characterizing brain entropy (BEN) may provide an informative tool to assess brain states and brain functions. Yet little is known about the distribution and regional organization of BEN in normal brain. The purpose of this study was to examine the whole brain entropy patterns using a large cohort of normal subjects. A series of experiments were first performed to validate an approximate entropy measure regarding its sensitivity, specificity, and reliability using synthetic data and fMRI data. Resting state fMRI data from a large cohort of normal subjects (n = 1049) from multi-sites were then used to derive a 3-dimensional BEN map, showing a sharp low-high entropy contrast between the neocortex and the rest of brain. The spatial heterogeneity of resting BEN was further studied using a data-driven clustering method, and the entire brain was found to be organized into 7 hierarchical regional BEN networks that are consistent with known structural and functional brain parcellations. These findings suggest BEN mapping as a physiologically and functionally meaningful measure for studying brain functions.
Conflict of interest statement
Figures
Similar articles
-
The relationships of resting-state brain entropy (BEN), ovarian hormones and behavioral inhibition and activation systems (BIS/BAS).Neuroimage. 2025 May 15;312:121226. doi: 10.1016/j.neuroimage.2025.121226. Epub 2025 Apr 21. Neuroimage. 2025. PMID: 40262490
-
The neurocognitive correlates of brain entropy estimated by resting state fMRI.Neuroimage. 2021 May 15;232:117893. doi: 10.1016/j.neuroimage.2021.117893. Epub 2021 Feb 20. Neuroimage. 2021. PMID: 33621695 Free PMC article.
-
Associations of Brain Entropy Estimated by Resting State fMRI With Physiological Indices, Body Mass Index, and Cognition.J Magn Reson Imaging. 2024 May;59(5):1697-1707. doi: 10.1002/jmri.28948. Epub 2023 Aug 14. J Magn Reson Imaging. 2024. PMID: 37578314 Free PMC article.
-
Mapping cognitive and emotional networks in neurosurgical patients using resting-state functional magnetic resonance imaging.Neurosurg Focus. 2020 Feb 1;48(2):E9. doi: 10.3171/2019.11.FOCUS19773. Neurosurg Focus. 2020. PMID: 32006946 Free PMC article. Review.
-
Resting state fMRI: A review on methods in resting state connectivity analysis and resting state networks.Neuroradiol J. 2017 Aug;30(4):305-317. doi: 10.1177/1971400917697342. Epub 2017 Mar 29. Neuroradiol J. 2017. PMID: 28353416 Free PMC article. Review.
Cited by
-
Brain entropy and neurotrophic molecular markers accompanying clinical improvement after ketamine: Preliminary evidence in adolescents with treatment-resistant depression.J Psychopharmacol. 2021 Feb;35(2):168-177. doi: 10.1177/0269881120928203. Epub 2020 Jul 9. J Psychopharmacol. 2021. PMID: 32643995 Free PMC article.
-
The Systematic Bias of Entropy Calculation in the Multi-Scale Entropy Algorithm.Entropy (Basel). 2021 May 24;23(6):659. doi: 10.3390/e23060659. Entropy (Basel). 2021. PMID: 34074036 Free PMC article.
-
Interactions of BDNF Val66Met Polymorphism and Menstrual Pain on Brain Complexity.Front Neurosci. 2018 Nov 20;12:826. doi: 10.3389/fnins.2018.00826. eCollection 2018. Front Neurosci. 2018. PMID: 30524221 Free PMC article.
-
Disrupted Brain Entropy And Functional Connectivity Patterns Of Thalamic Subregions In Major Depressive Disorder.Neuropsychiatr Dis Treat. 2019 Sep 11;15:2629-2638. doi: 10.2147/NDT.S220743. eCollection 2019. Neuropsychiatr Dis Treat. 2019. PMID: 31571880 Free PMC article.
-
Characterizing Rapid Fluctuations of Resting State Functional Connectivity in Demyelinating, Neurodegenerative, and Psychiatric Conditions: From Static to Time-Varying Analysis.Front Neurosci. 2019 Jul 10;13:618. doi: 10.3389/fnins.2019.00618. eCollection 2019. Front Neurosci. 2019. PMID: 31354402 Free PMC article. Review.
References
-
- Sandler SI (2006) Chemical and Engineering Thermodynamics. New York: Wiely.
-
- Schrödinger E (1944) What is Life - the Physical Aspect of the Living Cell. Cambridge: Cambridge University Press.
-
- Singer W (2009) The Brain, a Complex Self-organizing System. European Review 17: 321–329.
-
- Bergstrom RM (1969) An entropy model of the developing brain. Developmental psychobiology 2: 139–152. - PubMed
-
- Pinker S (1997) How the Mind Works. New York: W. W. Norton.
Publication types
MeSH terms
Grants and funding
LinkOut - more resources
Full Text Sources
Other Literature Sources
