. 2014 Apr;20(4):398-407.
doi: 10.1038/nm.3468. Epub 2014 Mar 23.

An activin receptor IIA ligand trap corrects ineffective erythropoiesis in β-thalassemia

Affiliations

An activin receptor IIA ligand trap corrects ineffective erythropoiesis in β-thalassemia

Michael Dussiot et al. Nat Med. 2014 Apr.

Abstract

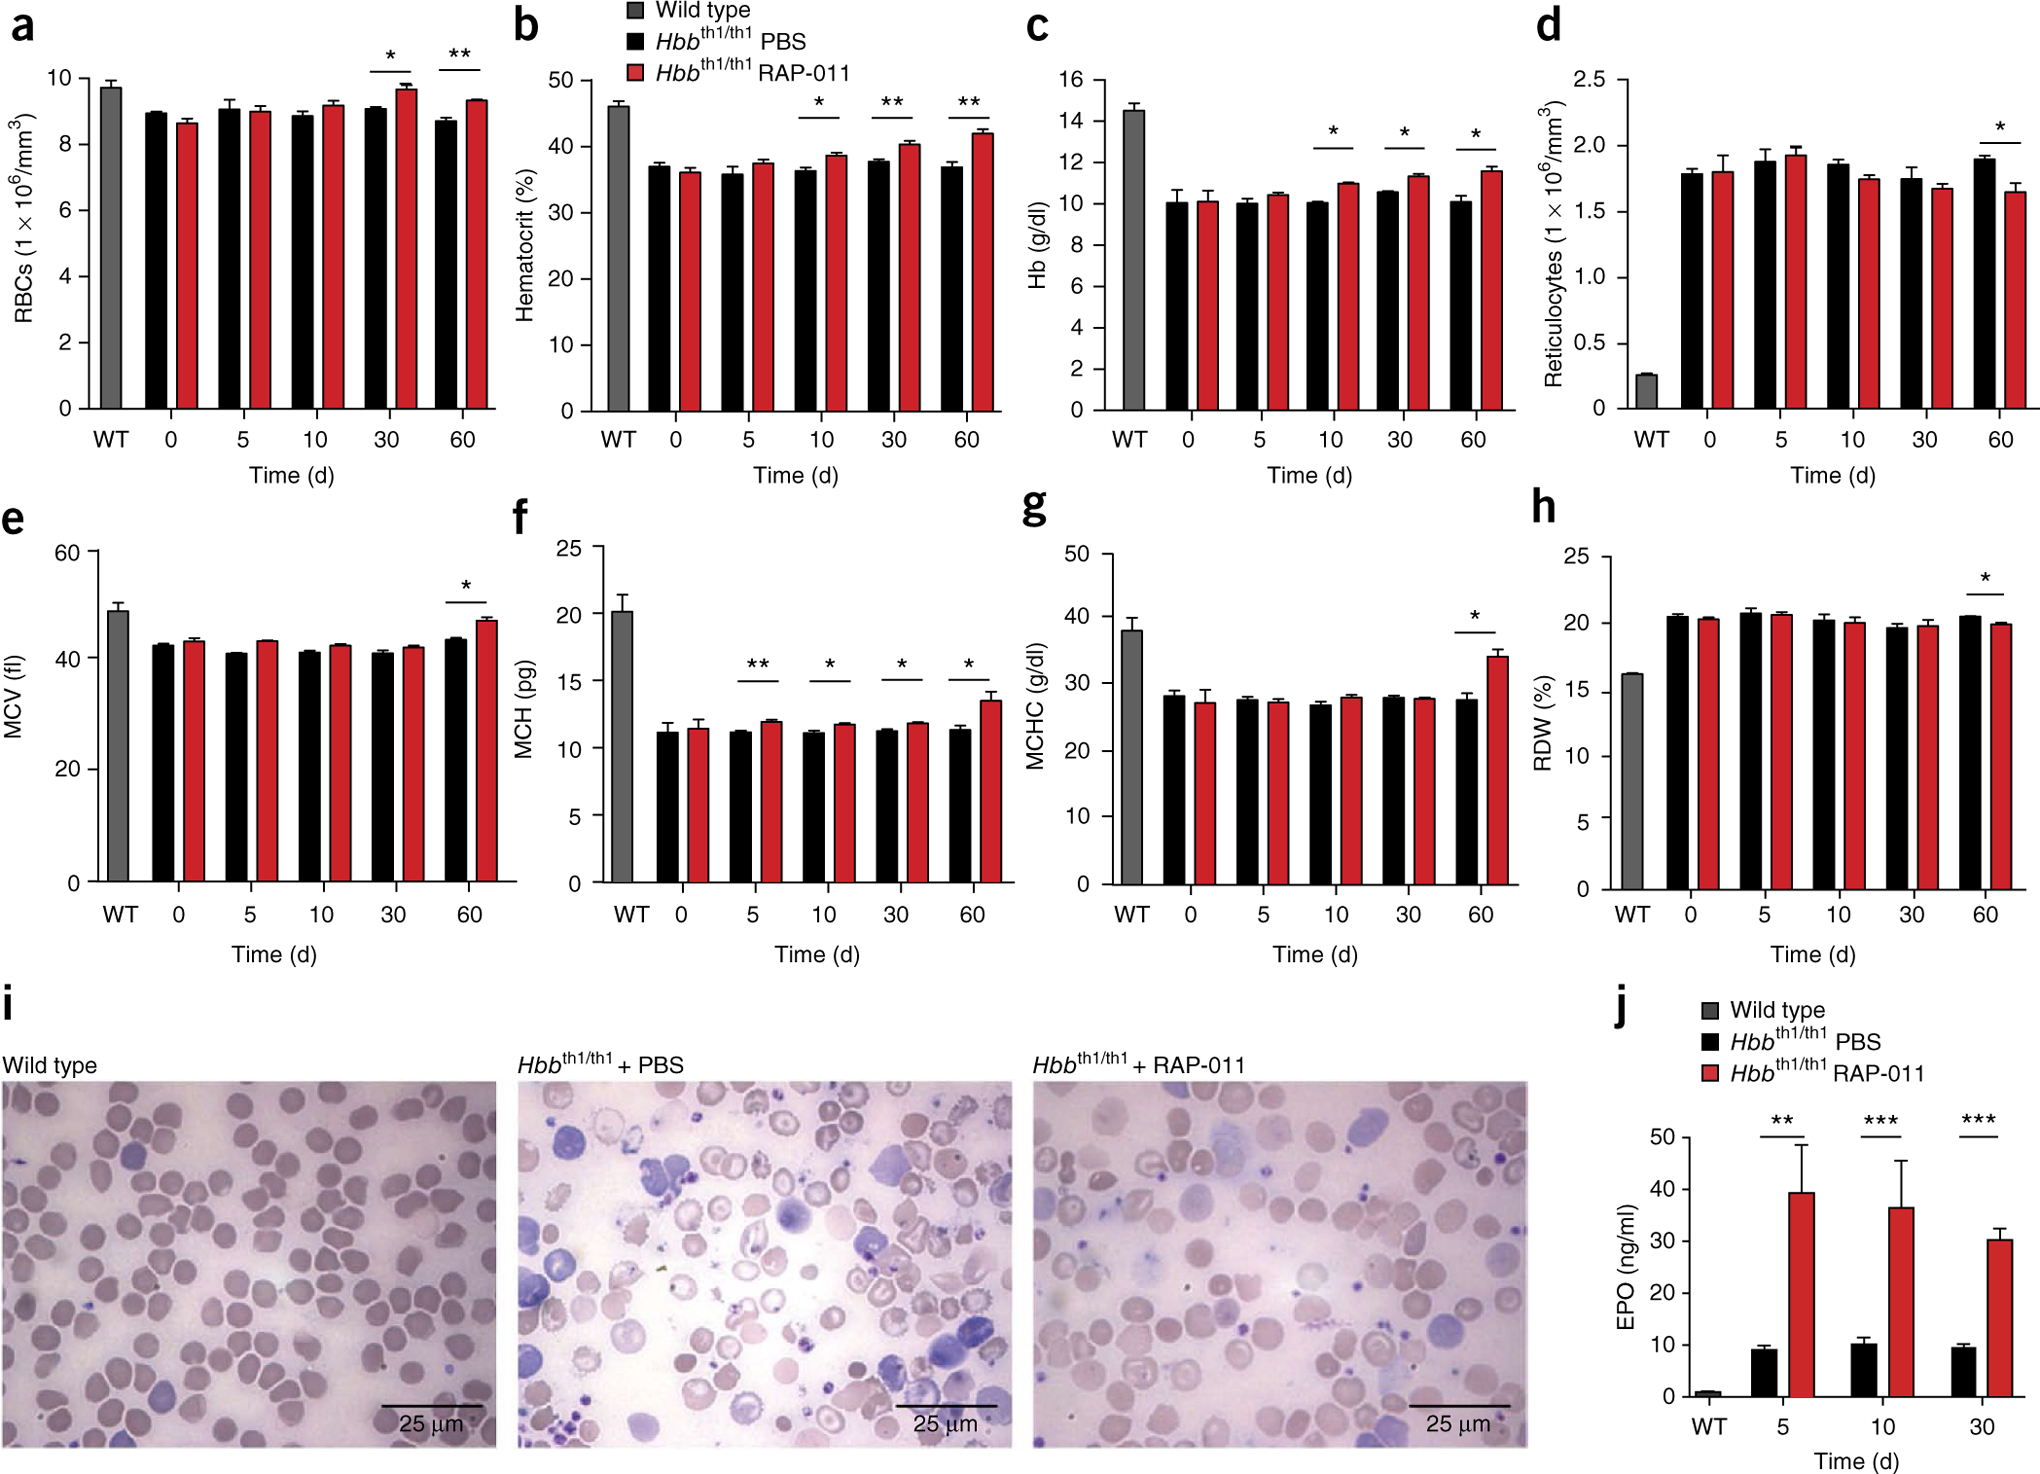
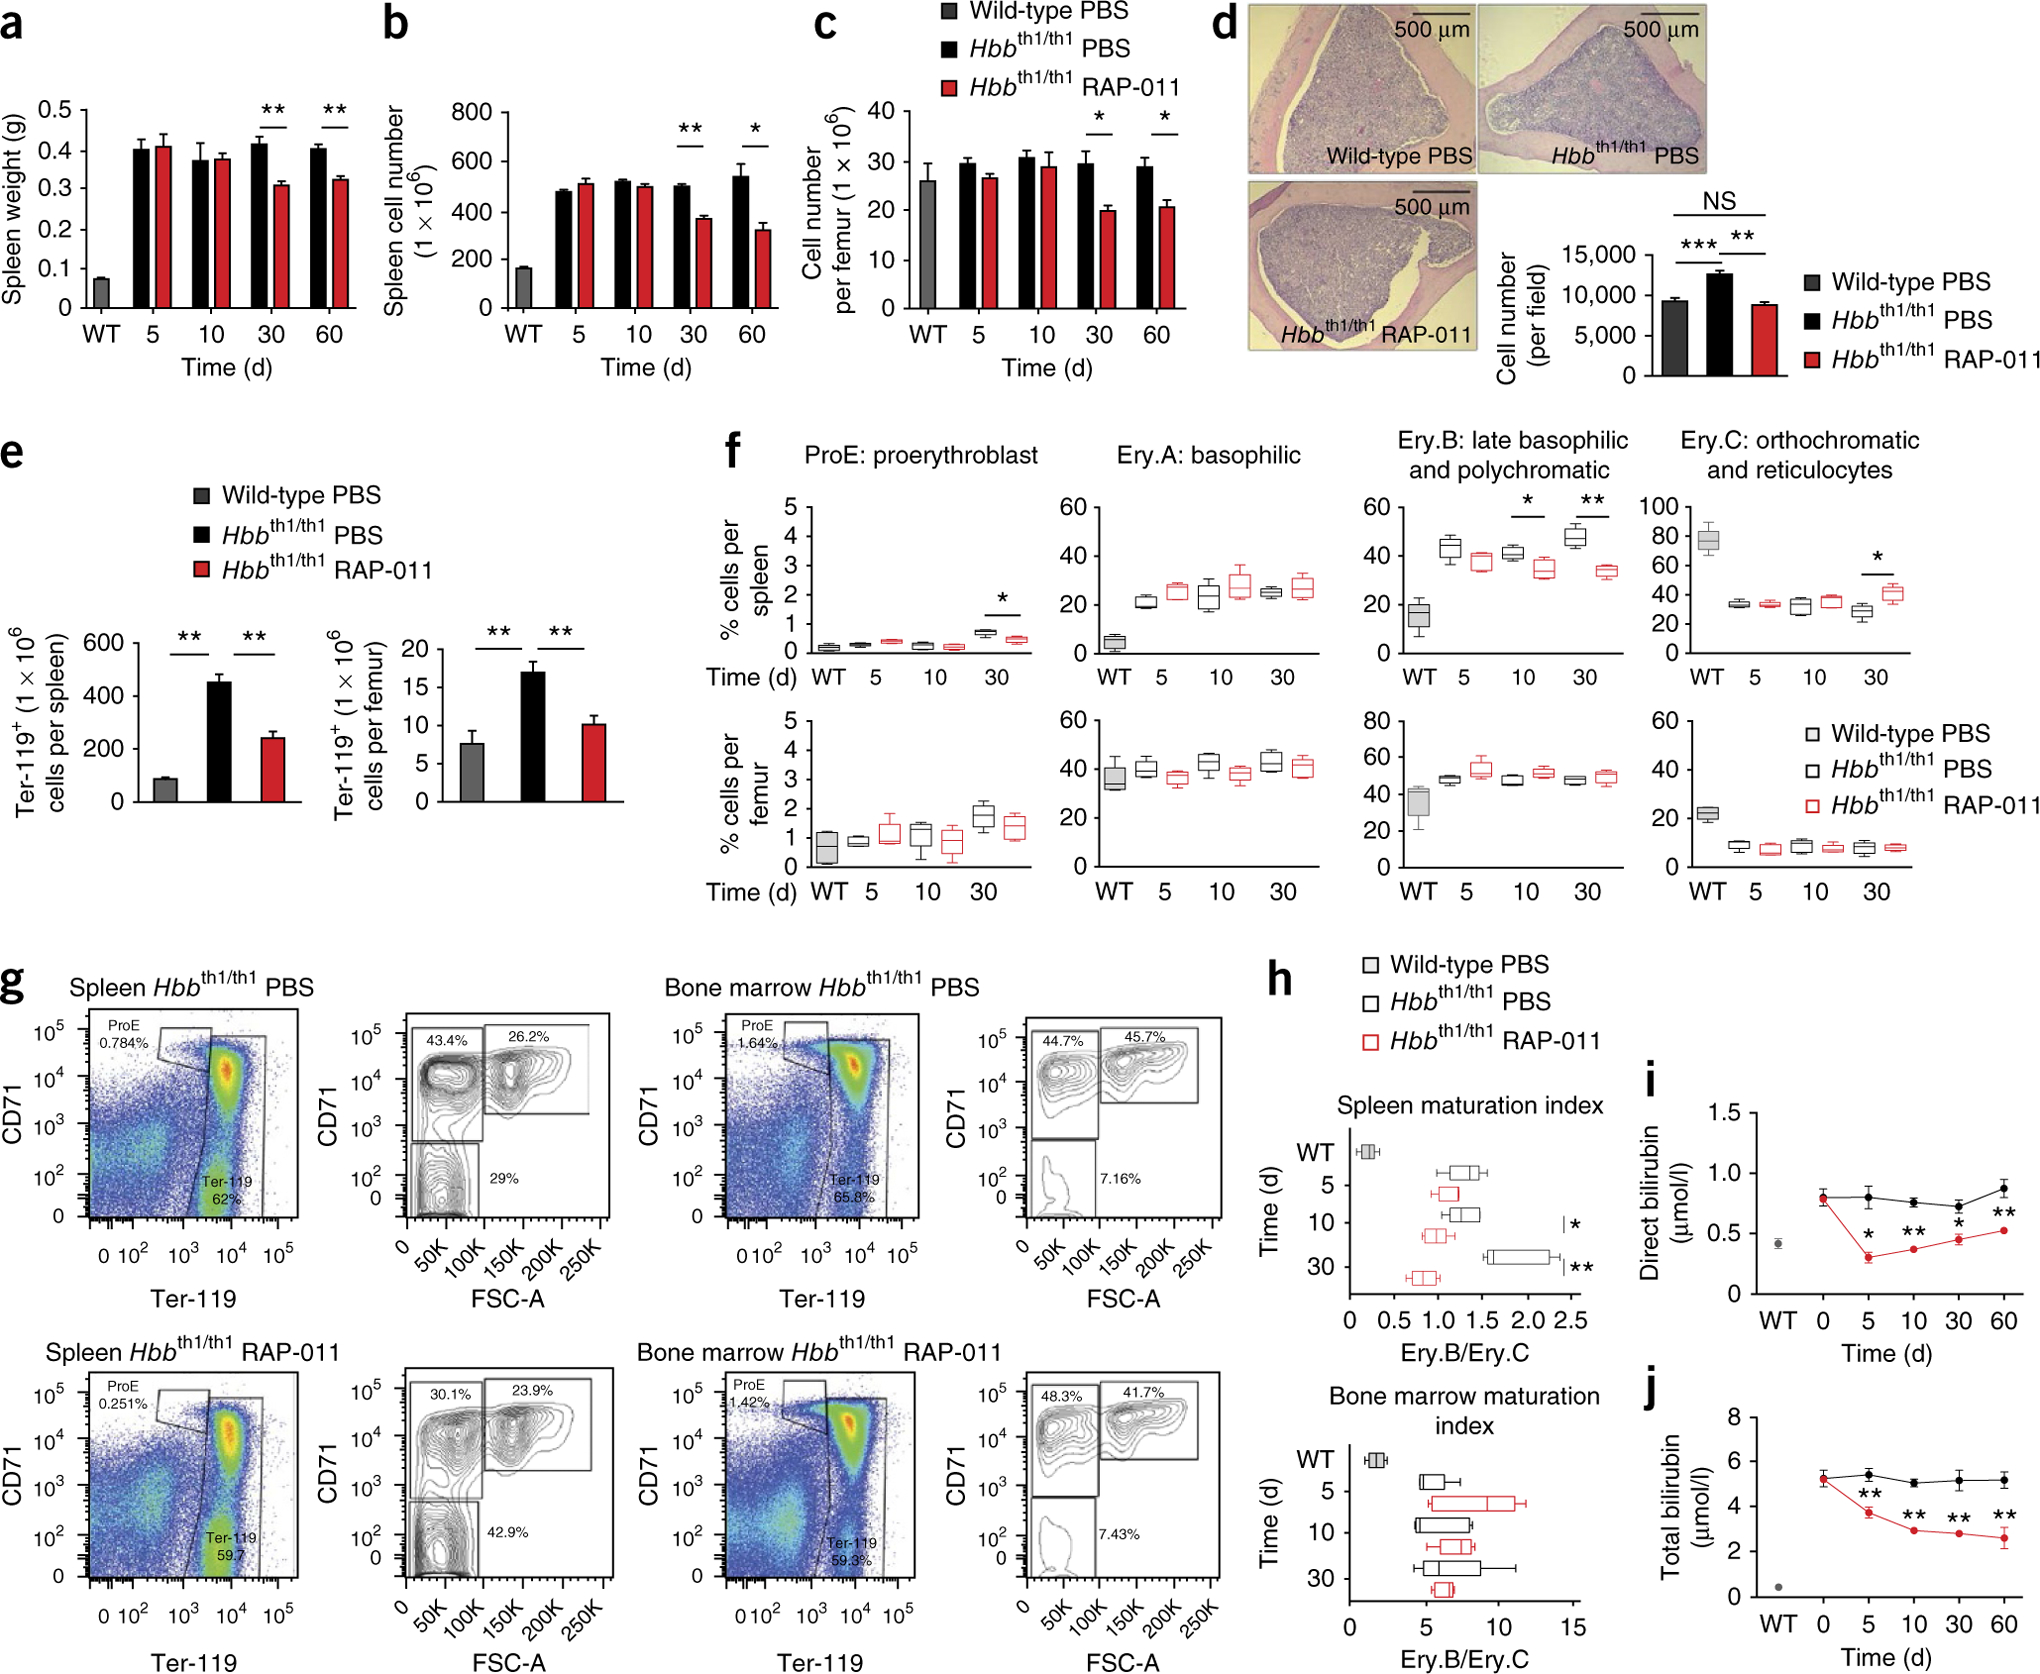
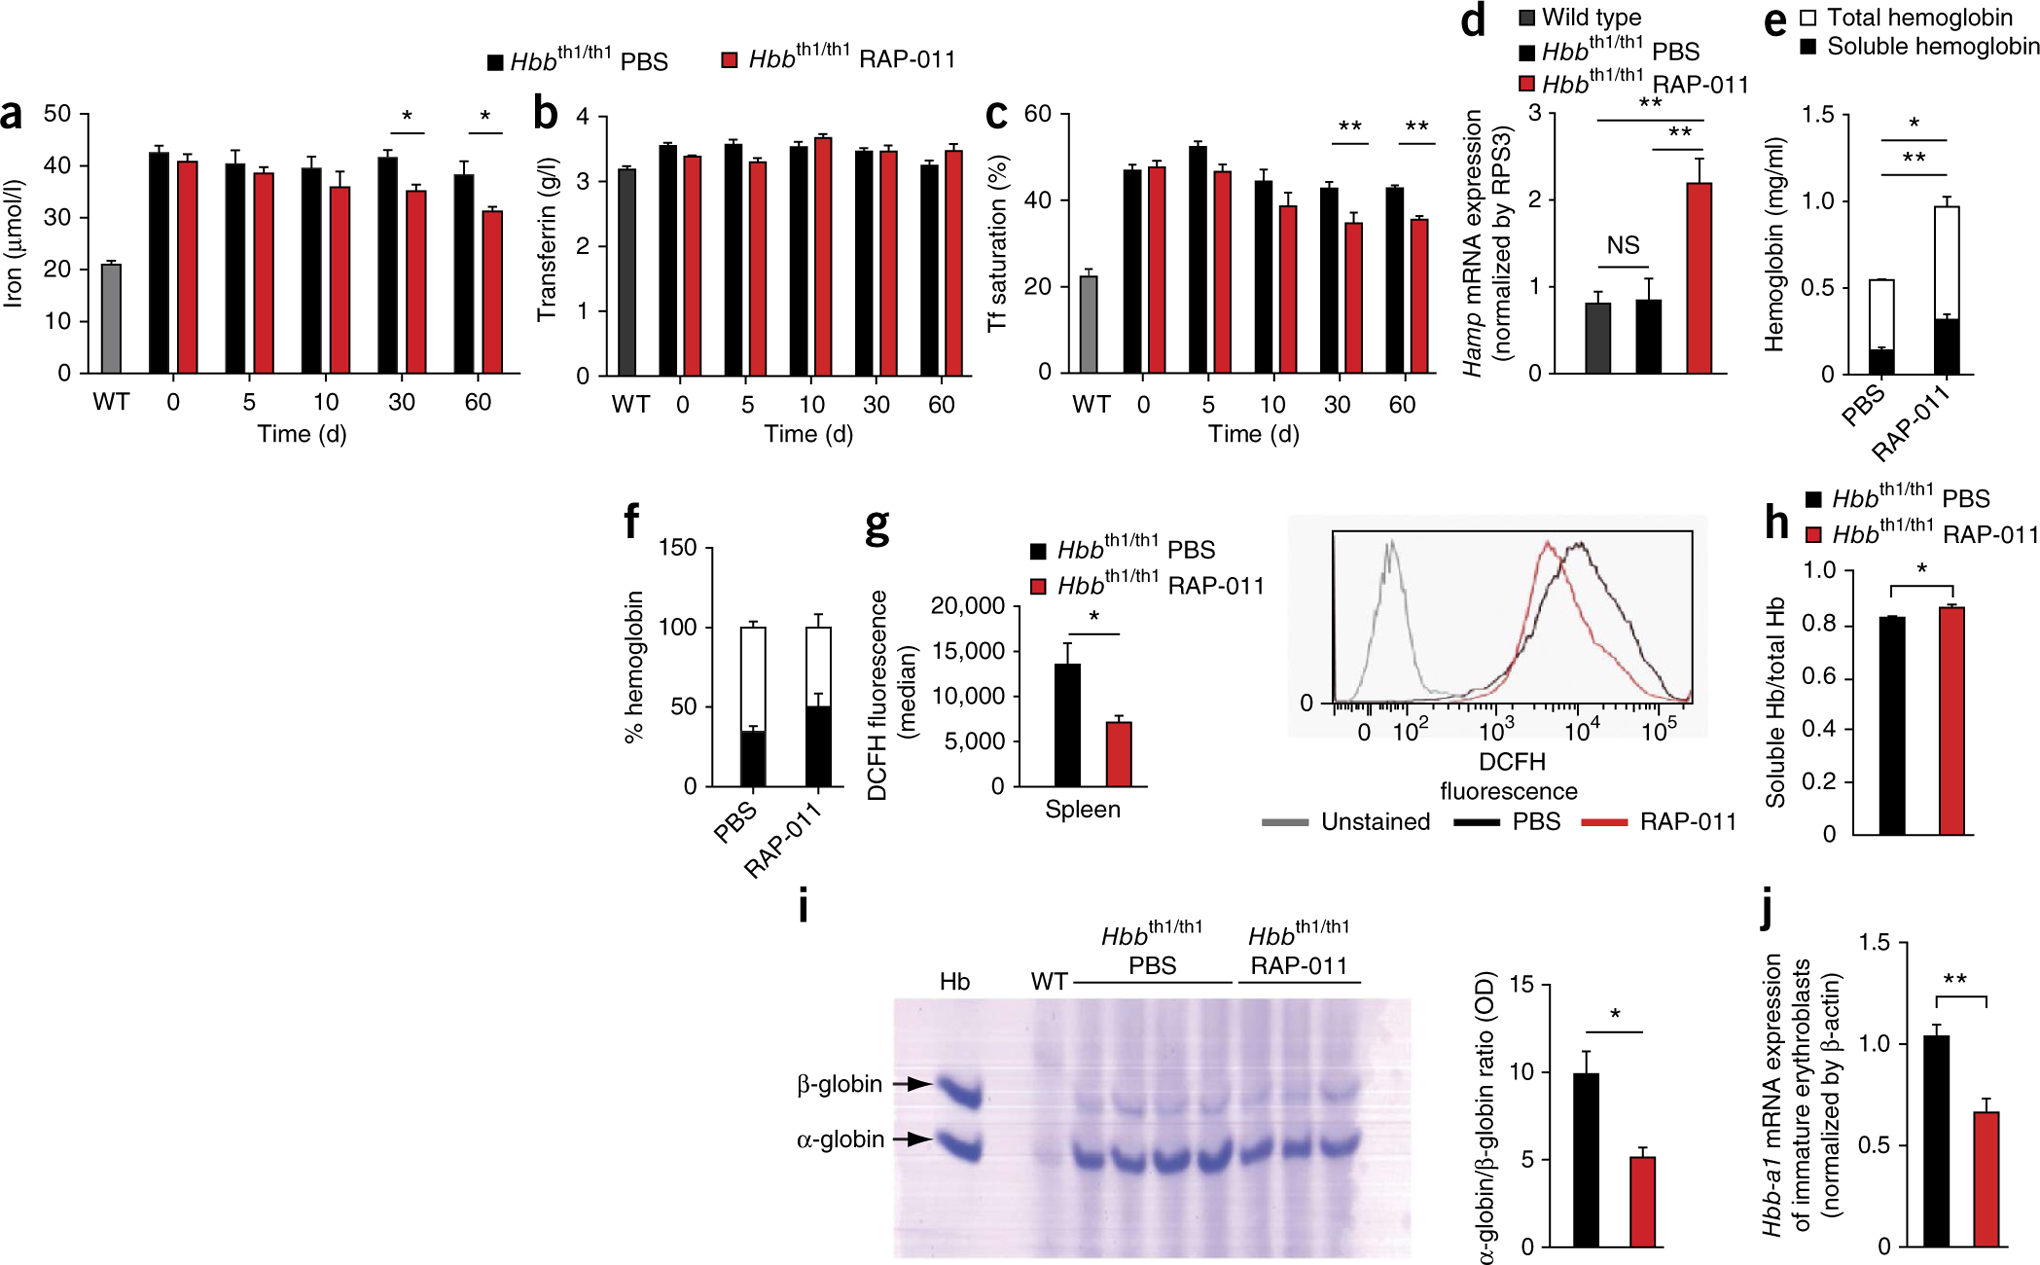
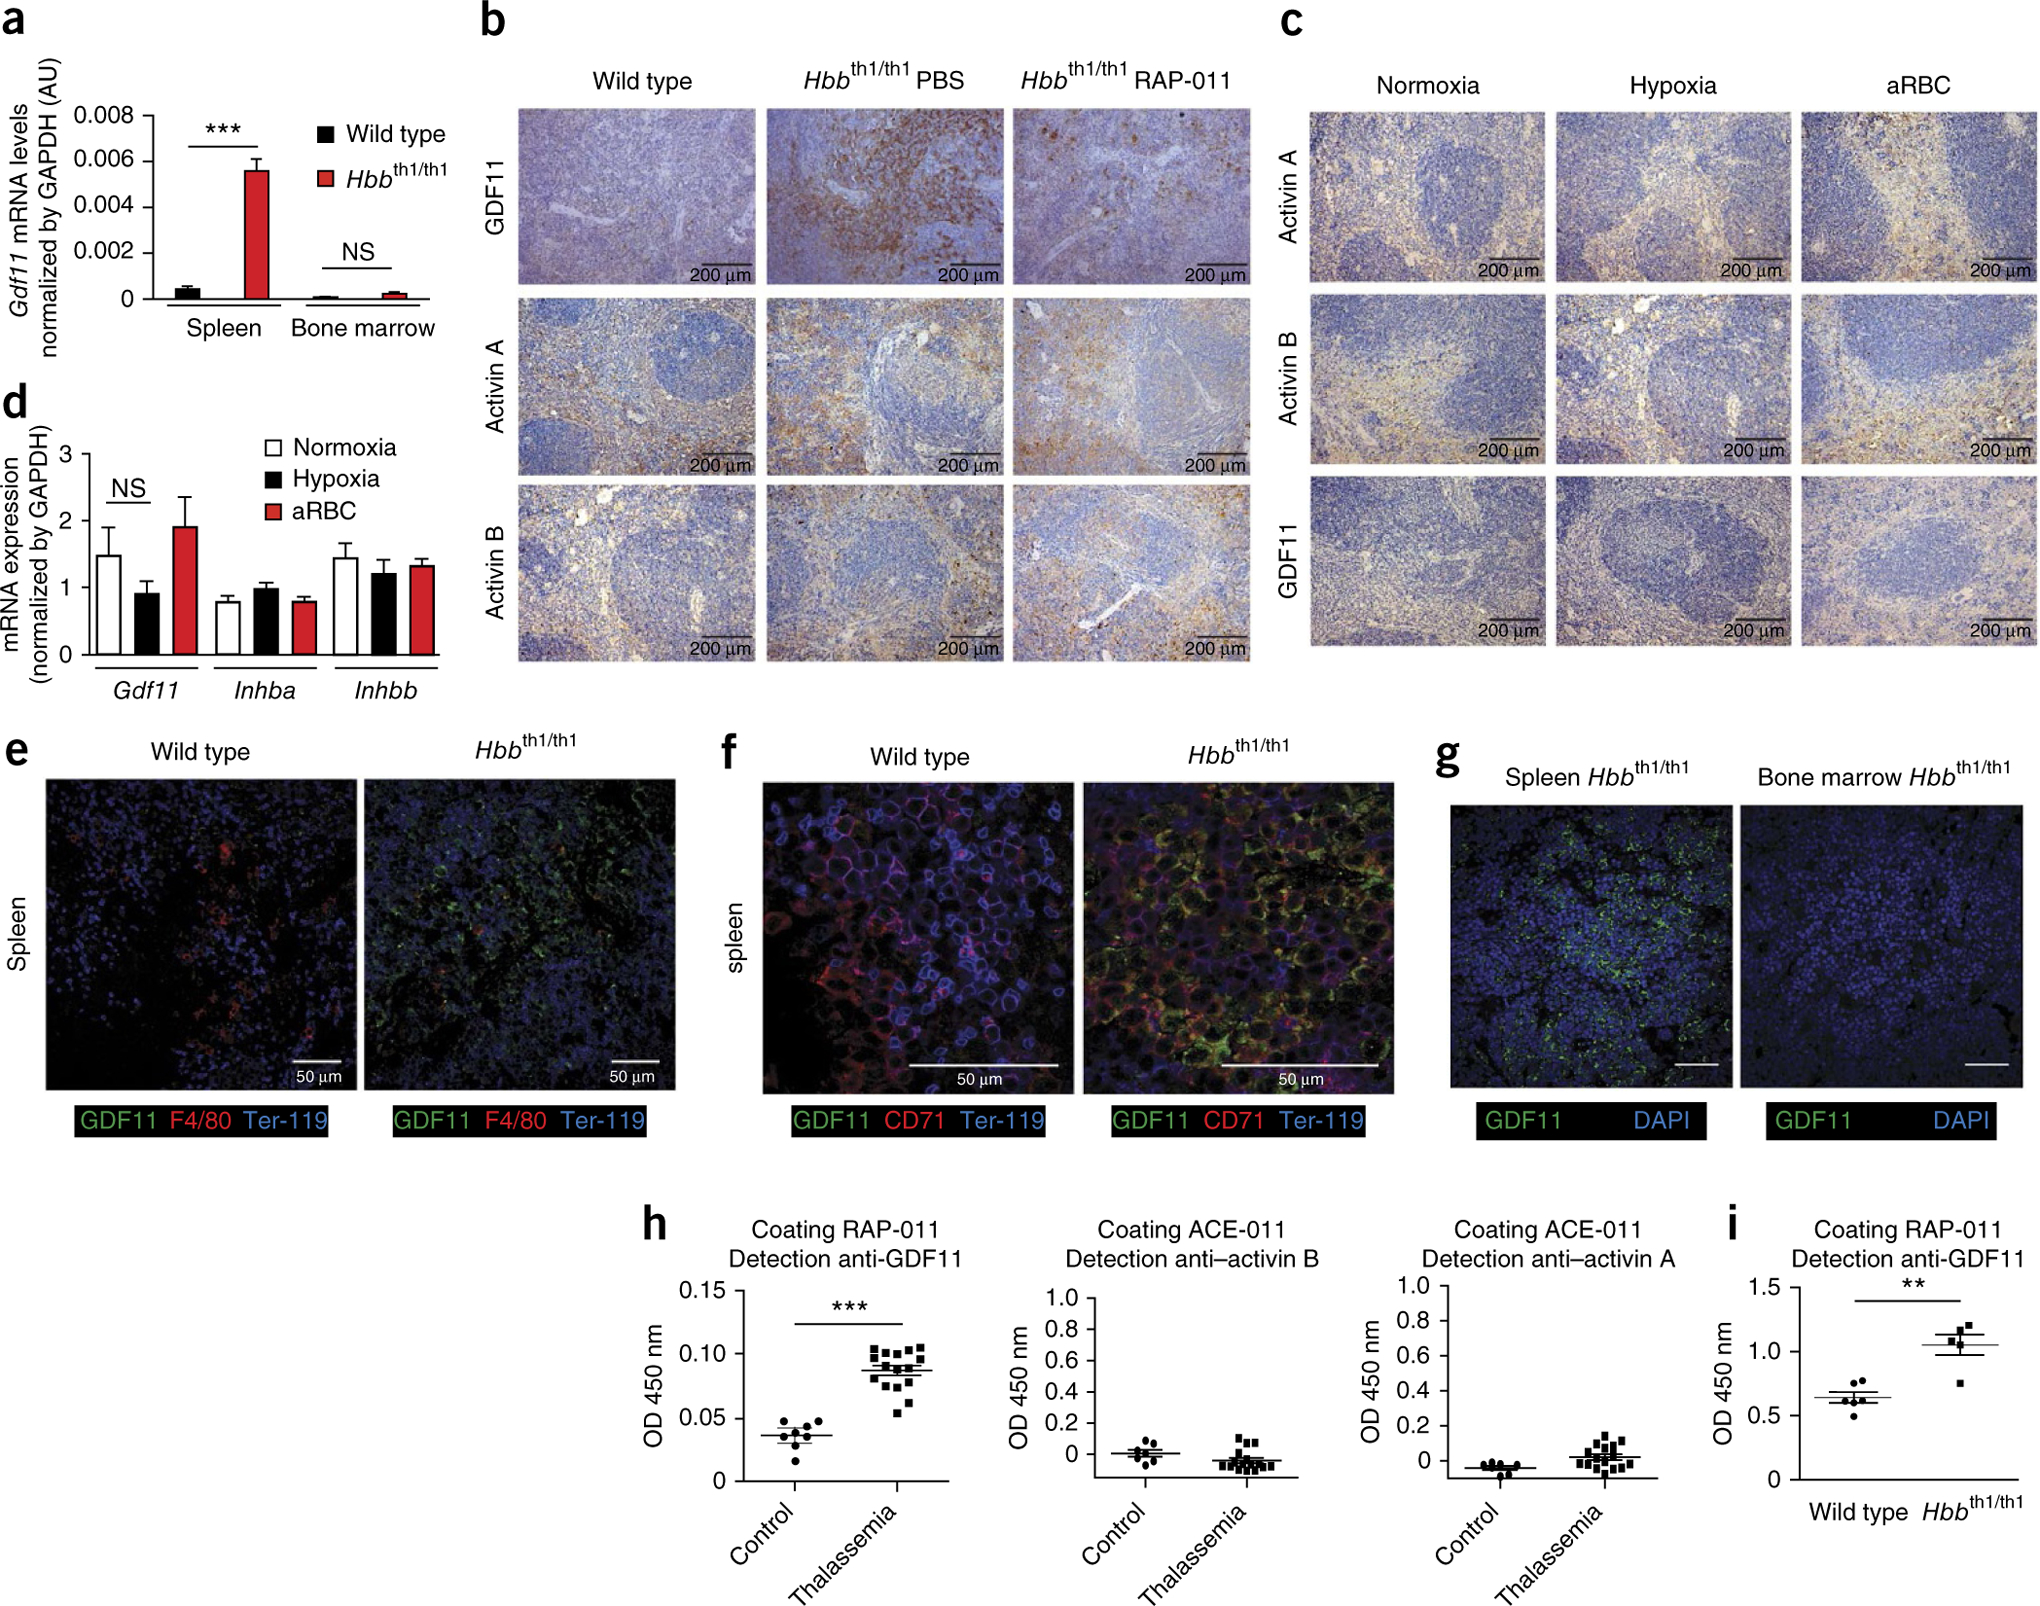
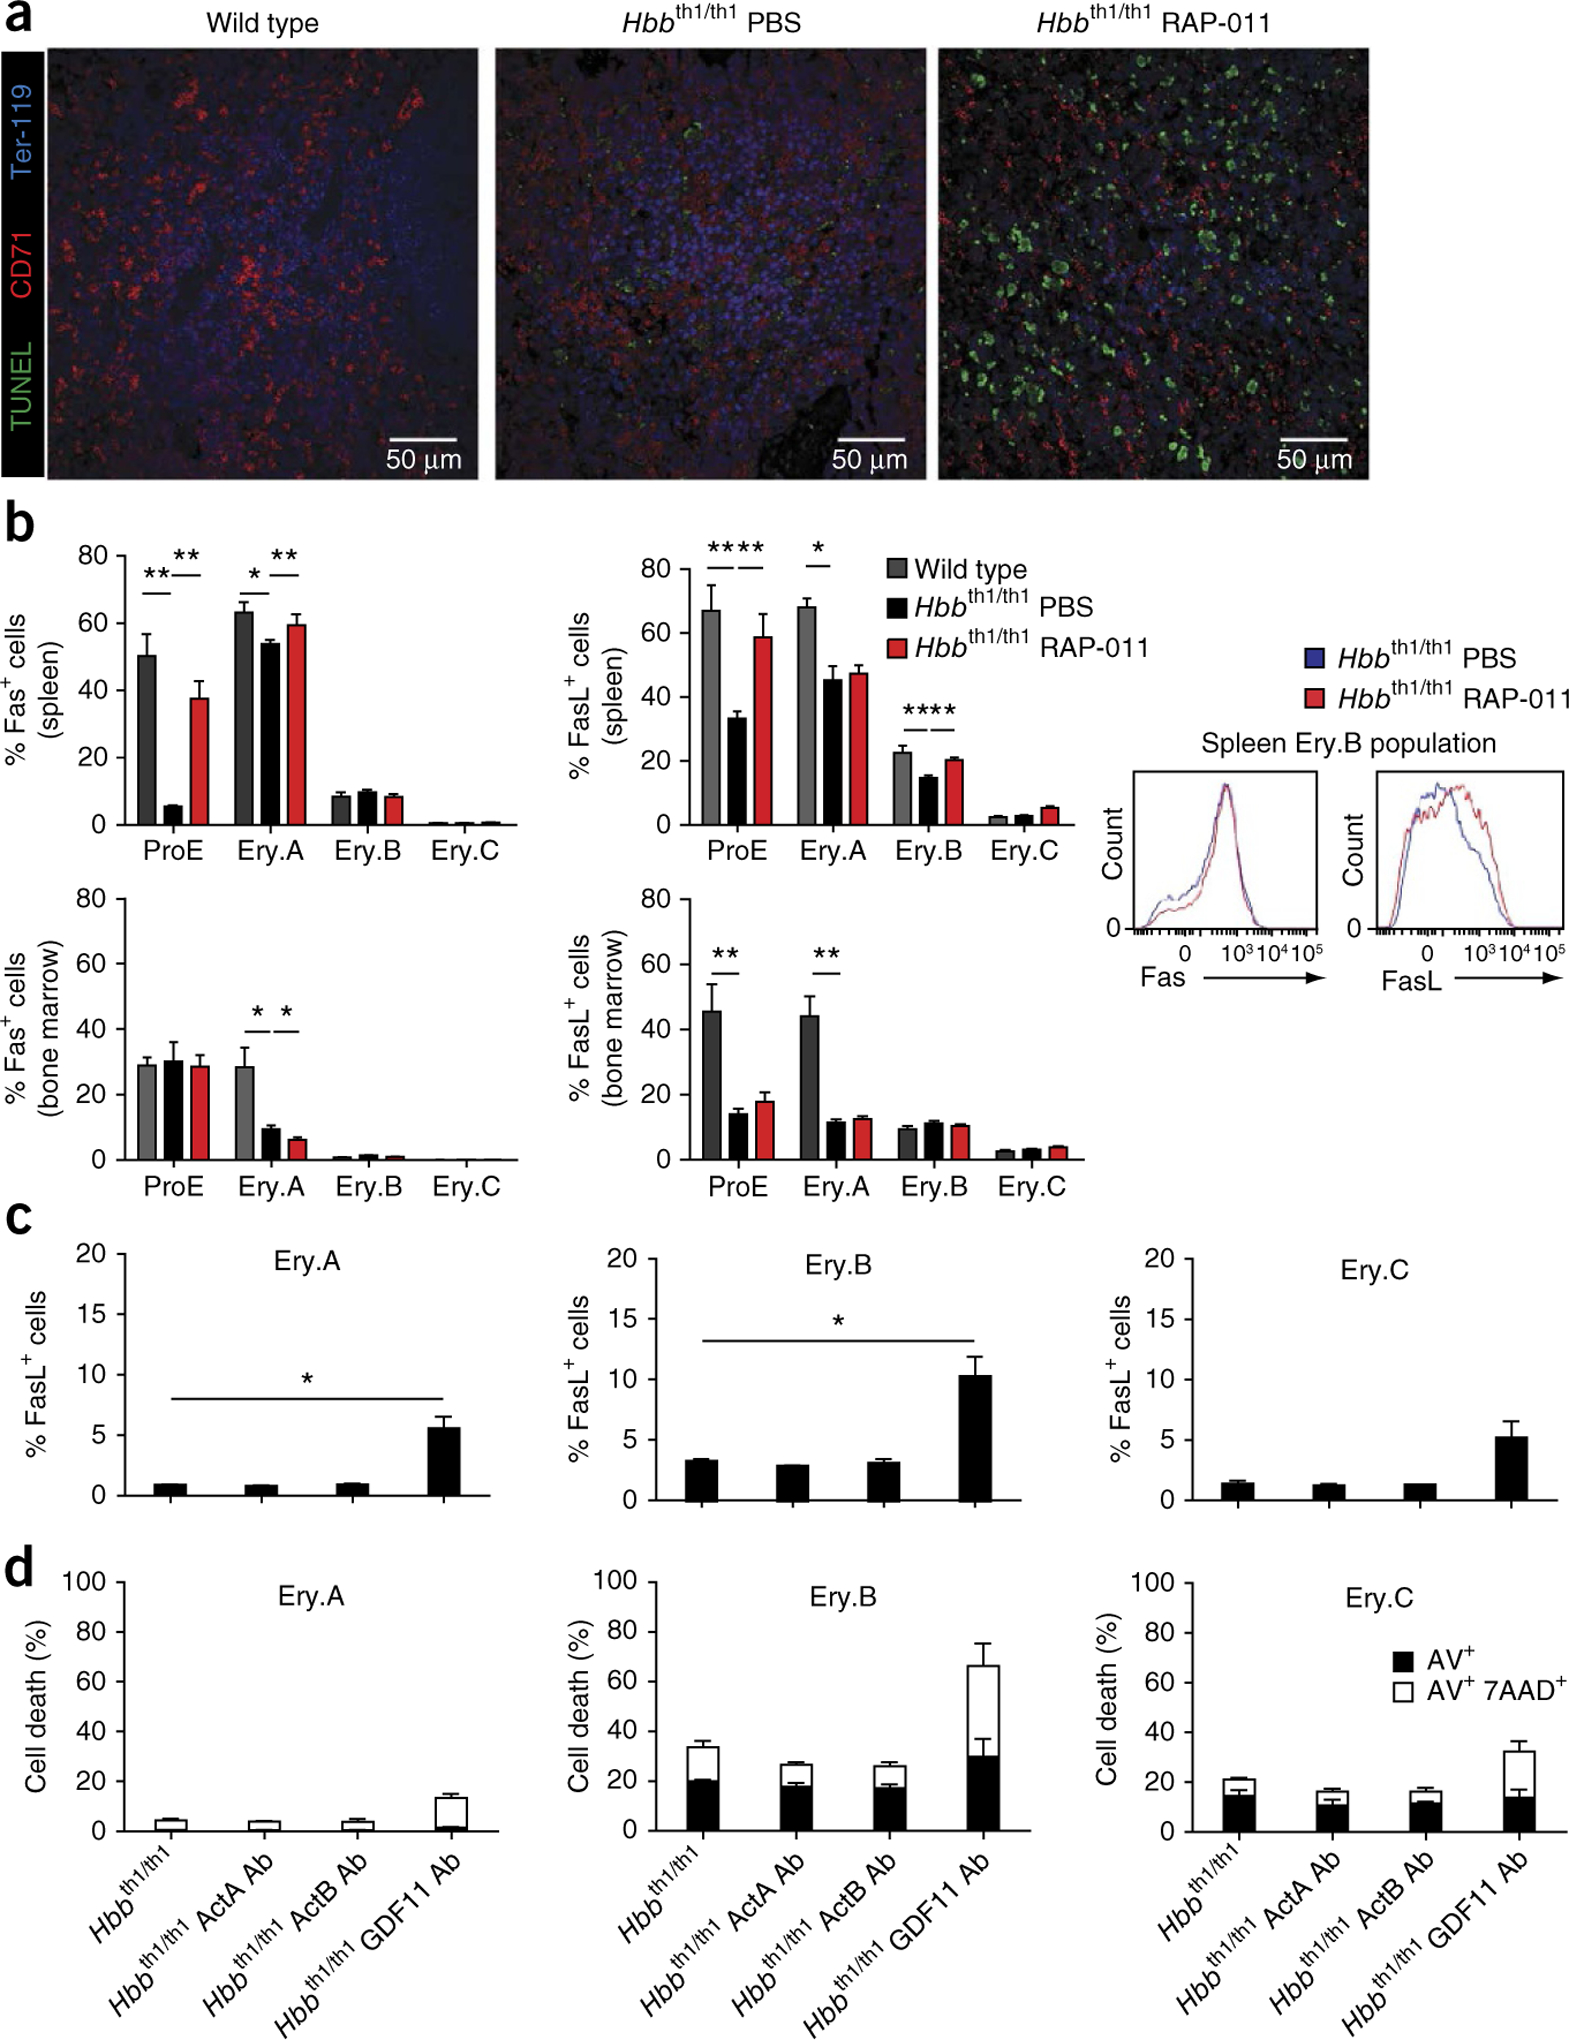
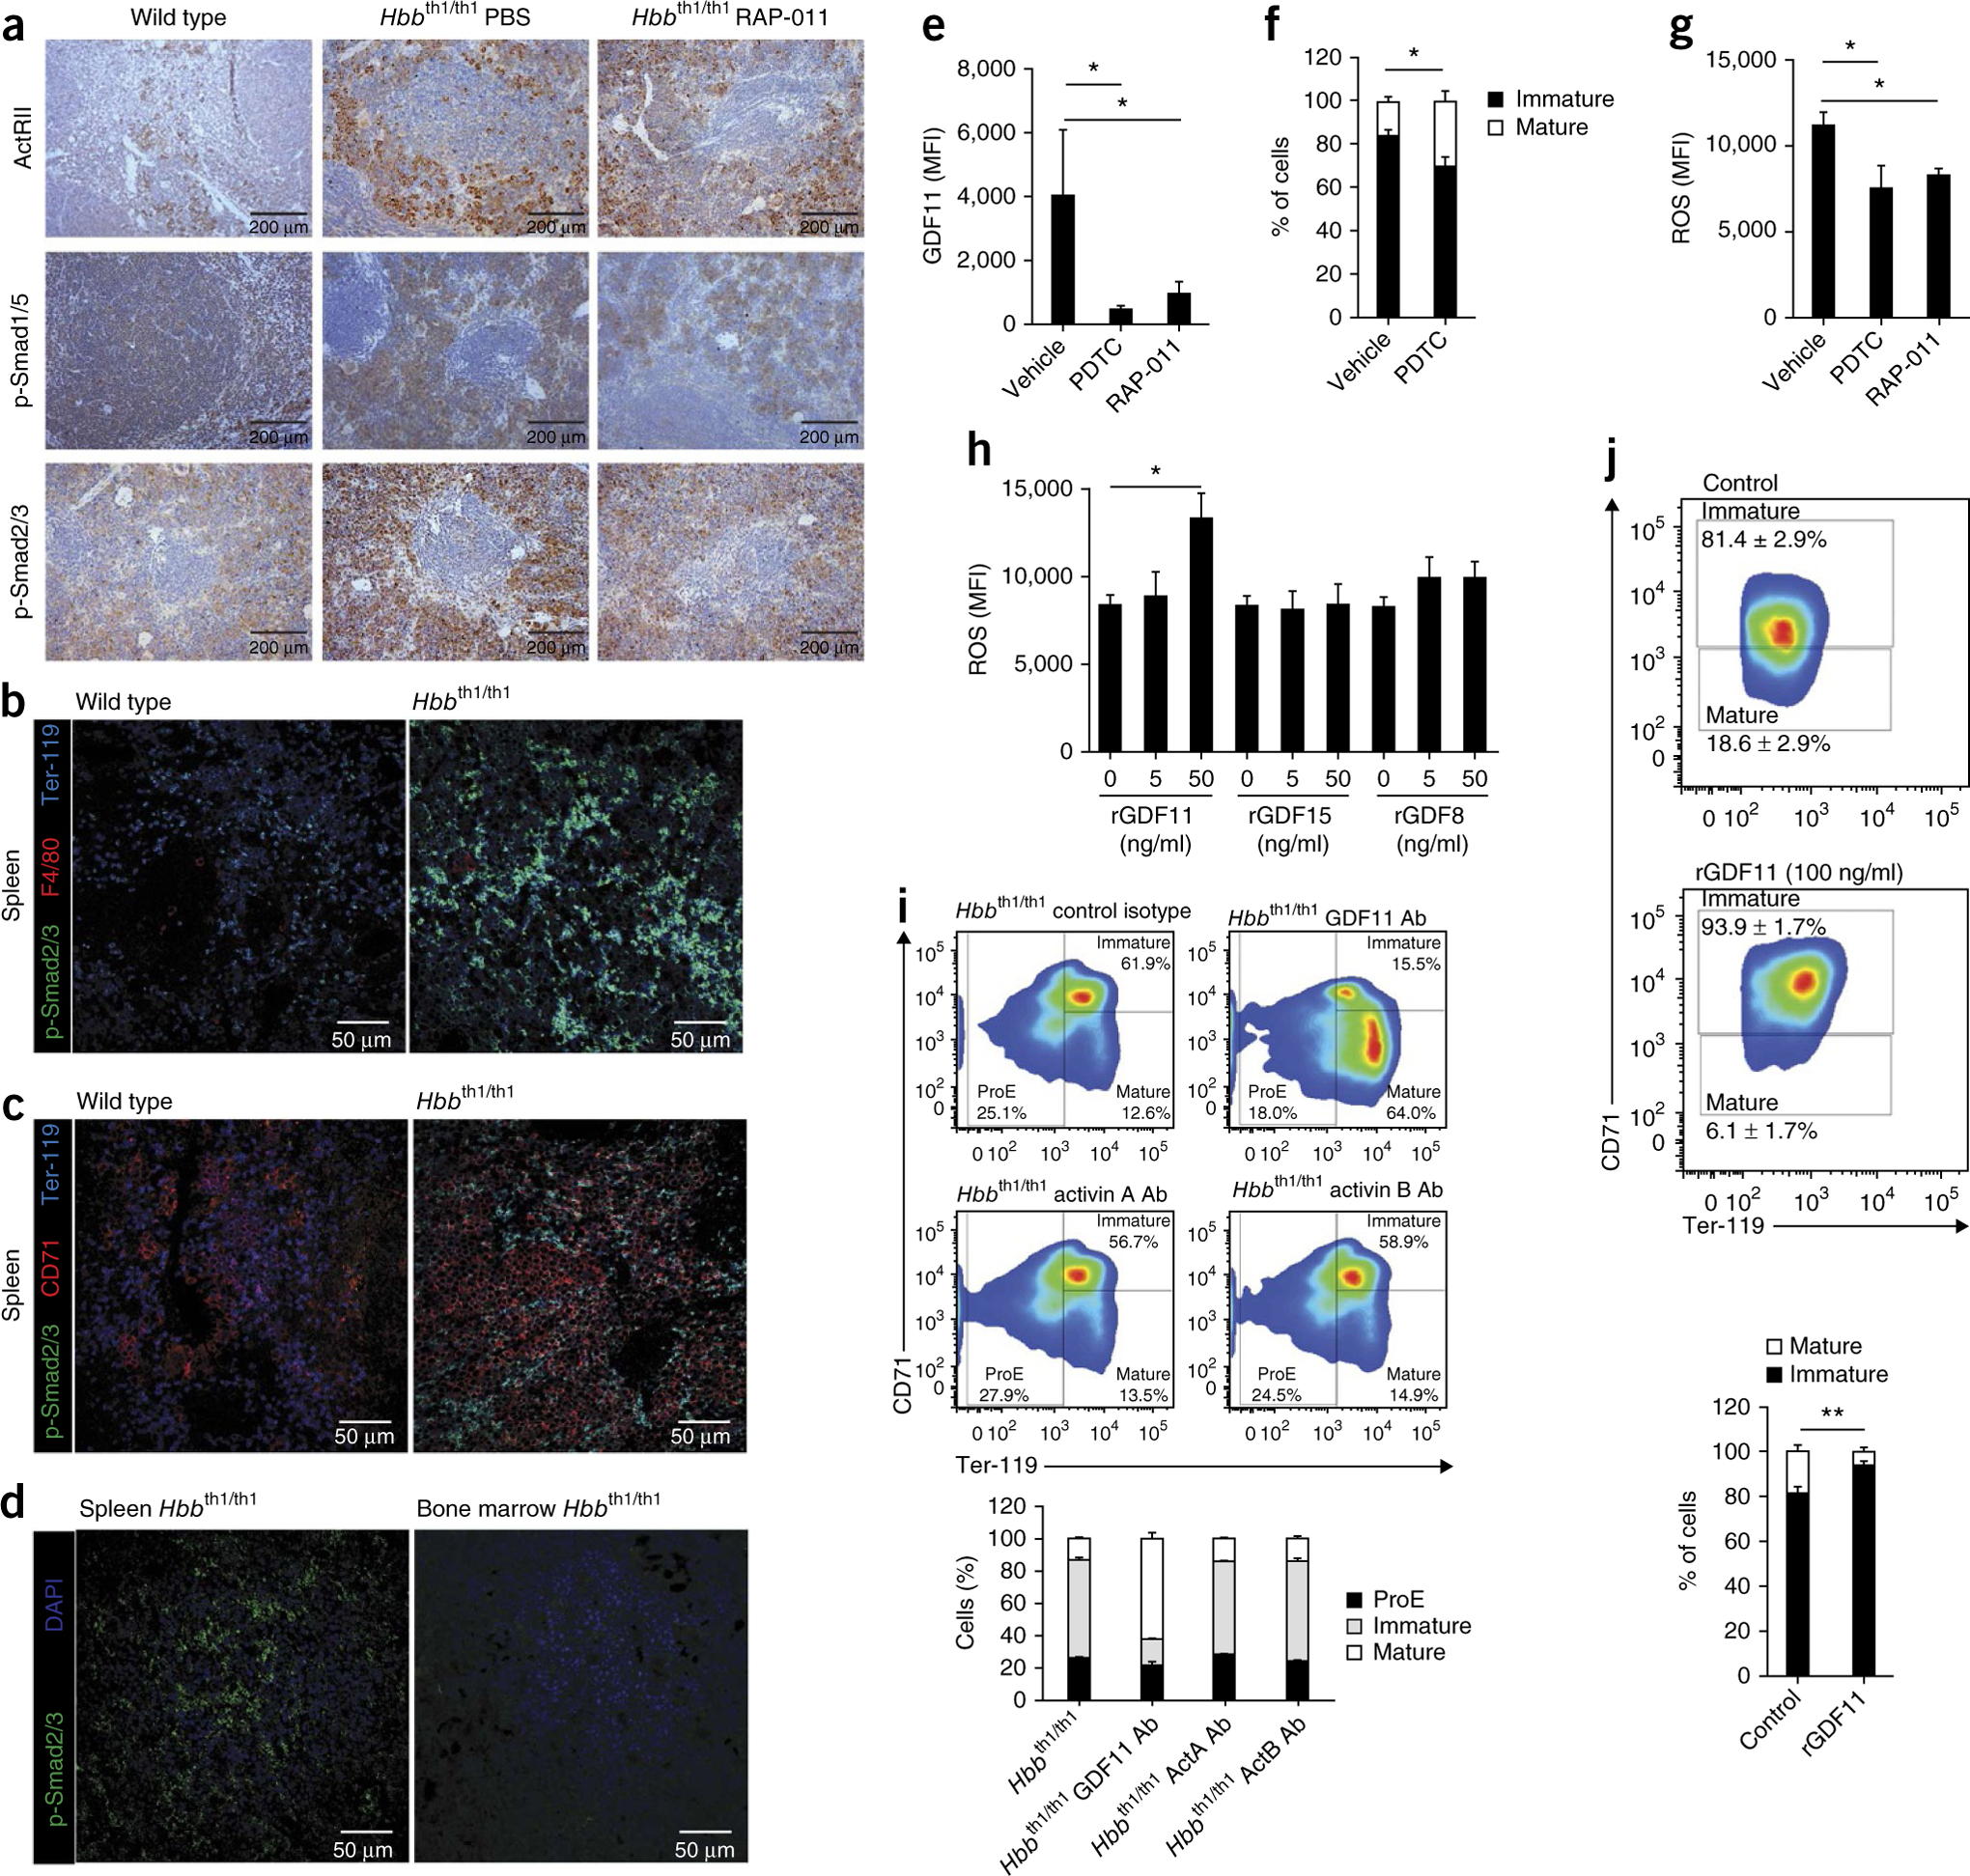
The pathophysiology of ineffective erythropoiesis in β-thalassemia is poorly understood. We report that RAP-011, an activin receptor IIA (ActRIIA) ligand trap, improved ineffective erythropoiesis, corrected anemia and limited iron overload in a mouse model of β-thalassemia intermedia. Expression of growth differentiation factor 11 (GDF11), an ActRIIA ligand, was increased in splenic erythroblasts from thalassemic mice and in erythroblasts and sera from subjects with β-thalassemia. Inactivation of GDF11 decreased oxidative stress and the amount of α-globin membrane precipitates, resulting in increased terminal erythroid differentiation. Abnormal GDF11 expression was dependent on reactive oxygen species, suggesting the existence of an autocrine amplification loop in β-thalassemia. GDF11 inactivation also corrected the abnormal ratio of immature/mature erythroblasts by inducing apoptosis of immature erythroblasts through the Fas-Fas ligand pathway. Taken together, these observations suggest that ActRIIA ligand traps may have therapeutic relevance in β-thalassemia by suppressing the deleterious effects of GDF11, a cytokine which blocks terminal erythroid maturation through an autocrine amplification loop involving oxidative stress and α-globin precipitation.


Conflict of interest statement

COMPETING FINANCIAL INTERESTS

The authors declare competing financial interests: details are available in the online version of the paper.

Figures

Figure 1
Figure 1
RAP-011 treatment improves hematological parameters in thalassemic mice. (ah) Red blood cell counts (a), hematocrit (b), hemoglobin (Hb) levels (c), reticulocyte counts (d), mean corpuscular volume (MCV) (e), MCH levels (f), MCH concentration (MCHC) (g) and red cell distribution width (RDW) (h) in wild-type (WT) and thalassemic mice treated for 0, 5, 10, 30 or 60 d with RAP-011 (10 mg per kg body weight twice weekly subcutaneously) or with PBS. (i) Morphology of RBCs in peripheral blood smears following 30 d of RAP-011 or PBS treatment. (j) Erythropoietin (EPO) levels measured by ELISA from serum of thalassemic mice treated for 5, 10 or 30 d with RAP-011 or PBS. All data are expressed as the mean ± s.e.m. *P < 0.05, **P < 0.01, ***P < 0.005; n = 5 mice per group for one out of three independent experiments.
Figure 2
Figure 2
RAP-011 treatment reduces ineffective erythropoiesis in thalassemic mice. (ac) Spleen weight (a), total spleen cell number (b) and bone marrow cellularity (c) of thalassemic mice treated for 5, 10, 30 or 60 d with RAP-011 or PBS. (d) Bone marrow erythroblast number and distribution observed in H&E-stained cross-sections of bones of RAP-011–treated or PBS-treated thalassemic mice (60 d of treatment). (e) Bone marrow and spleen erythroblast number in RAP-011– or PBS-treated mice (30 d of treatment). (f) Erythroblast differentiation in bone marrow and spleen harvested 5–30 d after treatment with RAP-011 and evaluated by CD71 and Ter-119 staining and forward scatter (FSC) distribution. The percentage of different erythroblast populations is shown. Box-and-whisker plots show means and maximal and minimal values. (g) Representative flow cytometry analysis of spleen and bone marrow erythroblast subset distribution in RAP-011– and PBS-treated thalassemic mice (30 d of treatment). FSC-A, forward scatter area. (h) An index of ineffective erythropoiesis established by calculating the ratio of Ery.B and Ery.C percentage populations. Box-and-whisker plots show means and maximal and minimal values. (i,j). Biochemical analysis of parameters of ineffective erythropoiesis in sera of thalassemic mice treated for up to 60 d with RAP-011 or PBS: direct bilirubin (i) and total bilirubin (j). All data are expressed as the mean ± s.e.m. *P < 0.05, **P < 0.01, ***P < 0.005; n = 5 mice per group for one out of three independent experiments.
Figure 3
Figure 3
RAP-011 treatment decreases iron overload and RBC-associated hemoglobin precipitates in thalassemic mice. (ac) Biochemical analysis of serum iron parameters in wild-type and thalassemic mice. Systemic iron levels (a), transferrin levels (b) and transferrin (Tf) saturation (c) in mice treated for 0, 5, 10, 30 or 60 d with RAP-011 or PBS. n = 5 mice per group. (d) Hepcidin (Hamp) mRNA levels measured by quantitative PCR (qPCR) from liver samples of wild-type or thalassemic mice treated with PBS or RAP-011. NS, not significant. n = 5 mice per group. (ei) Effects of RAP-011 on globin chain expression and membrane α-globin precipitation. Total hemoglobin (e) and soluble hemoglobin (f) levels in primary thalassemic erythroblasts treated for 48 h with 10 μg/ml RAP-011 or PBS, as assayed by Drabkin’s method. n = 3 mice per group. (g) Left, ROS generation evaluated by flow cytometry using dichlorodihydrofluorescein (DCFH) in primary erythroblasts treated with RAP-011 or PBS for 48 h. Right, a representative FACS histogram for DCFH fluorescence. Gray line indicates unstained control cells, and black and red lines represent PBS- and RAP-011–treated erythroblasts, respectively. n = 6 mice per group. (h) Determination of total and soluble hemoglobin by Drabkin’s method in blood hemolysates from thalassemic mice treated with PBS or RAP-011 for 30 d (4 out of 5 animals for each group). (i) Left, triton–acetic acid–urea (TAU) gel electrophoresis of blood collected from wild-type and thalassemic mice treated with PBS (4 out of 5 animals) or RAP-011 (3 out of 5 animals) for 30 d, as indicated. Arrows indicate α-globin and β-globin staining from RBC membranes. Right, quantification of the optical density (OD) of the gel bands, expressed as the α-globin to β-globin ratio to hemoglobin (total lysate). (j) Expression of Hbb-a1 adult globin mRNA evaluated by qPCR, in purified immature (CD71+) erythroblasts from wild-type and thalassemic mice treated with PBS or RAP-011 for 30 d (4 out of 5 animals for each group). All data are expressed as the mean ± s.e.m. *P < 0.05 and **P < 0.01 for one out of three independent experiments.
Figure 4
Figure 4
GDF11 is overexpressed in β-thalassemia and is associated with ineffective erythropoiesis. (a) Gdf11 mRNA levels evaluated by qPCR in spleen and bone marrow erythroblasts from wild-type and thalassemic mice (n = 4 for each). AU, arbitrary units. (b) Representative activin A, activin B and GDF11 immunohistochemical staining of spleen sections from wild-type and thalassemic mice treated with PBS or RAP-011 for 30 d. (c) Representative activin A, activin B and GDF11 immunohistochemical staining of spleen sections from wild-type C57BL/6 mice under conditions of normoxia, hypoxia and hemolytic anemia (aRBC). (d) Gdf11, activin A (Inhba) and activin B (Inhbb) mRNA levels evaluated by qPCR from the spleen of wild-type C57BL/6 mice under conditions of normoxia, hypoxia and hemolytic anemia (n = 4 for each). (e,f) Confocal micrographs showing splenic sections from wild-type and thalassemic mice. GDF11 protein expression is shown in green, Ter-119+ erythroblasts in blue and F4/80+ (e) and CD71+ (f) cells in red. (g) Confocal micrographs showing sections from spleen and bone marrow of thalassemic mice. GDF11 protein expression is shown in green and nuclei (DAPI) in blue. Scale bars, 50 μm. (h) Detection of ActRIIA Fc–bound ligands in sera from healthy individuals (n = 8) and subjects with thalassemia (n = 16). (i) Detection of ActRIIa Fc–bound ligand GDF11 in sera from wild-type (n = 6) mice and thalassemic mice (n = 5). All data are expressed as the mean ± s.e.m. *P < 0.05, **P < 0.01 and ***P < 0.001 for one out of three independent experiments.
Figure 5
Figure 5
ActRIIA trap therapy promotes early-stage erythroblast apoptosis in thalassemic mice. (a) TUNEL staining of CD71+ erythroblasts. Confocal micrographs showing sections from wild-type and thalassemic mice (n = 3 mice for each group) treated with RAP-011 or PBS for 30 d. TUNEL+ staining is shown in green, Ter-119+ in blue and CD71+ in red. (b) Flow cytometric quantification of Fas+ and FasL+ erythroblast populations (Ery.A, Ery.B and Ery.C) from bone marrow and spleen of thalassemic mice treated with RAP-011 or with PBS for 30 d (n = 5 mice for each group). Representative FACS histograms of Fas and FasL staining in Ery.B spleen cells are also shown. (c) The percentage of Fas and FasL cells in cultured thalassemic erythroblast cells at the indicated stages of differentiation after treatment without or with neutralizing antibodies specific for GDF11 (GDF11 Ab), activin A (ActA Ab) or activin B (ActB Ab) (one out of three independent experiments, n = 3 mice for each group). (d) Quantification of apoptosis (annexin V (AV) and 7-AAD staining) in cultured erythroblasts from thalassemic mice treated with neutralizing antibodies against GDF11, activin A or activin B (one out of three independent experiments, n = 3 mice for each group). All data are expressed as the mean ± s.e.m. *P < 0.05 and **P < 0.01.
Figure 6
Figure 6
GDF11 inactivation promotes terminal erythropoiesis. (a) Immunohistochemical staining of phosphorylated Smad2/3 (p-Smad2/3), p-Smad1/5 and ActRIIA and ActRIIB in spleen samples from wild-type and thalassemic mice treated with PBS or RAP-011 for 30 d. (b,c) Confocal micrographs showing sections of spleen red pulp from wild-type and thalassemic mice. p-Smad2/3 protein expression (green), Ter-119+ erythroblasts (blue) and F4/80+ (b) and CD71+ (c) cells (red) are shown. (d) Confocal micrographs showing sections of spleen and bone marrow from thalassemic mice. p-Smad2/3 protein expression (green) and Ter-119+ erythroblasts (blue) are shown. (eg) Erythroblast cultures, derived from cells from thalassemic mice, treated with pyrrolidine dithiocarbamate (PDTC) (5 μM), RAP-011 (10 μg/ml) or PBS as a vehicle for 48 h. (e) Flow cytometry analysis showing intracellular GDF11 levels after treatment with PDTC or RAP-011. (f) Erythroblast differentiation after treatment with PDTC. Cells were classified as immature (Ter-119+CD71+) or mature (Ter-119+CD71) erythroblasts. (g) ROS levels in bone marrow–derived thalassemic erythroblasts after treatment with RAP-011 or PDTC. (h) ROS production after treatment of erythroblast cultures from bone marrow of thalassemic mice with rGDF11, rGDF15 or rGDF8 (5 or 50 ng/ml). ROS generation was measured by FACS using DCFH. (i) Erythroblast cultures, derived from bone marrow of thalassemic mice, treated with neutralizing antibodies against activin A, activin B or GDF11 propeptide. Flow cytometry analysis of erythroblast differentiation using CD71 and Ter-119 staining and FSC distribution is shown. Cells were classified as ProE (Ter-119dimCD71+), immature (Ter-119+CD71+) and mature (Ter-119+CD71) erythroblasts. (j) Erythroblast differentiation in samples treated with rGDF11 (100 ng/ml) for 48 h, as evaluated by CD71 and Ter-119 staining and FSC distribution. The percentages of immature (Ter-119+CD71+) and mature (Ter-119+CD71) erythroblast populations are shown. All data are expressed as the mean ± s.e.m. *P < 0.05, **P < 0.01; n = 3–5 mice per group for one out of three independent experiments.

Similar articles

Cited by

References

    1. Higgs DR, Engel JD & Stamatoyannopoulos G Thalassaemia. Lancet 379, 373–383 (2012). - PubMed
    1. Weiss MJ & dos Santos CO Chaperoning erythropoiesis. Blood 113, 2136–2144 (2009). - PMC - PubMed
    1. Kihm AJ et al. An abundant erythroid protein that stabilizes free α-haemoglobin. Nature 417, 758–763 (2002). - PubMed
    1. Ribeil JA et al. Ineffective erythropoiesis in β-thalassemia. ScientificWorldJournal 2013, 1–11 (2013). - PubMed
    1. Sorensen S, Rubin E, Polster H, Mohandas N & Schrier S The role of membrane skeletal-associated α-globin in the pathophysiology of β-thalassemia. Blood 75, 1333–1336 (1990). - PubMed

Publication types

MeSH terms