. 2014 Mar 21;9(3):e92504.
doi: 10.1371/journal.pone.0092504. eCollection 2014.

Multifactorial comparative proteomic study of cytochrome P450 2E1 function in chronic alcohol administration

Affiliations

Multifactorial comparative proteomic study of cytochrome P450 2E1 function in chronic alcohol administration

Yuan Wang et al. PLoS One. .

Abstract

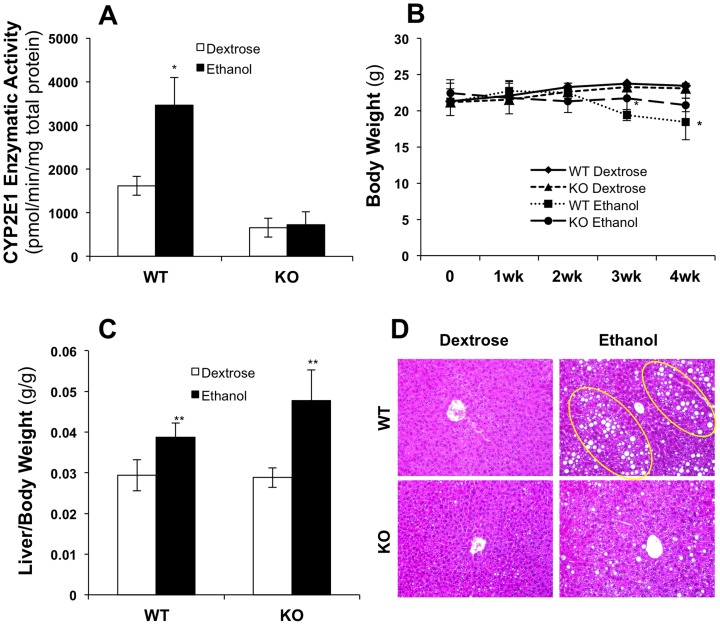
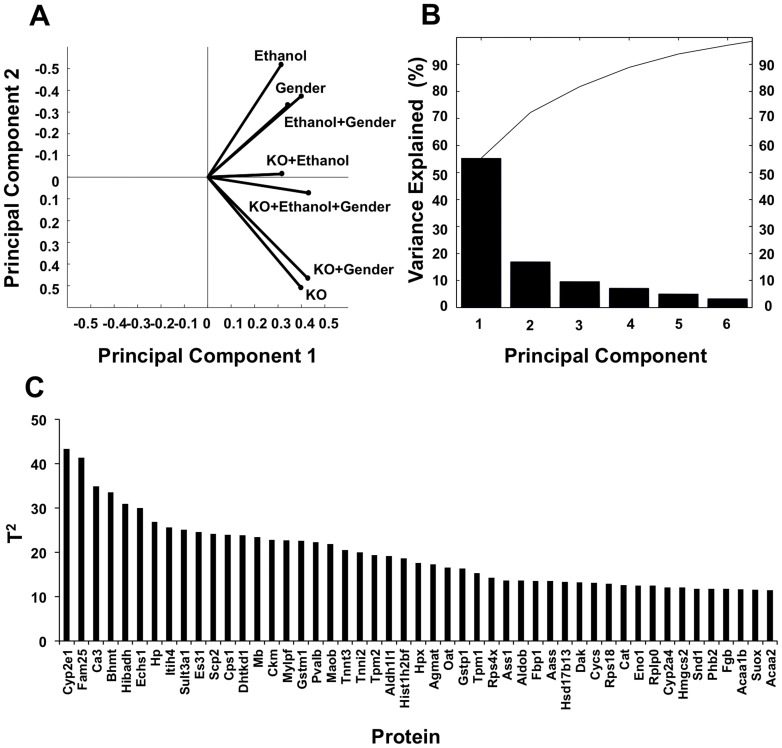
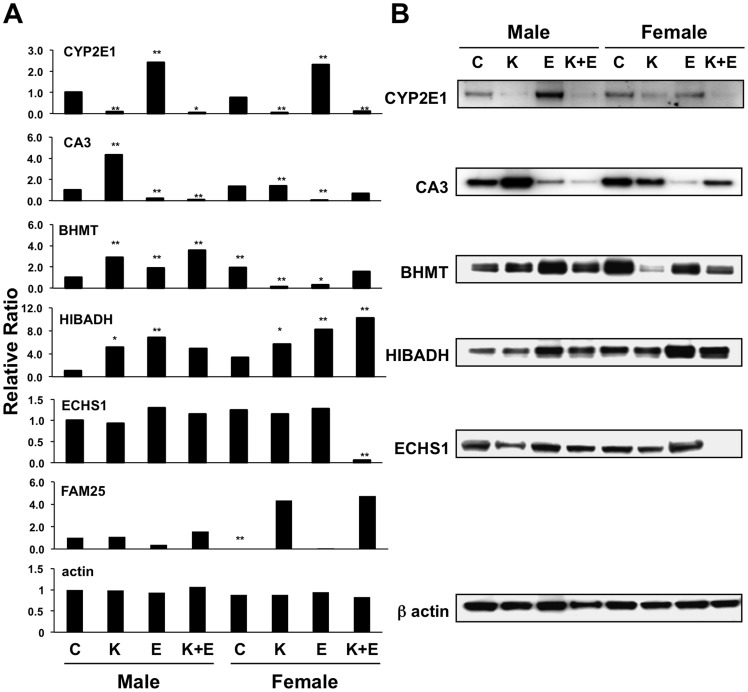
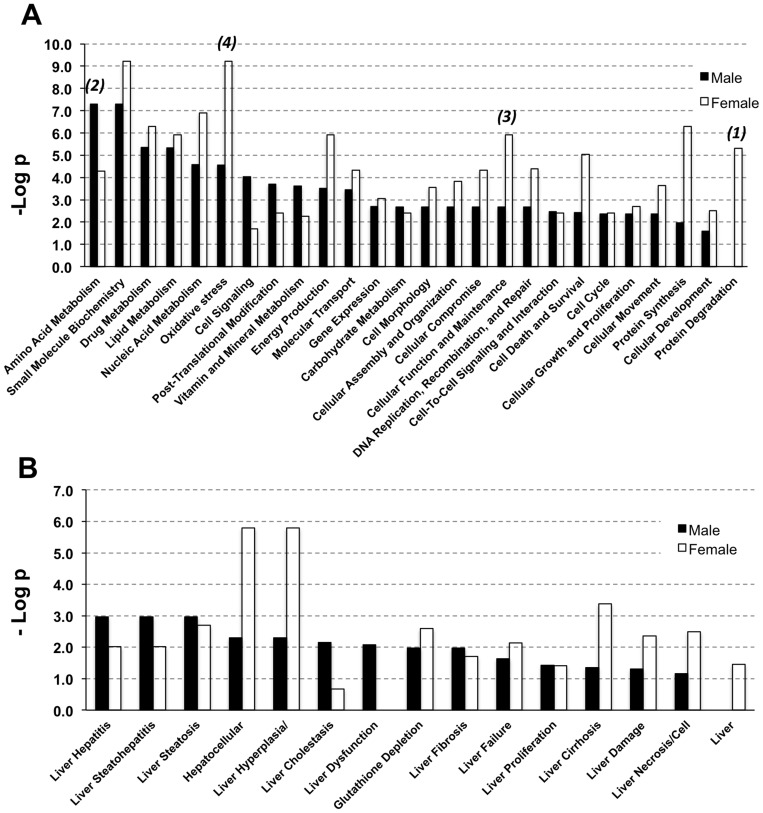
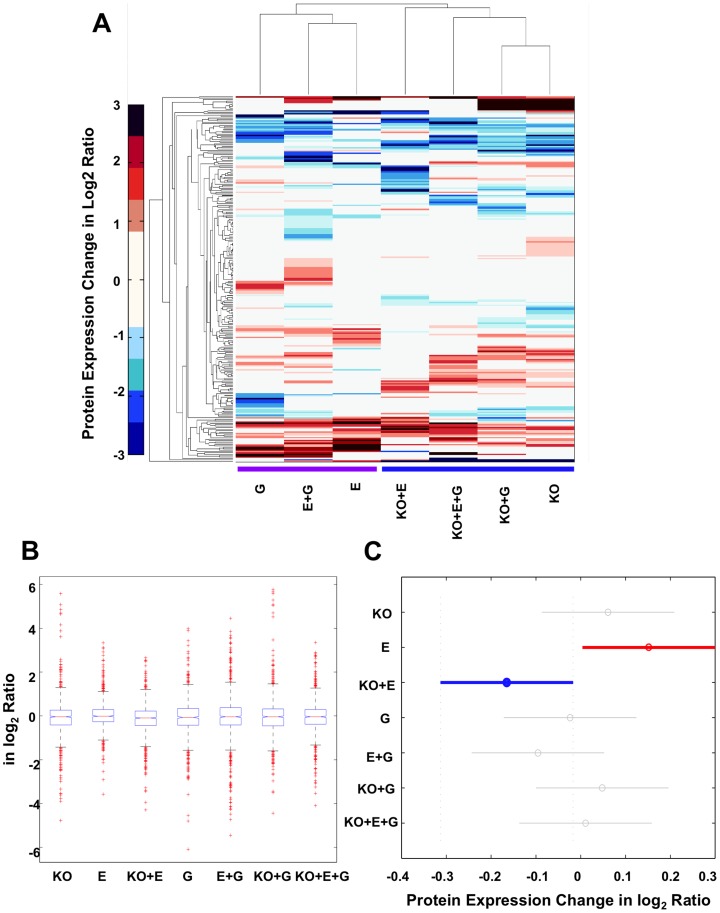
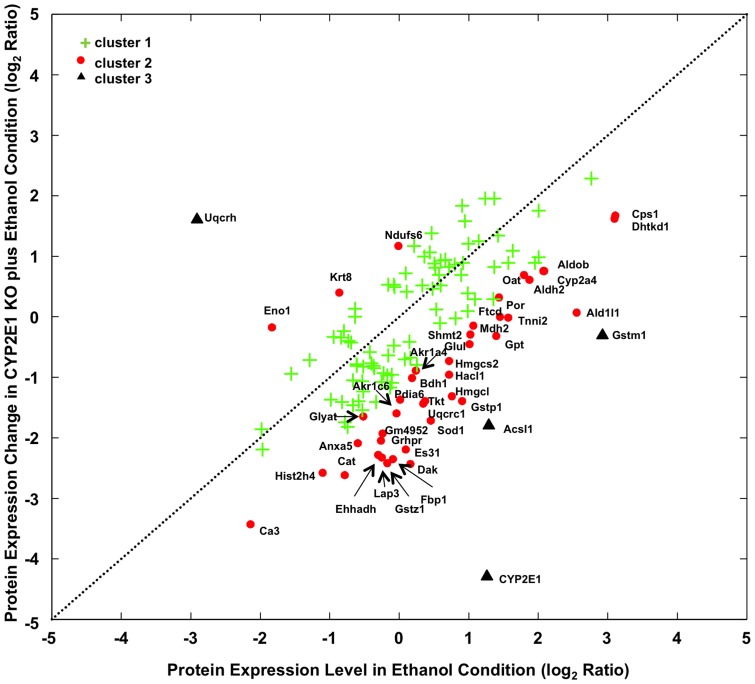
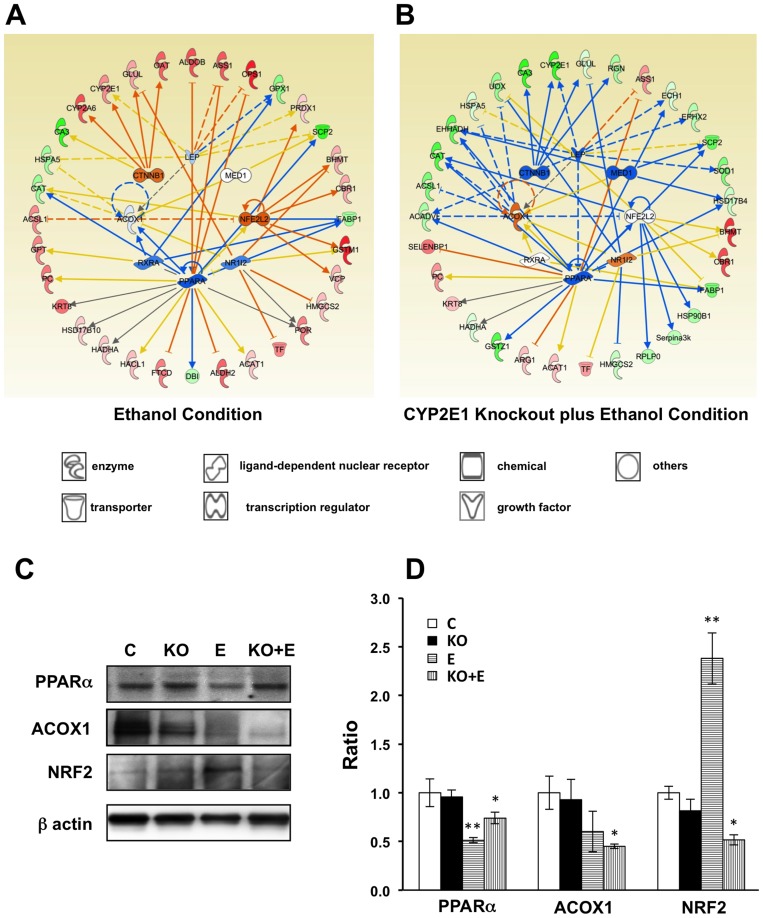
With the use of iTRAQ technique, a multifactorial comparative proteomic study can be performed. In this study, to obtain an overview of ethanol, CYP2E1 and gender effects on liver injury and gain more insight into the underlying molecular mechanism, mouse liver proteomes were quantitatively analyzed using iTRAQ under eight conditions including mice of different genders, wild type versus CYP2E1 knockout, and normal versus alcohol diet. A series of statistical and bioinformatic analyses were explored to simplify and clarify multifactorial comparative proteomic data. First, with the Principle Component analysis, six proteins, CYP2E1, FAM25, CA3, BHMT, HIBADH and ECHS1, involved in oxidation reduction, energy and lipid metabolism and amino acid metabolism, were identified as the most differentially expressed gene products across all of the experimental conditions of our chronic alcoholism model. Second, hierarchical clustering analysis showed CYP2E1 knockout played a primary role in the overall differential protein expression compared with ethanol and gender factors. Furthermore, pair-wise multiple comparisons have revealed that the only significant expression difference lied in wild-type and CYP2E1 knockout mice both treated with ethanol. Third, K-mean clustering analysis indicated that the CYP2E1 knockout had the reverse effect on ethanol induced oxidative stress and lipid oxidation. More importantly, IPA analysis of proteomic data inferred that the gene expressions of two upstream regulators, NRF2 and PPARα, regulated by chronic alcohol feeding and CYP2E1 knockout, are involved in ethanol induced oxidative stress and lipid oxidation. The present study provides an effectively comprehensive data analysis strategy to compare multiple biological factors, contributing to biochemical effects of alcohol on the liver. The mass spectrometry proteomics data have been deposited to the ProteomeXchange with data set identifier of PXD000635.


Conflict of interest statement

Competing Interests: The authors have declared that no competing interests exist.

Figures

Figure 1
Figure 1. Mouse model after chronic ethanol feeding.
(A) Microsomal p-nitrophenol hydroxylase activities; (B) Mouse body weight measurement; (C) Liver to body weight ratio; (D) Mouse liver tissue specimens stained with hematoxylin and eosin (H&E), arrows showing lipid droplets. *p<0.05 and **p<0.01, compared with WT dextrose group. (n = 4 pairs of mice in each group)
Figure 2
Figure 2. Principal component analysis of the proteomic results.
(A) Biplots of PCA of seven observations which predicted to the space defined by the first and second principle components. (B) Variance explained by the top six principle components in seven observations. Each bar represents the individual variance explained by the principle component, and the curve shows cumulative explained variance of top principle components. (C) Proteins having Hotelling's T2 values greater than the third quartile.
Figure 3
Figure 3. Quantitative analysis of the top six proteins according to Hotelling's T2 test, CYP2E1, CA3, BHMT, HIBADH, ECHS1 and FAM25 in the eight mice models.
(A) iTRAQ labeling mass spectrometry results of the top six proteins. All values are relative to control mice (Dextrose diet, wild-type, male mice), *p<0.05 and **p<0.01. (B) Western blot of the same six proteins except FAM25 (no commercial antibody available). β-Actin was used as the loading control. C, control; K, CYP2E1 knockout; E, ethanol.
Figure 4
Figure 4. Gender differences in response to chronic alcohol feeding summarized by IPA analysis with the significantly changed proteins in male and female mice.
(A) Molecular and cellular function differences after chronic ethanol feeding in male and female mice. (B) Hepatotoxicity differences after chronic ethanol feeding in male and female mice.
Figure 5
Figure 5. Hierarchical clustering and ANOVA clustering analysis of protein expression changes in the seven observations.
(A) Hierarchical clustering analysis. The color bar denotes protein expression change in log2 ratio. Two major clusters were obtained with or without the knockout factor. ANOVA clustering analysis: (B) Boxplot of the protein expression changes in seven observations. The central mark is the median protein expression change in each observation, the edges of the box are the 25th and 75th percentiles, and the whiskers extend to the most extreme data points not considered outliers. The cross mark plotted outlier proteins. (C) Multiple comparisons of the mean protein expression changes in seven observations. This snapshot from the interactive output in Matlab represents the only significantly different observation pair, E and KO+E. KO, CYP2E1 knockout; E, ethanol; G, gender.
Figure 6
Figure 6. K-mean clustering of proteins with significant expression changes in ethanol and CYP2E1 knockout plus ethanol conditions.
The distance for clustering procedure was as described in Methods. Dash line represents where the protein expression change is equal in both conditions. Proteins located in cluster 1 were shown as a green cross, cluster 2 as a red spot and cluster 3 as a black triangle. Proteins located in cluster 2 and 3 were labeled with gene symbols with detailed information in Table 2.
Figure 7
Figure 7. IPA upstream regulator analysis of proteomic data under ethanol and CYP2E1 knockout plus ethanol conditions.
Networks and predicted upstream regulators assigned by IPA of differentially expressed proteins in ethanol condition (A) and CYP2E1 knockout plus ethanol condition (B). Symbols of target proteins in red color indicated the increase while in green color indicated the decrease in abundance. Symbol of upstream regulators in orange color indicated the predicted activation while in blue color indicated the predicted inhibition in confidence. The color intensity corresponds to the degree of significance. Proteins in white are those identified through the IPA Knowledge Base. Solid line indicates a direct molecular interaction, and a dashed line indicates an indirect molecular interaction. The orange, blue, yellow and gray lines indicated the predicted relationships as leading to activation, inhibition, finding inconsistent with state of downstream molecule, and effects not predicted, respectively. The symbol shapes denoted the molecular classes of the proteins. Western blot analysis of PPARa, ACOX1 and NRF2 (C, D). All values presented as the mean ±SD of the four mice in each group that have been normalized to β-actin and relative to control mice (Dextrose diet, wild-type, male mice). CON, control; KO, CYP2E1 knockout; E, ethanol. *p<0.05 and **p<0.01.

References

    1. Lieber CS (1984) Metabolism and metabolic effects of alcohol. Med Clin North Am 68: 3–31. - PubMed
    1. Ramaiah S, Rivera C, Arteel G (2004) Early-phase alcoholic liver disease: an update on animal models, pathology, and pathogenesis. Int J Toxicol 23: 217–231. - PubMed
    1. Nanji AA, Su GL, Laposata M, French SW (2002) Pathogenesis of alcoholic liver disease—recent advances. Alcohol Clin Exp Res 26: 731–736. - PubMed
    1. Lieber CS (2004) Alcoholic fatty liver: its pathogenesis and mechanism of progression to inflammation and fibrosis. Alcohol 34: 9–19. - PubMed
    1. Diehl AM (2002) Liver disease in alcohol abusers: clinical perspective. Alcohol 27: 7–11. - PubMed

Publication types