. 2014 Mar 20;15(3):5011-31.
doi: 10.3390/ijms15035011.

Bovine induced pluripotent stem cells are more resistant to apoptosis than testicular cells in response to mono-(2-ethylhexyl) phthalate

Affiliations

Bovine induced pluripotent stem cells are more resistant to apoptosis than testicular cells in response to mono-(2-ethylhexyl) phthalate

Ying-Chu Lin et al. Int J Mol Sci. .

Abstract

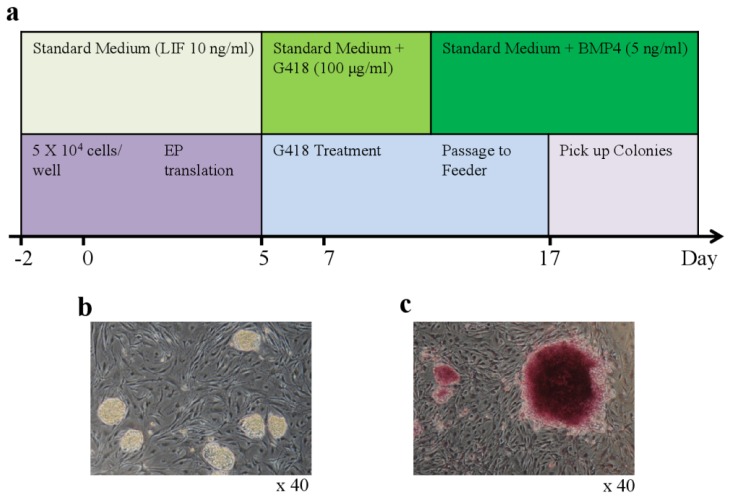
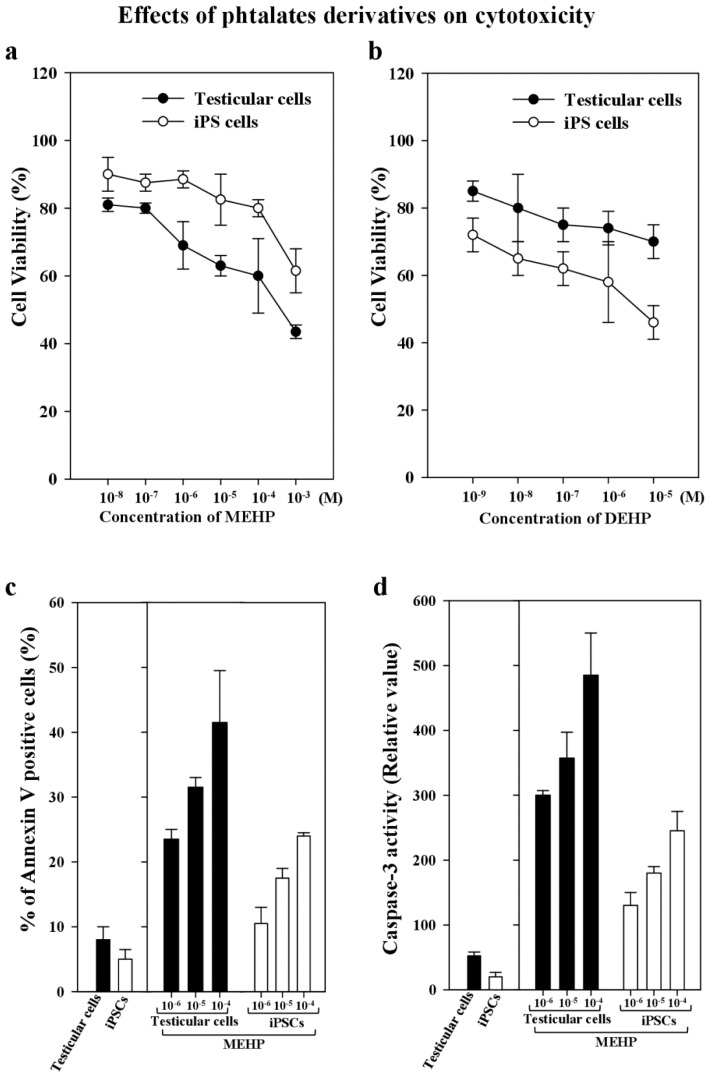
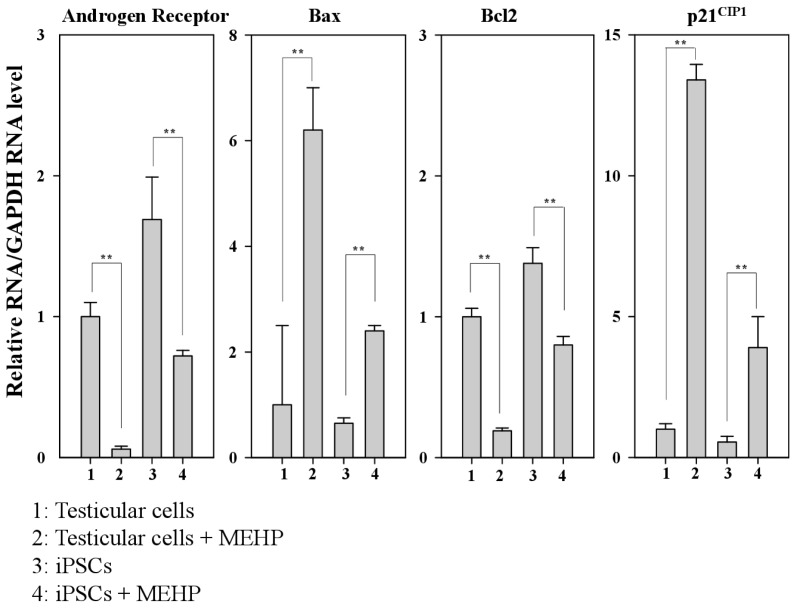
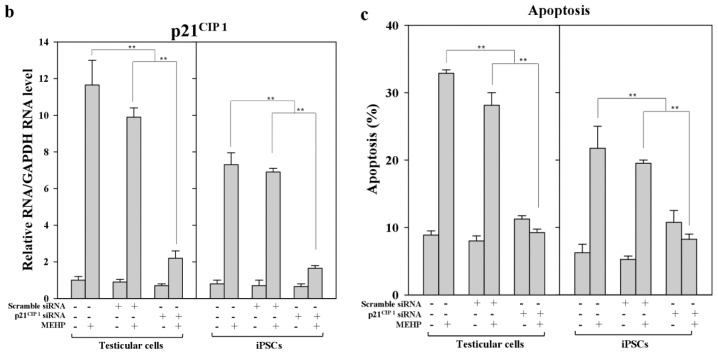
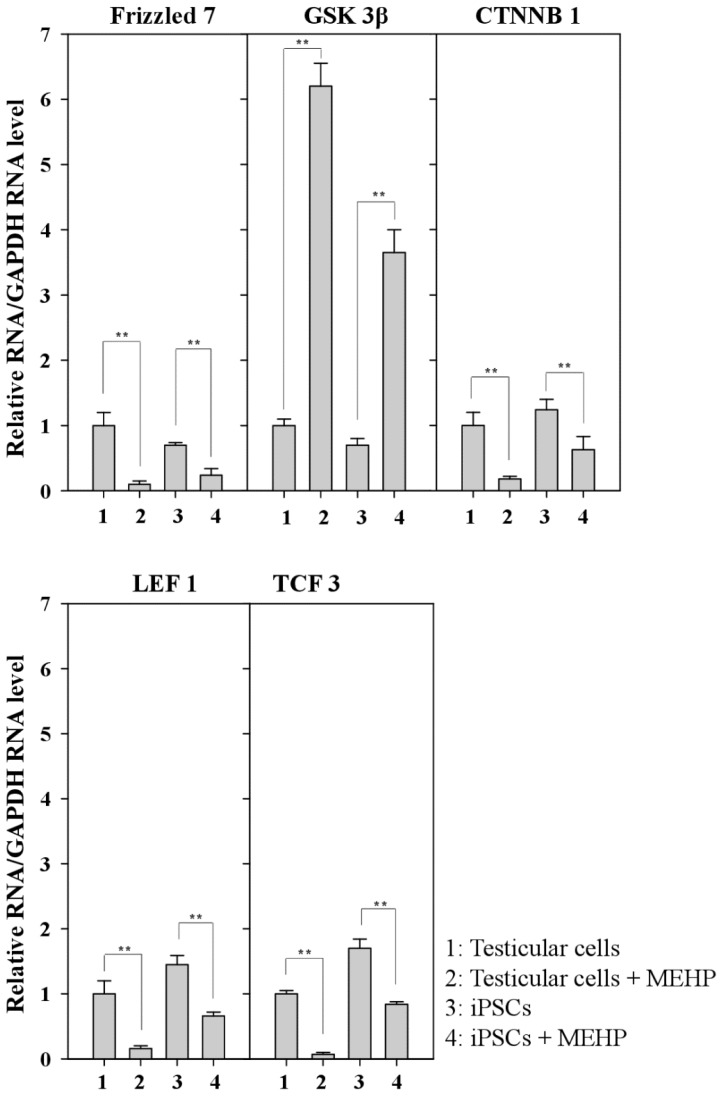
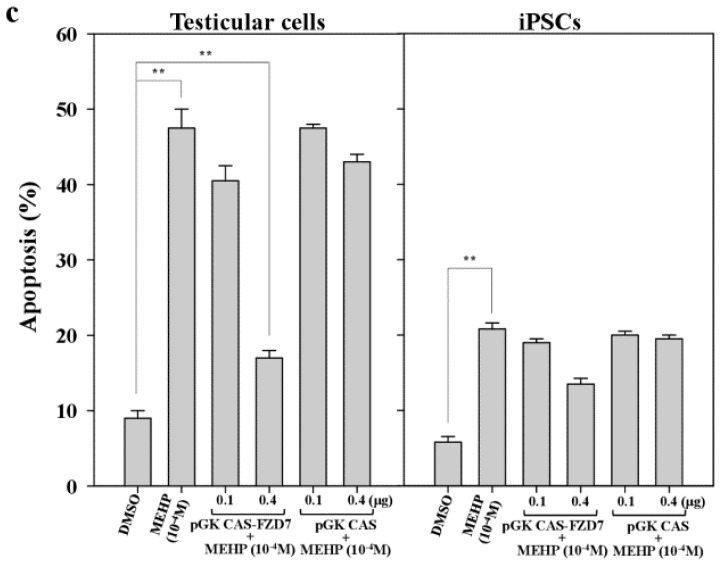
Although the androgen receptor (AR) has been implicated in the promotion of apoptosis in testicular cells (TSCs), the molecular pathway underlying AR-mediated apoptosis and its sensitivity to environmental hormones in TSCs and induced pluripotent stem cells (iPSCs) remain unclear. We generated the iPSCs from bovine TSCs via the electroporation of OCT4. The established iPSCs were supplemented with leukemia inhibitory factor and bone morphogenetic protein 4 to maintain and stabilize the expression of stemness genes and their pluripotency. Apoptosis signaling was assessed after exposure to mono-(2-ethylhexyl) phthalate (MEHP), the active metabolite of di-(2-ethylhexyl) phthalate. Here, we report that iPSCs were more resistant to MEHP-induced apoptosis than were original TSCs. MEHP also repressed the expression of AR and inactivated WNT signaling, and then led to the commitment of cells to apoptosis via the cyclin dependent kinase inhibitor p21CIP1. The loss of the frizzed receptor 7 and the gain of p21CIP were responsible for the stimulatory effect of MEHP on AR-mediated apoptosis. Our results suggest that testicular iPSCs can be used to study the signaling pathways involved in the response to environmental disruptors, and to assess the toxicity of environmental endocrine disruptors in terms of the maintenance of stemness and pluripotency.


Figures

Figure 1.
Figure 1.
Generation of iPSCs from bovine testicular cells. (a) Schematic diagram of the generation of bovine iPSCs by electroporation-mediated transfection; (b) Typical morphology of bovine iPSC colonies generated with the single factor OCT4 on day 25 after electroporation (magnification ×40); (c) Alkaline phosphatase staining of bovine iPSCs in large colonies of fibroblasts (magnification ×40).
Figure 2.
Figure 2.
In vivo pluripotency of bovine iPSCs. Teratoma formation at 6–8 weeks after the transplantation of 1F bovine iPSCs into SCID mice was examined. The teratomas were sectioned and stained with hematoxylin and eosin 6–8 weeks after transplantation (upper panels); The sections were stained with antibodies specific for cytokeratin (epithelial cells) or EMA (epithelial cells) (lower panels). Magnification ×400. The red arrow indicates nerve bundles, blood vessels, cytokeratin, and EMA, respectively.
Figure 3.
Figure 3.
Cell viability and apoptosis induced by phthalate derivatives in bovine testicular cells and iPSCs. (a) Cell viability was measured by Trypan Blue staining in the presence or absence of phthalate esters for 24 h; (b) Cell viability was measured by Trypan Blue staining in the presence or absence of DEHP for 24 h; (c) Apoptotic activity was measured by FITC-labeled annexin V, followed by flow cytometric analysis to identify the apoptotic cells, as described in the Experimental Section; (d) Caspase-3 activity in the testicular cells and iPSCs was measured after 10−4–10−6 M MEHP and 10−7 M staurosporin as a control were added to them for 24 h; and their apoptotic activity was analyzed. Data presented are means ± SD. The statistical analysis was performed with Student’s t-test.
Figure 4.
Figure 4.
Relative expression of genes related to androgen-receptor-mediated apoptotic signaling. Real-time PCR was performed using the bovine-specific primers listed in Table 2. Relative expression of the genes encoding the AR, BAX, BCL-2 and p21CIP1 are shown in bovine testicular cells and iPSCs. Values indicated are means ± SEM, n ≥ 3; ** p < 0.01.
Figure 5.
Figure 5.
Effects of the knockdown of p21CIP1 expression by siRNA on gene expression and apoptosis. Bovine iPSCs were treated with p21CIP1 siRNA, or a scrambled nonspecific siRNA, and treated with DMSO or 10−4 M MEHP for 12 h. (a) The expression levels of p21CIP1 were measured by Western blotting as described in the Experimental section. Lane 1; non-treated siRNA; lane 2, scramble siRNA; lane 3, p21CIP1 specific siRNA; (b) The expression levels of p21CIP1 were measured in triplicate samples by qRT-PCR, and were corrected to the GAPDH RNA levels; (c) Apoptotic cells were quantified by staining with annexin V, as described in the Experimental Section. (−, control DMSO (0.001%); +, 10−4 M MEHP in the presence (+) or absence (−) of the p21CIP1siRNA or scrambled siRNA). The values expressed as means ± SEM, n ≥ 3; ** p < 0.01.
Figure 5.
Figure 5.
Effects of the knockdown of p21CIP1 expression by siRNA on gene expression and apoptosis. Bovine iPSCs were treated with p21CIP1 siRNA, or a scrambled nonspecific siRNA, and treated with DMSO or 10−4 M MEHP for 12 h. (a) The expression levels of p21CIP1 were measured by Western blotting as described in the Experimental section. Lane 1; non-treated siRNA; lane 2, scramble siRNA; lane 3, p21CIP1 specific siRNA; (b) The expression levels of p21CIP1 were measured in triplicate samples by qRT-PCR, and were corrected to the GAPDH RNA levels; (c) Apoptotic cells were quantified by staining with annexin V, as described in the Experimental Section. (−, control DMSO (0.001%); +, 10−4 M MEHP in the presence (+) or absence (−) of the p21CIP1siRNA or scrambled siRNA). The values expressed as means ± SEM, n ≥ 3; ** p < 0.01.
Figure 6.
Figure 6.
Relative expression of genes related to the WNT/β-catenin canonical pathway. Relative expression of a series of Frizzled, GSK3β, CTNNB, LEF1, and TCF3 in bovine testicular cells and iPSCs. (Lane 1, control DMSO (0.001%) in testicular cells; lane 2, 10−4 M MEHP in testicular cells; lane 3, control DMSO (0.001%) in iPSCs; lane 4, 10−4 M MEHP in iPSCs. The values expressed as means ± SEM, n ≥ 3; ** p < 0.01.
Figure 7.
Figure 7.
Effects of the forced expression of the Frizzled receptor FZD7 on gene expression and apoptosis in testicular cells and iPSCs. (a) Protein expression of FZD7 in bovine iPSCs and testicular cells transfected with pGK-CAS-FZD7 (200 and 400 ng) were examined. After cultivation of transfectants for 24 h, MEHP (10−4 and 10−5 M) were added and cultured for another 24 h and then subjected to Western blotting, as described in the Experimental Section; (b) pGK-CAS-FZD7 (400 ng) or each control vector pGK-CAS (400 ng) was introduced into bovine iPSCs, which were cultured for 24 h; 10−4 M MEHP was added and the cells cultured for another 24 h. The relative expression of AR was quantified by quantitative polymerase chain reaction (qPCR), as described in the Experimental section; (c) Effect of FZD7 on apoptosis. Apoptotic cells were quantified as described in the Experimental Section. Values measured with DMSO were defined as 1. Values indicated are means ± SEM, n ≥ 3; * p < 0.05, ** p < 0.01.
Figure 7.
Figure 7.
Effects of the forced expression of the Frizzled receptor FZD7 on gene expression and apoptosis in testicular cells and iPSCs. (a) Protein expression of FZD7 in bovine iPSCs and testicular cells transfected with pGK-CAS-FZD7 (200 and 400 ng) were examined. After cultivation of transfectants for 24 h, MEHP (10−4 and 10−5 M) were added and cultured for another 24 h and then subjected to Western blotting, as described in the Experimental Section; (b) pGK-CAS-FZD7 (400 ng) or each control vector pGK-CAS (400 ng) was introduced into bovine iPSCs, which were cultured for 24 h; 10−4 M MEHP was added and the cells cultured for another 24 h. The relative expression of AR was quantified by quantitative polymerase chain reaction (qPCR), as described in the Experimental section; (c) Effect of FZD7 on apoptosis. Apoptotic cells were quantified as described in the Experimental Section. Values measured with DMSO were defined as 1. Values indicated are means ± SEM, n ≥ 3; * p < 0.05, ** p < 0.01.

References

    1. Lyche J.L., Gutleb A.C., Bergman A., Eriksen G.S., Murk A.J., Ropstad E., Saunders M., Skaare J.U. Reproductive and developmental toxicity of phthalates. J. Toxicol. Environ. Health Part B. 2009;12:225–249. - PubMed
    1. Jurewicz J., Hanke W. Exposure to phthalates: Reproductive outcome and children health A review of epidemiological studies. Int. J. Occup. Med. Environ. Health. 2011;24:115–141. - PubMed
    1. Sjoberg P., Lindqvist N.G., Ploen L. Age-dependent response of the rat testes to di(2-ethylhexyl) phthalate. Environ. Health Perspect. 1986;65:237–242. - PMC - PubMed
    1. Awal M.A., Kurohmaru M., Ishii M., Andriana B.B., Kanai Y., Hayashi Y. Mono-(2-ethylhexyl) phthalate (MEHP) induces spermatogenic cell apoptosis in guinea pig testes at prepubertal stage in vitro. Int. J. Toxicol. 2004;23:349–355. - PubMed
    1. Lehraiki A., Racine C., Krust A., Habert R., Levacher C. Phthalates impair germ cell number in the mouse fetal testis by an androgen- and estrogen-independent mechanism. Toxicol. Sci. 2009;111:372–382. - PMC - PubMed

Publication types

MeSH terms

Substances