

Selection of higher order regression models in the analysis of multi-factorial transcription data
- PMID: 24658540
- PMCID: PMC3962375
- DOI: 10.1371/journal.pone.0091840
Selection of higher order regression models in the analysis of multi-factorial transcription data
Abstract
Introduction: Many studies examine gene expression data that has been obtained under the influence of multiple factors, such as genetic background, environmental conditions, or exposure to diseases. The interplay of multiple factors may lead to effect modification and confounding. Higher order linear regression models can account for these effects. We present a new methodology for linear model selection and apply it to microarray data of bone marrow-derived macrophages. This experiment investigates the influence of three variable factors: the genetic background of the mice from which the macrophages were obtained, Yersinia enterocolitica infection (two strains, and a mock control), and treatment/non-treatment with interferon-γ.
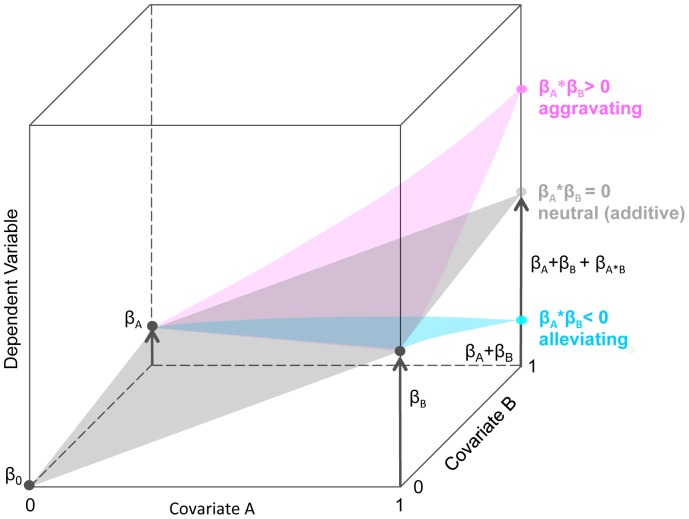
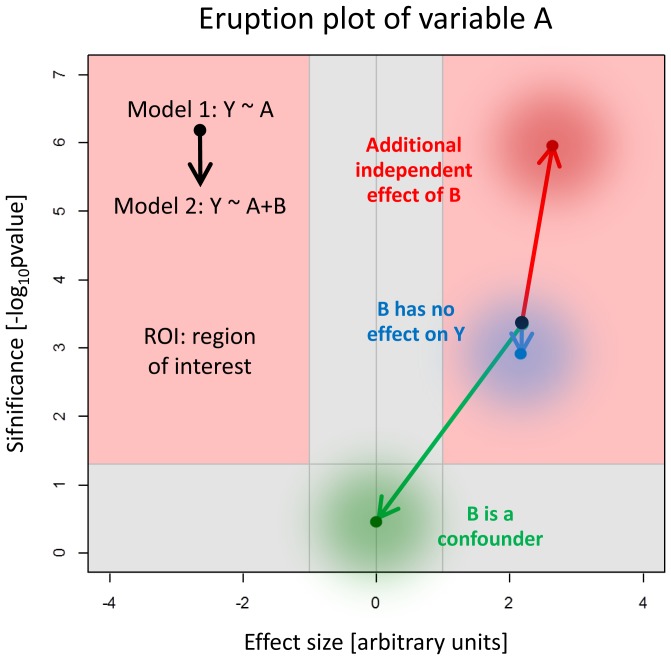
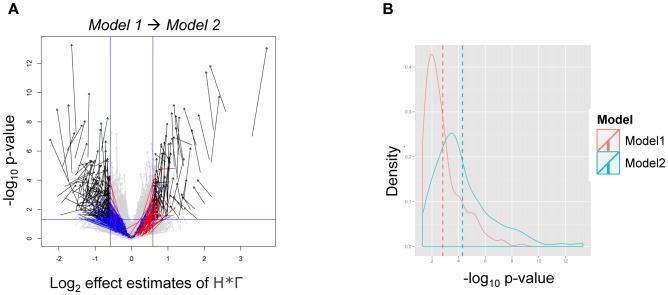
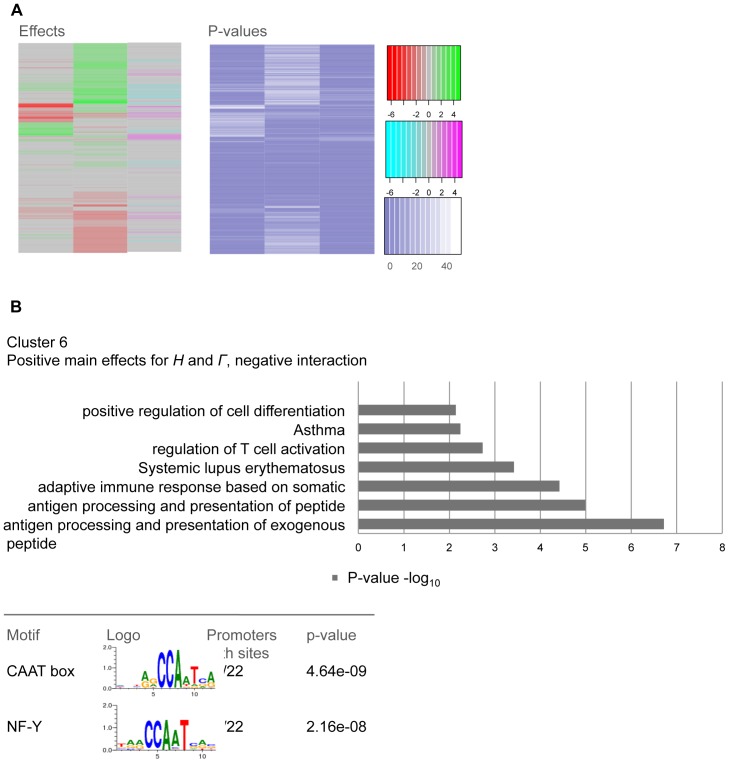
Results: We set up four different linear regression models in a hierarchical order. We introduce the eruption plot as a new practical tool for model selection complementary to global testing. It visually compares the size and significance of effect estimates between two nested models. Using this methodology we were able to select the most appropriate model by keeping only relevant factors showing additional explanatory power. Application to experimental data allowed us to qualify the interaction of factors as either neutral (no interaction), alleviating (co-occurring effects are weaker than expected from the single effects), or aggravating (stronger than expected). We find a biologically meaningful gene cluster of putative C2TA target genes that appear to be co-regulated with MHC class II genes.
Conclusions: We introduced the eruption plot as a tool for visual model comparison to identify relevant higher order interactions in the analysis of expression data obtained under the influence of multiple factors. We conclude that model selection in higher order linear regression models should generally be performed for the analysis of multi-factorial microarray data.
Conflict of interest statement
Figures
Similar articles
-
Role of strain differences on host resistance and the transcriptional response of macrophages to infection with Yersinia enterocolitica.Physiol Genomics. 2006 Mar 13;25(1):75-84. doi: 10.1152/physiolgenomics.00188.2005. Epub 2005 Dec 13. Physiol Genomics. 2006. PMID: 16352694
-
Bayesian variable selection for gene expression modeling with regulatory motif binding sites in neuroinflammatory events.Neuroinformatics. 2006 Winter;4(1):95-117. doi: 10.1385/NI:4:1:95. Neuroinformatics. 2006. PMID: 16595861
-
Role of IFN-gamma and IL-6 in a protective immune response to Yersinia enterocolitica in mice.BMC Microbiol. 2008 Sep 19;8:153. doi: 10.1186/1471-2180-8-153. BMC Microbiol. 2008. PMID: 18803824 Free PMC article.
-
Transcriptional responses of murine macrophages to infection with Yersinia enterocolitica.Cell Microbiol. 2004 Apr;6(4):377-90. doi: 10.1111/j.1462-5822.2004.00365.x. Cell Microbiol. 2004. PMID: 15009029
-
Experimental Yersinia enterocolitica infection in rodents: a model for human yersiniosis.APMIS. 1993 Jun;101(6):417-29. APMIS. 1993. PMID: 8363822 Review.
References
-
- Smyth GK (2004) Linear models and empirical bayes methods for assessing differential expression in microarray experiments. Stat Appl Genet Mol Biol 3: Article3. - PubMed
-
- Pan X, Ye P, Yuan DS, Wang X, Bader JS, et al. (2006) A DNA integrity network in the yeast Saccharomyces cerevisiae. Cell 124: 1069–1081. - PubMed
-
- Collins SR, Miller KM, Maas NL, Roguev A, Fillingham J, et al. (2007) Functional dissection of protein complexes involved in yeast chromosome biology using a genetic interaction map. Nature 446: 806–810. - PubMed
-
- Hummel M, Meister R, Mansmann U (2008) GlobalANCOVA: exploration and assessment of gene group effects. Bioinformatics 24: 78–85. - PubMed
Publication types
MeSH terms
Substances
LinkOut - more resources
Full Text Sources
Other Literature Sources
Research Materials
