

Real-time imaging of oxidative and nitrosative stress in the liver of live animals for drug-toxicity testing
- PMID: 24658645
- PMCID: PMC4070437
- DOI: 10.1038/nbt.2838
Real-time imaging of oxidative and nitrosative stress in the liver of live animals for drug-toxicity testing
Abstract
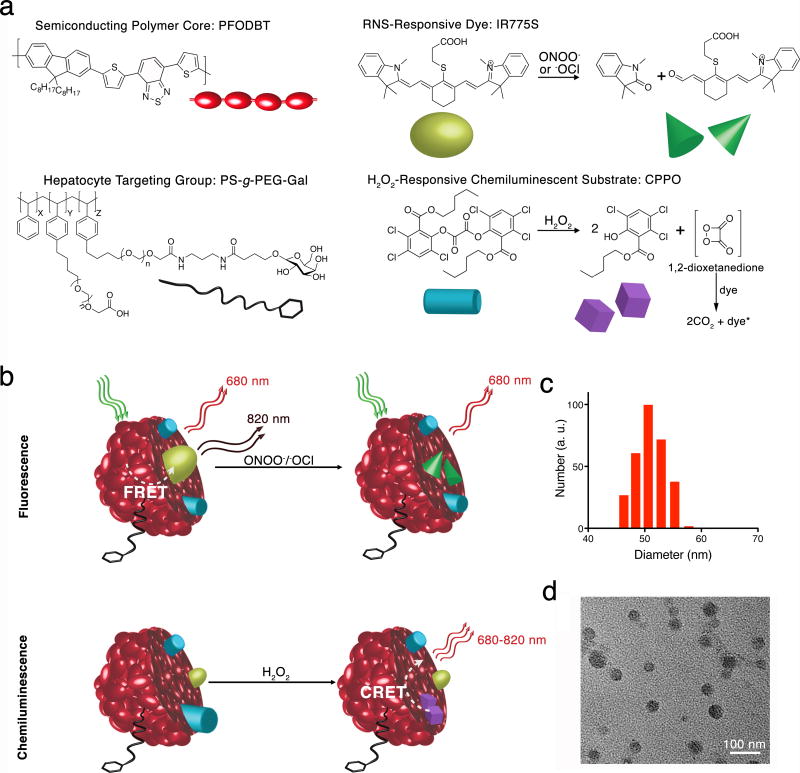
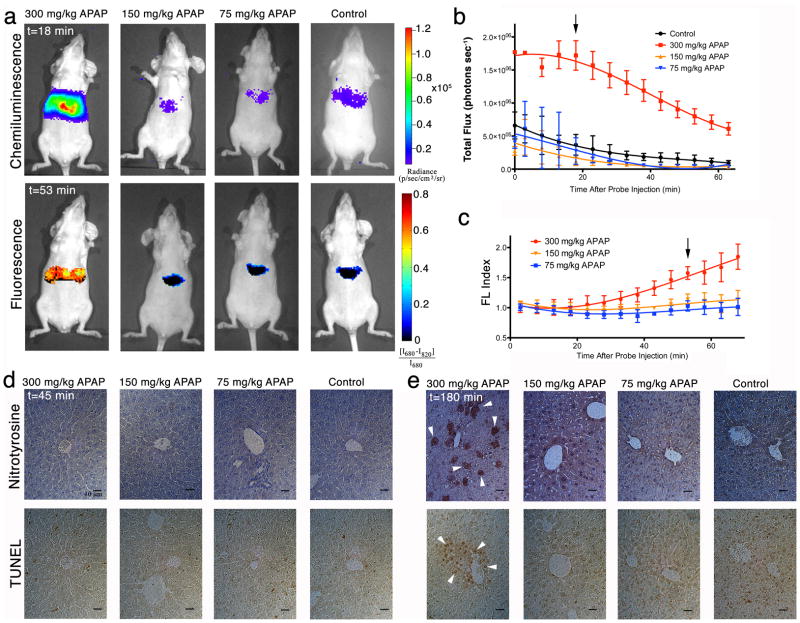
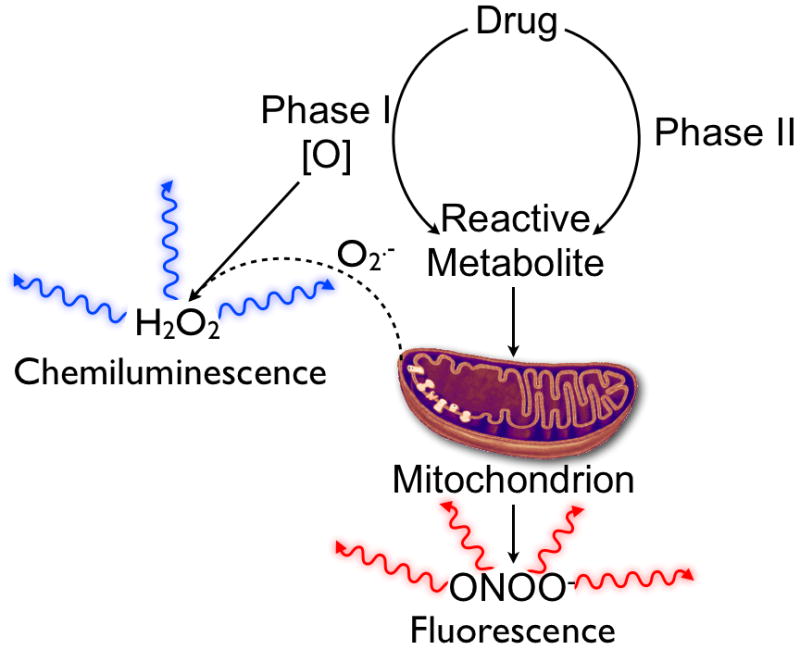
Current drug-safety assays for hepatotoxicity rely on biomarkers with low predictive power. The production of radical species, specifically reactive oxygen species (ROS) and reactive nitrogen species (RNS), has been proposed as an early unifying event linking the bioactivation of drugs to hepatotoxicity and as a more direct and mechanistic indicator of hepatotoxic potential. Here we present a nanosensor for rapid, real-time in vivo imaging of drug-induced ROS and RNS for direct evaluation of acute hepatotoxicity. By combining fluorescence resonance energy transfer (FRET) and chemiluminescence resonance energy transfer (CRET), our semiconducting polymer-based nanosensor simultaneously and differentially detects RNS and ROS using two optically independent channels. We imaged drug-induced hepatotoxicity and its remediation longitudinally in mice after systemic challenge with acetaminophen or isoniazid. We detected dose-dependent ROS and RNS activity in the liver within minutes of drug challenge, which preceded histological changes, protein nitration and DNA double-strand-break induction.
Figures
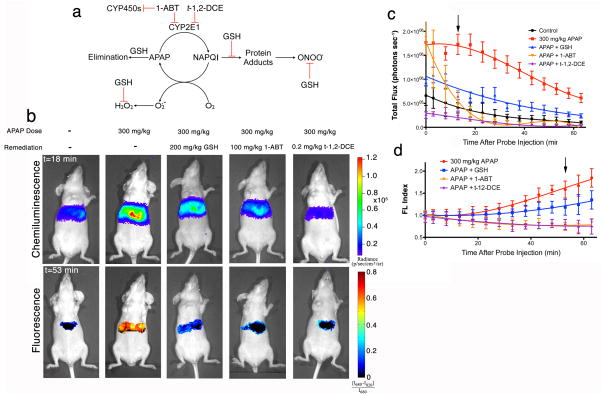
 indicates inhibition. (b) Representative images of mice receiving, from left to right, saline, 300 mg/kg APAP i.p. alone, and 300 mg/kg APAP with GSH (200 mg/kg i.v.), 1-ABT (2×100 mg/kg i.p.), or t-1,2-DCE (0.2 mg/kg i.p.), followed by CF-SPN (0.8 mg) i.v. The emission intensities of the liver for the (c) chemiluminescence or (d) fluorescent ratiometric signals are shown over time. The black arrows indicate the respective time points shown in (a). Values are the mean±s.d. for n=3 mice.
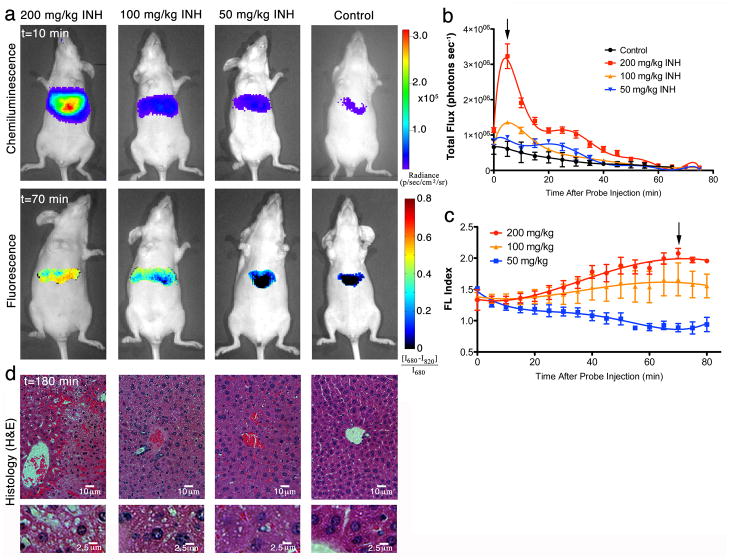
Comment in
-
Making light of stress.Nat Biotechnol. 2014 Apr;32(4):337-8. doi: 10.1038/nbt.2873. Nat Biotechnol. 2014. PMID: 24714482 No abstract available.
References
-
- Nasr A, Lauterio TJ, Davis MW. Unapproved drugs in the United States and the Food and Drug Administration. Adv Ther. 2011;28:842–856. - PubMed
-
- Budnitz DS, et al. National surveillance of emergency department visits for outpatient adverse drug events. JAMA. 2006;296:1858–1866. - PubMed
-
- Sakatis MZ, et al. Preclinical strategy to reduce clinical hepatotoxicity using in vitro bioactivation data for >200 compounds. Chem Res Toxicol. 2012;25:2067–2082. - PubMed
-
- Srivastava A, et al. Role of reactive metabolites in drug-induced hepatotoxicity. Handb Exp Pharmacol. 2010;196:165–194. - PubMed
-
- Dimasi JA. Risks in new drug development: approval success rates for investigational drugs. Clin Pharmacol Ther. 2001;69:297–307. - PubMed
Publication types
MeSH terms
Substances
Grants and funding
LinkOut - more resources
Full Text Sources
Other Literature Sources
Medical
