Meta-Analysis
. 2014 Feb 4;160(3):171.
doi: 10.7326/M13-1484.

Accuracy of fecal immunochemical tests for colorectal cancer: systematic review and meta-analysis

Meta-Analysis

Accuracy of fecal immunochemical tests for colorectal cancer: systematic review and meta-analysis

Jeffrey K Lee et al. Ann Intern Med. .

Abstract

Background: Performance characteristics of fecal immunochemical tests (FITs) to screen for colorectal cancer (CRC) have been inconsistent.

Purpose: To synthesize data about the diagnostic accuracy of FITs for CRC and identify factors affecting its performance characteristics.

Data sources: Online databases, including MEDLINE and EMBASE, and bibliographies of included studies from 1996 to 2013.

Study selection: All studies evaluating the diagnostic accuracy of FITs for CRC in asymptomatic, average-risk adults.

Data extraction: Two reviewers independently extracted data and critiqued study quality.

Data synthesis: Nineteen eligible studies were included and meta-analyzed. The pooled sensitivity, specificity, positive likelihood ratio, and negative likelihood ratio of FITs for CRC were 0.79 (95% CI, 0.69 to 0.86), 0.94 (CI, 0.92 to 0.95), 13.10 (CI, 10.49 to 16.35), 0.23 (CI, 0.15 to 0.33), respectively, with an overall diagnostic accuracy of 95% (CI, 93% to 97%). There was substantial heterogeneity between studies in both the pooled sensitivity and specificity estimates. Stratifying by cutoff value for a positive test result or removal of discontinued FIT brands resulted in homogeneous sensitivity estimates. Sensitivity for CRC improved with lower assay cutoff values for a positive test result (for example, 0.89 [CI, 0.80 to 0.95] at a cutoff value less than 20 µg/g vs. 0.70 [CI, 0.55 to 0.81] at cutoff values of 20 to 50 µg/g) but with a corresponding decrease in specificity. A single-sample FIT had similar sensitivity and specificity as several samples, independent of FIT brand.

Limitations: Only English-language articles were included. Lack of data prevented complete subgroup analyses by FIT brand.

Conclusion: Fecal immunochemical tests are moderately sensitive, are highly specific, and have high overall diagnostic accuracy for detecting CRC. Diagnostic performance of FITs depends on the cutoff value for a positive test result.

Primary funding source: National Institute of Diabetes and Digestive and Kidney Diseases and National Cancer Institute.


Conflict of interest statement

Potential Conflicts of Interest: Disclosures can be viewed at www.acponline.org/authors/icmje/ConflictOfInterestForms.do?msNum=M13-1484.

Figures

Appendix Figure 1
Appendix Figure 1. Overall quality assessment of included studies
QUADAS-2 = Quality Assessment of Diagnostic Accuracy Studies 2.
Appendix Figure 2
Appendix Figure 2. Pooled positive and negative likelihood ratios for fecal immunochemical tests for the detection of colorectal cancer for all included studies
The circles in squares represent the point estimate, the horizontal lines represent the 95% CI, the dotted lines represent the pooled estimate, and the diamonds represent the 95% CI of the pooled estimate. DLR = diagnostic likelihood ratio.
Appendix Figure 3
Appendix Figure 3. HSROC curve of the sensitivity versus specificity of fecal immunochemical tests for the detection of colorectal cancer for all included studies
The circles represent the data from each included study, the straight line represents the curve, and the diamond represents the summary point of the curve to which the pooled sensitivity and specificity correspond. The dashed line represents the 95% confidence area for the summary point, and the dotted line represents the 95% confidence area in which a new diagnostic accuracy fecal immunochemical test study will be located. AUC = area under the curve; SENS = sensitivity; SPEC = specificity; HSROC = hierarchical summary receiver-operating characteristic.
Appendix Figure 4
Appendix Figure 4. Subgroup analysis: pooled sensitivity and specificity for 1-sample fecal immunochemical test studies
The circles in squares represent the point estimate, the horizontal lines represent the 95% CI, the dotted lines represent the pooled estimate, and the diamonds represent the 95% CI of the pooled estimate.
Appendix Figure 5
Appendix Figure 5. Subgroup analysis: pooled sensitivity and specificity for 2-sample fecal immunochemical test studies
The circles in squares represent the point estimate, the horizontal lines represent the 95% CI, the dotted lines represent the pooled estimate, and the diamonds represent the 95% CI of the pooled estimate.
Appendix Figure 6
Appendix Figure 6. Subgroup analysis: pooled sensitivity and specificity for 3-sample fecal immunochemical test studies
The circles in squares represent the point estimate, the horizontal lines represent the 95% CI, the dotted lines represent the pooled estimate, and the diamonds represent the 95% CI of the pooled estimate.
Appendix Figure 7
Appendix Figure 7. Subgroup analysis: pooled sensitivity and specificity for fecal immunochemical test studies with cutoff <20 μg/g
The circles in squares represent the point estimate, the horizontal lines represent the 95% CI, the dotted lines represent the pooled estimate, and the diamonds represent the 95% CI of the pooled estimate.
Appendix Figure 8
Appendix Figure 8. Subgroup analysis: pooled sensitivity and specificity for fecal immunochemical test studies with cutoff 20–50 μg/g
The circles in squares represent the point estimate, the horizontal lines represent the 95% CI, the dotted lines represent the pooled estimate, and the diamonds represent the 95% CI of the pooled estimate.
Appendix Figure 9
Appendix Figure 9. Subgroup analysis: pooled sensitivity and specificity for fecal immunochemical test studies with cutoff >50 μg/g
The circles in squares represent the point estimate, the horizontal lines represent the 95% CI, the dotted lines represent the pooled estimate, and the diamonds represent the 95% CI of the pooled estimate.
Appendix Figure 10
Appendix Figure 10. Subgroup analysis: pooled sensitivity and specificity for OC-Light fecal immunochemical tests
The circles in squares represent the point estimate, the horizontal lines represent the 95% CI, the dotted lines represent the pooled estimate, and the diamonds represent the 95% CI of the pooled estimate.
Appendix Figure 11
Appendix Figure 11. Subgroup analysis: pooled sensitivity and specificity for OC-Micro fecal immunochemical tests
The circles in squares represent the point estimate, the horizontal lines represent the 95% CI, the dotted lines represent the pooled estimate, and the diamonds represent the 95% CI of the pooled estimate.
Appendix Figure 12
Appendix Figure 12. Subgroup analysis: pooled sensitivity and specificity for studies using colonoscopy to follow-up of patients with negative fecal immunochemical test results
The circles in squares represent the point estimate, the horizontal lines represent the 95% CI, the dotted lines represent the pooled estimate, and the diamonds represent the 95% CI of the pooled estimate.
Appendix Figure 13
Appendix Figure 13. Subgroup analysis: pooled sensitivity and specificity for studies using a 2-y longitudinal follow-up of patients with negative fecal immunochemical test results
The circles in squares represent the point estimate, the horizontal lines represent the 95% CI, the dotted lines represent the pooled estimate, and the diamonds represent the 95% CI of the pooled estimate.
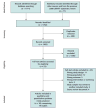
Figure 1
Figure 1. Summary of evidence search and selection
USPSTF = U.S. Preventive Services Task Force.
Figure 2
Figure 2. Pooled sensitivity and specificity for fecal immunochemical tests for the detection of colorectal cancer for all included studies
The circles in squares represent the point estimate, the horizontal lines represent the 95% CI, the dotted lines represent the pooled estimate, and the diamonds represent the 95% CI of the pooled estimate.

References

    1. Siegel R, Naishadham D, Jemal A. Cancer statistics, 2013. CA Cancer J Clin. 2013;63:11–30. - PubMed
    1. Hardcastle JD, Chamberlain JO, Robinson MH, Moss SM, Amar SS, Balfour TW, et al. Randomised controlled trial of faecal-occult-blood screening for colorectal cancer. Lancet. 1996;348:1472–7. - PubMed
    1. Kronborg O, Fenger C, Olsen J, Jørgensen OD, Søndergaard O. Randomised study of screening for colorectal cancer with faecal-occult-blood test. Lancet. 1996;348:1467–71. - PubMed
    1. Mandel JS, Bond JH, Church TR, Snover DC, Bradley GM, Schuman LM, et al. Reducing mortality from colorectal cancer by screening for fecal occult blood. Minnesota Colon Cancer Control Study. N Engl J Med. 1993;328:1365–71. - PubMed
    1. Lieberman DA, Weiss DG, Veterans Affairs Cooperative Study Group 380 One-time screening for colorectal cancer with combined fecal occult-blood testing and examination of the distal colon. N Engl J Med. 2001;345:555–60. - PubMed

Publication types