. 2014 May 2;289(18):12520-34.
doi: 10.1074/jbc.M114.551762. Epub 2014 Mar 21.

Transcription of angiogenin and ribonuclease 4 is regulated by RNA polymerase III elements and a CCCTC binding factor (CTCF)-dependent intragenic chromatin loop

Affiliations

Transcription of angiogenin and ribonuclease 4 is regulated by RNA polymerase III elements and a CCCTC binding factor (CTCF)-dependent intragenic chromatin loop

Jinghao Sheng et al. J Biol Chem. .

Abstract

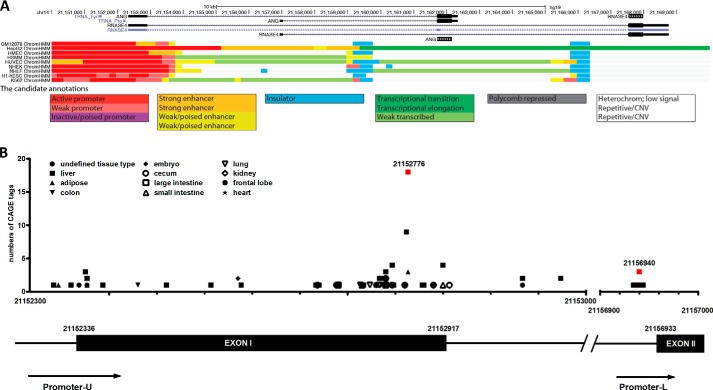
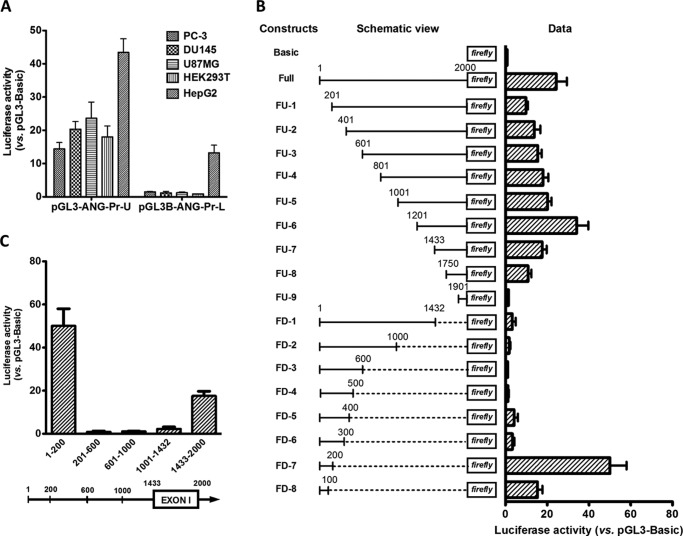
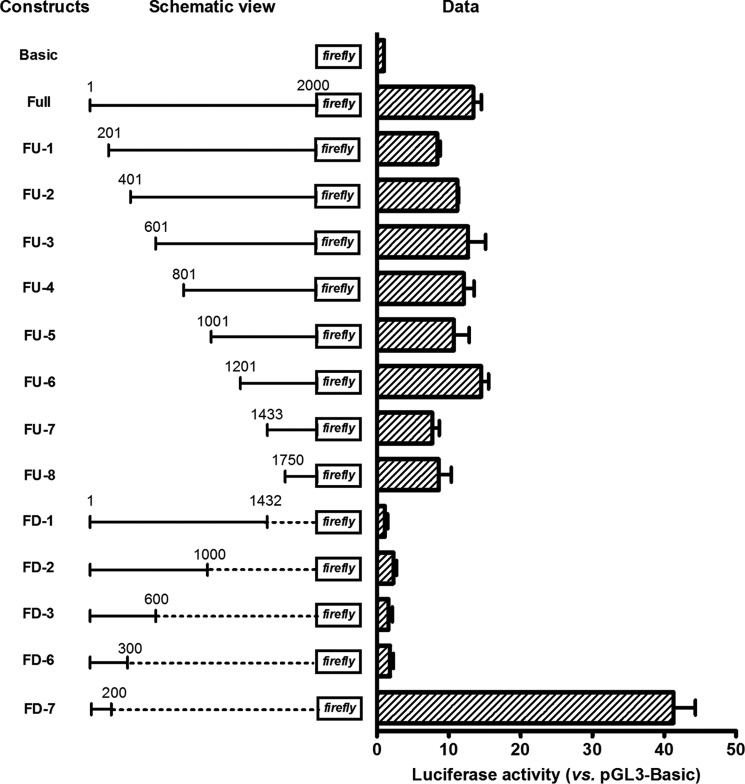
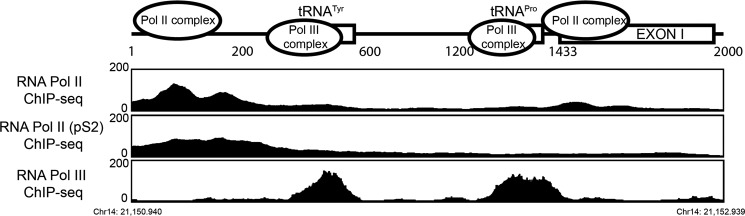
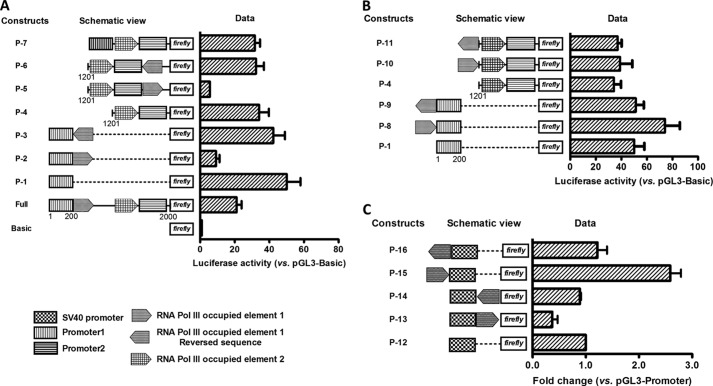
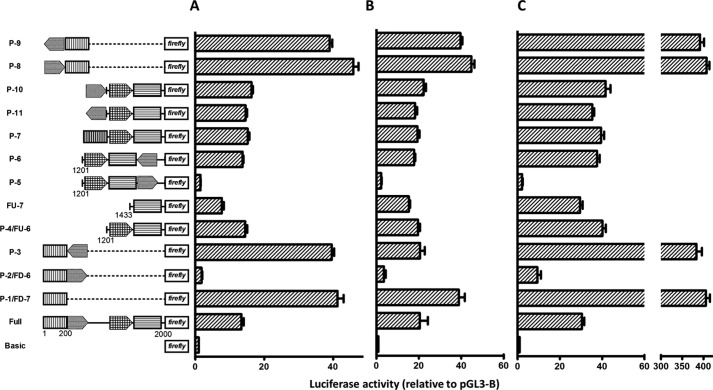
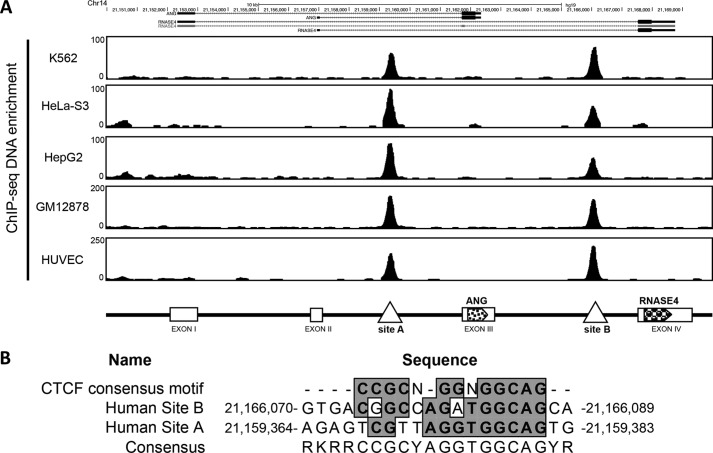
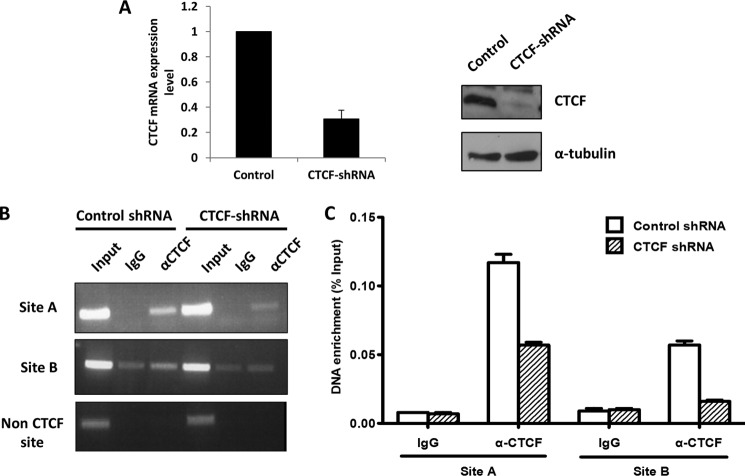
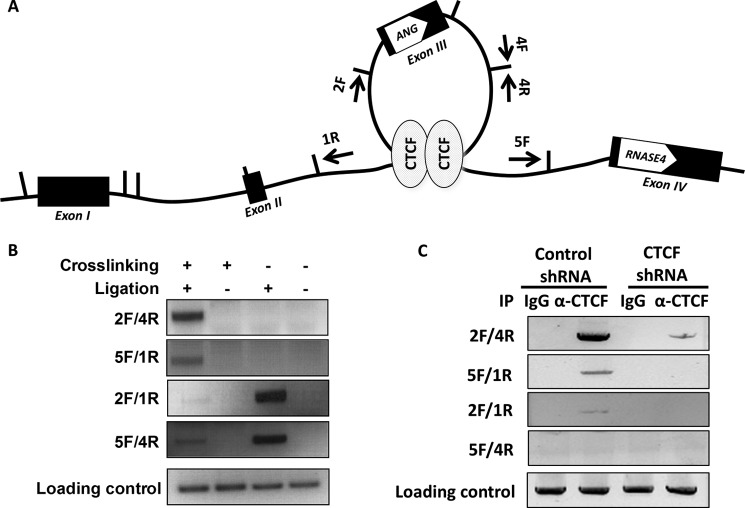
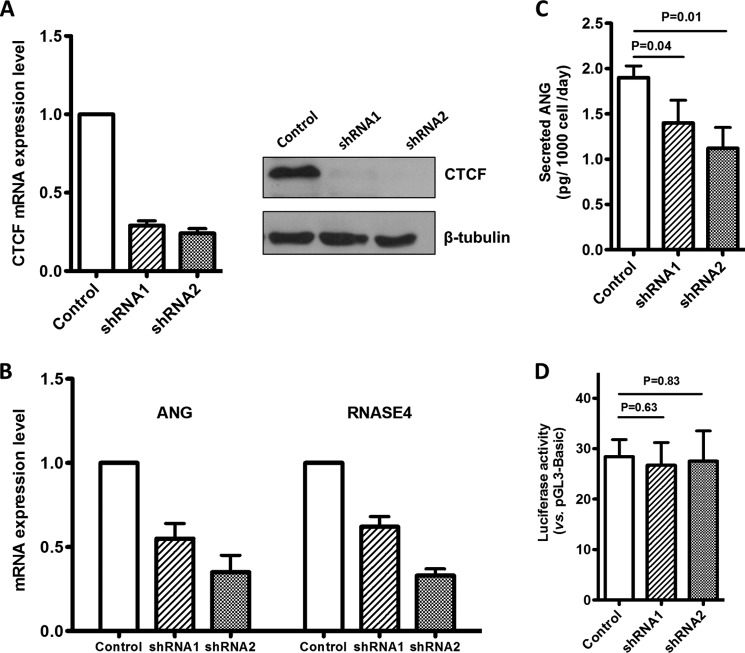
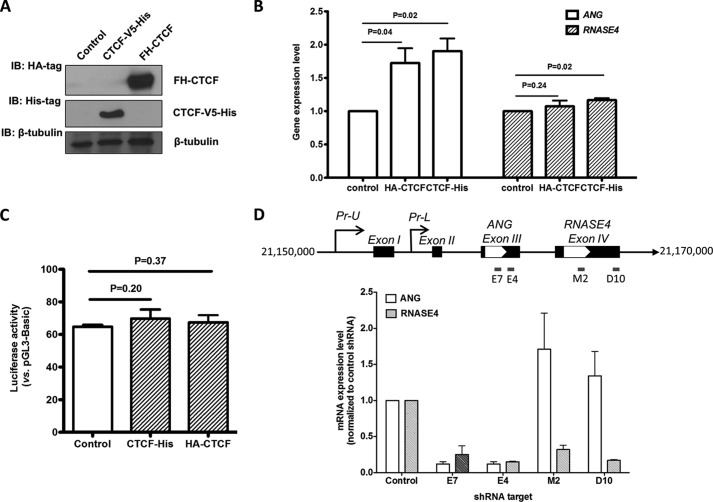
Angiogenin (ANG) and ribonuclease 4 (RNASE4), two members of the secreted and vertebrate-specific ribonuclease superfamily, play important roles in cancers and neurodegenerative diseases. The ANG and RNASE4 genes share genetic regions with promoter activities, but the structure and regulation of these putative promotes are unknown. We have characterized the promoter regions, defined the transcription start site, and identified a mechanism of transcription regulation that involves both RNA polymerase III (Pol III) elements and CCCTC binding factor (CTCF) sites. We found that two Pol III elements within the promoter region influence ANG and RNASE4 expression in a position- and orientation-dependent manner. We also provide evidence for the presence of an intragenic chromatin loop between the two CTCF binding sites located in two introns flanking the ANG coding exon. We found that formation of this intragenic loop preferentially enhances ANG transcription. These results suggest a multilayer transcriptional regulation of ANG and RNASE4 gene locus. These data also add more direct evidence to the notion that Pol III elements are able to directly influence Pol II gene transcription. Furthermore, our data indicate that a CTCF-dependent chromatin loop is able to differentially regulate transcription of genes that share the same promoters.

Keywords: Angiogenin; Chromatin; Promoters; RNA Polymerase; Ribonuclease; Rinonuclease 4; Transcription.


Figures

FIGURE 1.
FIGURE 1.
Bioinformatics analyses of ANG and RNASE4 gene locus. A, chromatin state annotation of ANG and RNASE4 gene locus. A common set of chromatin state annotation across nine cell types were computed by integrating ChIP-seq data from nine factors (CTCF, H3K27ac, H3K27me3, H3K36me3, H3K4me1, H3K4me2, H3K4me3, H3K9ac, H4K20me1). Active promoter was colored with red, and two insulators were colored with blue. CNV, copy number variation. B, bioinformatics analysis of the transcription start site. The Genomatix software suite was used to identify CAGE tags in the entire region of the gene locus from three databases, DBTSS, FANTOM3, and FANTOM4. x axis, positions of the ANG and RNASE4 promoter region on chromosome 14. y axis, total numbers of CAGE tags identified in different tissues for each particular start site. The most common start site in the cluster is position 21,152,776. The red squares mark the position of active promoter regions. The diagram at the bottom is a linear presentation of the two promoters (Pr-U and Pr-L) and the two exons (Exon 1 and 2).
FIGURE 2.
FIGURE 2.
Characterization of human ANG and RNASE4 promoters. A, activity of Pr-U and Pr-L in driving luciferase reporter gene expression in various cell lines. Data shown are the means ± S.D. of six independent experiments. B, luciferase reporter activity of serial deletion mutants of Pr-U. The left panel is the schematic views of the deletion constructs. The bar graphs at the right are luciferase activities of these constructs normalized to pGL3-B control plasmid. Data shown are the means ± S.D. of four independent experiments. C, promoter activity of internal sections of Pr-U in luciferase reporter assay. The five fragments with positions as marked were cloned into pGL3-B, and the promoter activities in driving luciferase reporter gene expression were measured in DU145 cells. Data shown are the means ± S.D. of four independent experiments.
FIGURE 3.
FIGURE 3.
Luciferase reporter activity of serial deletion mutants of Pr-U in PC-3 cells. Luciferase activities of various constructs were measured by a dual luciferase reporter system with Renilla luciferase as internal control. Data shown are means ± S.D. of three independent experiments.
FIGURE 4.
FIGURE 4.
Bioinformatics analyses of Pol II and RNA Pol III occupancy on promoter-U from the ChIP-seq data released by the ENCODE project. The top panel is a schematic view of ANG and RNASE4 promoter-U region with Pol II and Pol III binding complex noted. The bottom panels are the enrichment of Pol II, Pol II phosphoS2 (large subunit-specific for phosphorylated C-terminal domain), and Pol III in this region.
FIGURE 5.
FIGURE 5.
Effect of Pol III-occupied elements on Pol II gene transcription. A, inhibitory activity of the Pol III element when positioned in forward orientation downstream of Pol II promoter. The tRNATyr and tRNAPro elements identified within Pr-U were cloned to various positions in both forward and reverse orientations as indicated. The luciferase activity was measured in DU145 cells. B, enhancive activity of Pol III elements when positioned in forward orientation at upstream of Pol II promoter. The tRNATyr element was cloned upstream of Pr-1 or Pr-2 as indicated, and reporter activity was measured as described above in A. C, effect of Pol III element on SV40 promoter activity. The tRNATyr element was cloned in to the pGL3-P constructs upstream or downstream of SV40 promoter in either forward or reverse orientation. The reporter activities of these constructs were measured by the dual luciferase system and normalized to pGL3-P. Data shown are the means ± S.D. of three independent experiments.
FIGURE 6.
FIGURE 6.
Effect of Pol III elements on reporter activities of Pr-1 and Pr-2. Pol III elements were inserted upstream or downstream of Pr-1 or Pr-2, and the reporter activities of each construct were examined by a dual luciferase reporter system in PC-3 (A), 293T (B), and U87MG (C) cells. Data shown are the means ± S.D. of three independent experiments.
FIGURE 7.
FIGURE 7.
Identification of CTCF binding sites in ANG and RNASE4 gene locus. A, bioinformatics analyses of CTCF occupancy in five cell lines from the ChIP-seq data released by the ENCODE project. The top panel shows the enrichment of CTCF in the two introns flanking the ANG coding exon. The bottom panel is a schematic view of CTCF binding sites in this gene locus. B, consensus CTCF binding motif identified in the two CTCF binding sites.
FIGURE 8.
FIGURE 8.
Binding of CTCF at site A and site B in the two introns flanking ANG coding exon. A, CTCF was knocked down by lentivirus-mediated shRNA in DU-145 cells, and a stable line was selected. Left panel, qRT-PCR analysis of mRNA level of CTCF in control and knockdown cell. Right panels, Western blot analysis of CTCF protein level. B and C, ChIP-PCR analyses of CTCF binding to site A and site B. Cells were treated with formaldehyde and immunoprecipitated with control or CTCF-specific antibodies. The precipitated DNA fragments was examined by regular PCR (B) or quantitative PCR (C) with primers specific to site A and site B.
FIGURE 9.
FIGURE 9.
Formation of a CTCF-dependent intragenic chromatin loop. A, schematic view of a chromatin loop between the two introns flanking ANG coding exon. The arrows indicate the primers used in 3C experiment. B, chromatin loop formation shown by 3C assay. Transient chromatin interactions are stabilized by formaldehyde cross-linking followed by extraction and digestion with restriction enzyme StuI. DNA fragments were then ligated and amplified by PCR with the primer sets indicated in A. The loading control was derived from DNA sample before 3C with the primers amplifying the ANG coding region. C, ChIP-3C experiments. 3C and PCR amplifications were performed using control IgG and CTCF-specific IgG immunoprecipitated (IP) chromatin in both control and CTCF knockdown cells.
FIGURE 10.
FIGURE 10.
Effect of CTCF knockdown on ANG and RNASE4 transcription. A, CTCF was knocked down by lentivirus-mediated shRNA in DU-145 cells, and stable knockdown cell lines were established after selection with 1 μg/ml puromycin for 7 days. Left panel, qRT-PCR analyses of CTCF mRNA level in control and shRNA transfected cell lines. CTCF mRNA level was normalized to that of β-actin. Right panels, Western blot analyses of CTCF protein level. B, qRT-PCR analyses of the mRNA levels of ANG and RNASE4 in the three stable cells lines. C, ELISA analyses of secreted ANG protein from the stable control and CTCF knockdown cell lines. D, luciferase reporter activity of the full-length Pr-U in the above three stable cell lines. Bar graphs in all panels represent the means ± S.D. of three independent experiments.
FIGURE 11.
FIGURE 11.
Effect of CTCF overexpression on ANG and RNASE4 expression. A, overexpression of CTCF with V5-His tag or FLAG-HA tag in cells. The V5-His tag was fused to the C terminus of the CTCF, whereas the FLAG-HA was fused to the N terminus of the gene. The vectors were transfected to DU145 cells, and the cell lysates were analyzed for transgene expression by Western blot (IB) with antibodies specific to HA or His. B, qRT-PCR analyses of ANG and RNASE4 mRNA level in CTCF-overexpressing cells. The mRNA level was first normalized to that of β-actin and then to control cell lines. The relative values to control cell line were shown. C, luciferase reporter activity of the full-length Pr-U construct in CTCF-overexpressing cell lines. The luciferase reporter construct was co-transfected with CTCF expression vector, and the luciferase activity was measured 48 h post transfection. D, effect of ANG and RNASE4 shRNA on gene expression of the ANG and RNASE4 locus. DU145 cells were infected by lentivirus particles encoding shRNA specific to ANG (E7 and E4) and RNASE4 (M2 and D10) as indicated in the top panel. Stable cells lines were selected by 1 μg/ml puromycin for 7 days. mRNA levels of ANG and RNASE4 were determined by qRT-PCR. mRNA levels were normalized to β-actin in the same sample. Data shown in the bar graphs in all panels are the means ± S.D. of three independent experiments.

Similar articles

Cited by

References

    1. Riordan J. F. (2001) Angiogenin. Methods Enzymol. 341, 263–273 - PubMed
    1. Subramanian V., Feng Y. (2007) A new role for angiogenin in neurite growth and pathfinding: implications for amyotrophic lateral sclerosis. Hum. Mol. Genet 16, 1445–1453 - PubMed
    1. Li S., Hu G. F. (2010) Angiogenin-mediated rRNA transcription in cancer and neurodegeneration. Int. J. Biochem. Mol. Biol. 1, 26–35 - PMC - PubMed
    1. Tello-Montoliu A., Patel J. V., Lip G. Y. (2006) Angiogenin: a review of the pathophysiology and potential clinical applications. J. Thromb. Haemost. 4, 1864–1874 - PubMed
    1. Yoshioka N., Wang L., Kishimoto K., Tsuji T., Hu G. F. (2006) A therapeutic target for prostate cancer based on angiogenin-stimulated angiogenesis and cancer cell proliferation. Proc. Natl. Acad. Sci. U.S.A. 103, 14519–14524 - PMC - PubMed

Publication types

MeSH terms