Review
. 2014 Feb;35(1):3-14.

Physiology and its importance for reference intervals

Affiliations
Review

Physiology and its importance for reference intervals

Kenneth A Sikaris. Clin Biochem Rev. 2014 Feb.

Abstract

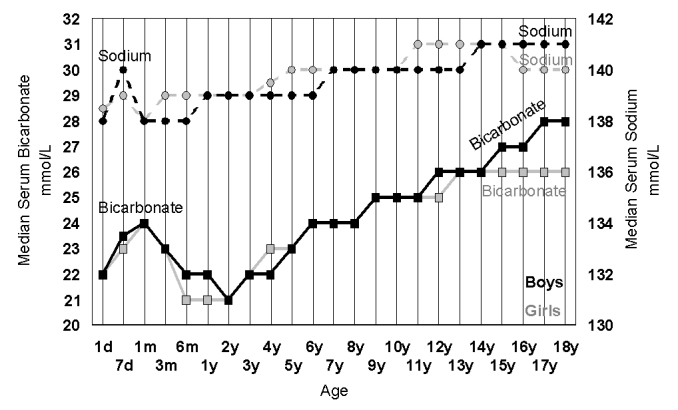
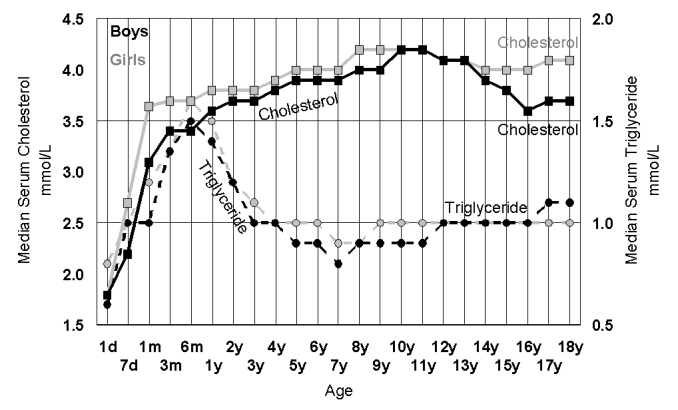
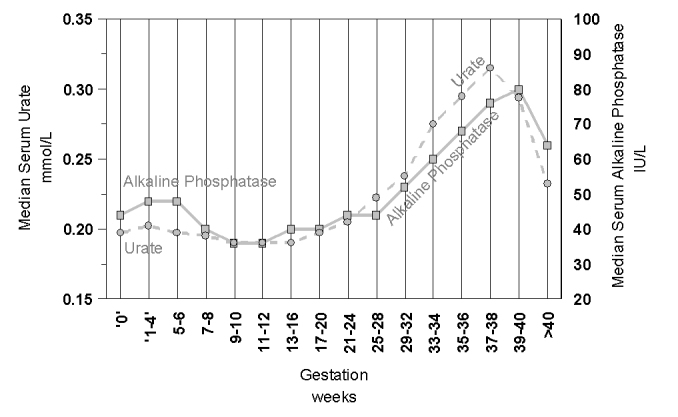
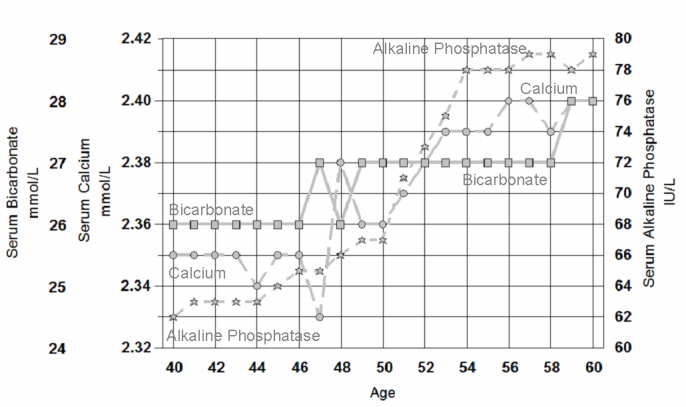
Reference intervals are ideally defined on apparently healthy individuals and should be distinguished from clinical decision limits that are derived from known diseased patients. Knowledge of physiological changes is a prerequisite for understanding and developing reference intervals. Reference intervals may differ for various subpopulations because of differences in their physiology, most obviously between men and women, but also in childhood, pregnancy and the elderly. Changes in laboratory measurements may be due to various physiological factors starting at birth including weaning, the active toddler, immunological learning, puberty, pregnancy, menopause and ageing. The need to partition reference intervals is required when there are significant physiological changes that need to be recognised. It is important that laboratorians are aware of these changes otherwise reference intervals that attempt to cover a widened inter-individual variability may lose their usefulness. It is virtually impossible for any laboratory to directly develop reference intervals for each of the physiological changes that are currently known, however indirect techniques can be used to develop or validate reference intervals in some difficult situations such as those for children. Physiology describes our life's journey, and it is only when we are familiar with that journey that we can appreciate a pathological departure.


Figures

Figure 1.
Figure 1.
The increase in haemoglobin (squares, full line) and urate (circle, dotted lines) in girls (grey) and boys (black) between the ages of 10 and 18 years. For haemoglobin there were 45,939 girls and 33,361 boys and for urate there were 30,164 girls and 23,444 boys.
Figure 2.
Figure 2.
The changes in alkaline phosphatase plotted as the median value for each age group in 42,725 girls (grey) and 38,402 boys (black) derived from a laboratory population of predominantly outpatient children having a multiple biochemical analysis (screening) protocol.
Figure 3.
Figure 3.
The changes in serum calcium (cresolpthalien complexone) (squares, full line) and serum phosphate (circles, dotted lines) plotted as the median value for each age group in 42,725 girls (grey) and 38,402 boys (black) derived from a laboratory multiple biochemical analysis population of predominantly outpatient children.
Figure 4.
Figure 4.
The increase in median creatinine (Roche rate blanked modified Jaffe) (squares, full line) and median haemoglobin (circle, dotted lines) in girls (grey) and boys (black) between the ages of 10 and 18 years. For haemoglobin there were 62,971 girls and 48,289 boys and for urate there were 42,725 girls and 38,391 boys.
Figure 5.
Figure 5.
The increase in serum bicarbonate (squares, solid lines) and serum sodium (circles, dotted lines) in 42,725 girls (grey) and 38,391 boys (black) during childhood. The rise in childhood is related to the fall in respiratory rate across childhood and consequent increase in pCO2, the source of serum bicarbonate.
Figure 6.
Figure 6.
The increase in median values for random serum cholesterol (squares, solid lines) triglycerides (circles, dotted lines) in 42,725 girls (grey) and 38,391 boys (black) during childhood. While both cholesterol and triglyceride rise in infancy, cholesterol stays high while triglycerides fall back by age 3.
Figure 7.
Figure 7.
The changes in serum globulin (biuret protein – BCG albumin) (squares, solid line), neutrophil count (circles, dotted lines) and lymphocyte counts (stars, dashed line) in girls (grey) and boys (black) during childhood. For serum globulin there were 42,275 girls and 38,391 boys and for neutrophil and lymphocyte count there were 62,971 girls and 48,289 boys.
Figure 8.
Figure 8.
The changes in serum urate (squares, solid line) and alkaline phosphatase (circles, dotted line) in 30,321 pregnant women of varying gestational age.
Figure 9.
Figure 9.
The changes in median serum bicarbonate (squares, solid line), median serum calcium (cresolpthalein complexone) (circles, dashed line) and median serum alkaline phosphatase (stars, dotted lines) in 74,032 women from 40 to 60 years of age.

References

    1. Lindstedt G, Tryding N. [There is difference between decision limits and reference intervals. Reference intervals are based on measurements in healthy individuals, decision limits on measurements in patients] Lakartidningen. 2007;104:2076–9. - PubMed
    1. Sikaris K. Application of the stockholm hierarchy to defining the quality of reference intervals and clinical decision limits. Clin Biochem Rev. 2012;33:141–8. - PMC - PubMed
    1. Petersen PH, Jensen EA, Brandslund I. Analytical performance, reference values and decision limits. A need to differentiate between reference intervals and decision limits and to define analytical quality specifications. Clin Chem Lab Med. 2012;50:819–31. - PubMed
    1. Boyd JC. Defining laboratory reference values and decision limits: populations, intervals, and interpretations. Asian J Androl. 2010;12:83–90. - PMC - PubMed
    1. Ceriotti F, Henny J. Are my laboratory results normal? Considerations to be made concerning reference intervals and decision limits. eJIFCC. 2008;19:1–9. - PMC - PubMed

LinkOut - more resources