Review
. 2014 Mar 13:6:32.
doi: 10.3389/fnagi.2014.00032. eCollection 2014.

Imaging of cerebrovascular pathology in animal models of Alzheimer's disease

Affiliations
Review

Imaging of cerebrovascular pathology in animal models of Alzheimer's disease

Jan Klohs et al. Front Aging Neurosci. .

Abstract

In Alzheimer's disease (AD), vascular pathology may interact with neurodegeneration and thus aggravate cognitive decline. As the relationship between these two processes is poorly understood, research has been increasingly focused on understanding the link between cerebrovascular alterations and AD. This has at last been spurred by the engineering of transgenic animals, which display pathological features of AD and develop cerebral amyloid angiopathy to various degrees. Transgenic models are versatile for investigating the role of amyloid deposition and vascular dysfunction, and for evaluating novel therapeutic concepts. In addition, research has benefited from the development of novel imaging techniques, which are capable of characterizing vascular pathology in vivo. They provide vascular structural read-outs and have the ability to assess the functional consequences of vascular dysfunction as well as to visualize and monitor the molecular processes underlying these pathological alterations. This article focusses on recent in vivo small animal imaging studies addressing vascular aspects related to AD. With the technical advances of imaging modalities such as magnetic resonance, nuclear and microscopic imaging, molecular, functional and structural information related to vascular pathology can now be visualized in vivo in small rodents. Imaging vascular and parenchymal amyloid-β (Aβ) deposition as well as Aβ transport pathways have been shown to be useful to characterize their dynamics and to elucidate their role in the development of cerebral amyloid angiopathy and AD. Structural and functional imaging read-outs have been employed to describe the deleterious affects of Aβ on vessel morphology, hemodynamics and vascular integrity. More recent imaging studies have also addressed how inflammatory processes partake in the pathogenesis of the disease. Moreover, imaging can be pivotal in the search for novel therapies targeting the vasculature.

Keywords: Alzheimer's disease (AD); amyloid-beta (Aβ); angiography; cerebral amyloid angiopathy (CAA); cerebral blood flow (CBF); magnetic resonance imaging (MRI); microscopy; transgenic mice.


Figures

Figure 1
Figure 1
Phenotypic characterization of cerebrovascular structures at various length scales. Time-of-flight magnetic resonance angiography can depict large vessels (≥100μm), contrast-enhanced magnetic resonance angiography can depict medium sized vessels (≥50μm) and two-photon microscopy can visualize microvessels (≥0.25μm).
Figure 2
Figure 2
In vivo live imaging of CAA amyloid deposits through cranial window. Closed cranial windows were prepared on the right parietal bone of 16-month-old Tg2576 mice and the congophilic amyloid binding dye, methoxy-X04 (X04), was administered (6 mg/kg i.p.). On the next day, 2 μM resorufin (dissolved in artificial CSF) was superfused over the brain through a closed cranial window for 5 min. After washing with artificial CSF for 10 min, live fluorescent images of resorufin (red) and X04 (blue) were taken. (A) Intense fluorescent labeling detected within the walls of the leptomeningeal arteries (arrowheads) but not in neuritic plaques after topical application of resorufin. (B) In contrast, topical application of methoxy-X04 labeled Aβ aggregates in both cerebral arteries (arrowheads) and parenchymal neuritic plaques (arrows). (C) Resorufin- and X04-images merged. (D) Magnified detail of (C). Scale bars: 100 μm. Reproduced with permission from Han et al. (2011), © 2011 Han et al.
Figure 3
Figure 3
Targeting specific of Aβ with PET compatible radiolabelled antibodies in the brains of living mice. (A) Antibodies offer an opportunity to image specific types of Aβ pathology because of their excellent specificity. In the TgCRND8 mouse model of AD, two antibodies, M64 and M116, that target parenchyma aggregated Aβ plaques and one antibody, M31, that targets vascular Aβ were tested. All three antibodies were administered i.v. after labeling with both poly(ethylene glycol) (PEG) to enhance circulation and 64Cu to allow PET detection. (B) Quantitation of PET images (% of injected dose per gram tissue) in the brain 5 min, 2 h, and 4 h after i.v. of the probes: M116 showed progressive accumulation of M116 in the TgCRND8 brain vs. a lower, constant amount in the wild-type brain; M64 showed no difference in accumulation between TgCRND8 and wild-type mice at any time point; M31 showed greater accumulation in TgCRND8 mice than wild-type, but at a constant amount. Modified with permission from McLean et al. (2013), © 2013 American Chemical Society.
Figure 4
Figure 4
Absence of Abcg2 allows more A β peptides to be transported into the brain. (A) Two pairs of Abcg2 knockout mice were injected i.v. Cy5.5-free dye or Cy5.5-labeled Aβ1 − 40 peptides in equal fluorescence intensity. Animals were scanned alive using a NIRF imager at 15 min and 2 h. (B) NIRF scans of ex vivo brains collected at the end of the experiment. Signal intensity was significantly higher in the brains of Abcg knockout mice injected with Cy5.5-labeled Aβ peptides compared with Cy5.5 free dye (t-test, p < 0.001). This demonstrates that Cy5.5 was brought into the brain as a form of Cy5.5-labeled Aβ1 − 40 peptide, indicating that Abcg2 is required at the BBB to prevent the entry into the brain of circulating Aβ peptides. Modified with permission from Xiong et al. (2009), © 2009 Society for Neuroscience.
Figure 5
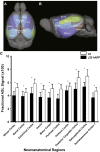
Figure 5
Hypoperfusion in 3-month-old J20 hAPP mice modeling AD. Superior (A) and lateral (B) views of the cortical surface atlas with 14 regions-of-interest labels derived from high resolution 3D MRI data sets. (C) ASL perfusion MRI measurements from representative regions-of-interest in young transgenic and age-matched wild-type mice. Note that the whole cortex and most regions demonstrated significantly lower perfusion (*p < 0.05) in J20 hAPP compared with wild-type animals. Modified with permission from Hébert et al. (2013), © 2013 Elsevier Inc.
Figure 6
Figure 6
Vascular response to acetazolamide decreased as a function of age in the arcA β mouse model of cerebral amyloidosis, exemplified in color-coded MRI-derived CBV maps. Images for a representative age-matched wild-type control littermate and an arcAβ mouse of each age group. Histological sections stained for Aβ amyloid deposition as well as anatomical MR reference images are displayed in the two top rows. Histology reveals Aβ deposition in 16- and 23-month-old but not 3-month-old arcAβ mice, while none of the wild-type animals displayed any amyloid pathology. The color-coded CBV maps superimposed on the anatomical scans represent baseline ΔCBV% values, early changes in ΔCBV% and maximum ΔCBV% values (ΔCBV%, max). The early ΔCBV% response in arcAβ mice decreased significantly as a function of age as compared to age-matched wild-type mice. Similarly ΔCBV%, max significantly decreased in arcAβ mice as a function of age. In 3-month-old animals no difference between wild-type and arcAβ mice has been found in either parameter. The scale bar represents 2 mm. Reproduced with permission from Princz-Kranz et al. (2010), © 2010 Elsevier Inc.
Figure 7
Figure 7
MR angiography of transgenic mice modeling AD. (A,B) MR angiograms of 18-month-old Tg2576 mice collected at 17.6 T showing various levels of severities of morphological changes appointed in 3D maximum intensity projection. The number indicates the appointed score to the level of severity of alterations. For example: 1, a flow disturbance (as seen in anterior communicating artery in image A); 2, a small signal void (as observed at the origin of anterior communicating artery in image B); 3, more than two small voids in same artery (as observed on the middle cerebral artery (MCA) on both sides in image B); 4, an extended void (as observed in the external carotid artery on both sides in image A); 5, a combination of an extended void and several small signal voids (as observed in the external carotid artery on both sides in image B); 6, the signal is no longer visible (as shown at the pterygo portion of the pterygopalatine artery in image A,B). The enlarge view of alterations is shown in (C). (D) MCA alteration mean score in control and Tg2576 mice with age. Values are mean ± SE (error bars); one-tail student t-test; *P < 0.05; n = 4. Reproduced with permission from Kara et al. (2012), © 2011 Elsevier Inc.
Figure 8
Figure 8
MRI detection of CAA-related microvascular alterations utilizing superparamagnetic iron oxide (SPIO) particles. Histological examination of cerebral cortex sites with foci of attenuated MRI signal (α, β, γ). At 24 h following SPIO administration, a male 28-month-old APP23 mouse was analyzed in vivo by MRI and processed for histology immediately thereafter. Perls/Prussian blue staining showed iron-loaded macrophages in CAA-laden vessels (Congo red positive) at both sites (α and β). While the vessel walls were thickened at both α and β locations, only site β showed in addition vasculitis characterized by lymphocyte infiltration (Hematoxylin eosin). At site γ, isolated iron-loaded macrophages were present close to amyloid vessels. 1, Iron in isolated macrophages; 2, iron in macrophages at the vessel wall; 3, amyloid deposit in vessel wall; 4, vasculitis; P, amyloid plaque. Scale bars, 50 μm. Congo red-stained sections were observed under bright field or polarized light. Reproduced from Beckmann et al. (2011), © 2011 the authors.
Figure 9
Figure 9
Detection of CMBs using quantitative susceptibility mapping MRI. (A) Horizontal quantitative susceptibility maps of an 18-month-old wild type animal and of an age-matched transgenic arcAβ mouse. (B) Quantitative susceptibility maps with corresponding tissue section after Prussian blue/eosin staining and anti-Aβ immunohistochemistry. Focal areas of high susceptibility in the cortex of 18-month old arcAβ mice correspond to areas of focal iron accumulation, indicating the occurrence of cerebral microbleeds in this mouse strain. Modified from Klohs et al. (2011), © 2011 ISCBFM.
Figure 10
Figure 10
Segmentation of cortical penetrating vessels overlaid on maximum intensity projections of cortical microvasculature obtained from in vivo two-photon fluorescence microscopy images of the cortical microcirculation of 6.5–12-month-old mice: parallel to cortical surface (top row) and perpendicular to cortical surface (bottom row). Penetrating vessels for each individual mouse are highlighted. Average tortuosity of penetrating vessels for each sample subject (mean ± standard error): wild-type mice 1.03 ± 0.003, transgenic TgCRND8 mice 1.10 ± 0.006, scyllo-inositol-treated TgCRND8 mice 1.03 ± 0.005. Reproduced with permission from Dorr et al. (2012), © 2012 the authors.
Figure 11
Figure 11
Rapid microglial response around amyloid pathology after systemic anti-Aβ antibody administration in PDAPP mice. Peripheral m3D6 administration results in marked morphological changes in microglia. Three-dimensional reconstructed z-series stack two-photon microscopy images taken of 22-month-old PDAPP±;CX3CR1/green fluorescent protein± mice injected with 500 μ g of m3D6 (A–C), an anti-Aβ antibody, or not injected (D–F). Green fluorescent protein-labeled microglia are green. Fibrillar amyloid was labeled with methoxy-XO4 (blue). Scale bar, 20 μm. Reproduced with permission from Koenigsknecht-Talboo et al. (2008), © 2008 Society for Neuroscience.

Similar articles

Cited by

References

    1. Aalto K., Autio A., Kiss E. A., Elima K., Nymalm Y., Veres T. Z., et al. (2011). Siglec-9 is a novel leukocyte ligand for vascular adhesion protein-1 and can be used in PET imaging of inflammation and cancer. Blood 118, 3725–3733 10.1182/blood-2010-09-311076 - DOI - PMC - PubMed
    1. Acarin L., Vela J. M., González B., Castellano B. (1994). Demonstration of poly-N-acetyl lactosamine residues in ameboid and ramified microglial cells in rat brain by tomato lectin binding. J. Histochem. Cytochem. 42, 1033–1041 10.1177/42.8.8027523 - DOI - PubMed
    1. Allen B., Ingram E., Takao M., Smith M. J., Jakes R., Virdee K., et al. (2002). Abundant tau filaments and nonapoptotic neurodegeneration in transgenic mice expressing human P301S tau protein. J. Neurosci. 22, 9340–9351 - PMC - PubMed
    1. Alsop D. C., Dai W., Grossman M., Detre J. A. (2010). Arterial spin labeling blood flow MRI: its role in the early characterization of Alzheimer's disease. J. Alzheimer Dis. 20, 871–880 10.3233/JAD-2010-091699 - DOI - PMC - PubMed
    1. Anderson C. M., Nedergaard M. (2003). Astrocyte-mediated control of cerebral microcirculation. Trends Neurosci. 26, 340–344 10.1016/S0166-2236(03)00141-3 - DOI - PubMed