Protein comparability assessments and potential applicability of high throughput biophysical methods and data visualization tools to compare physical stability profiles
- PMID: 24659968
- PMCID: PMC3950620
- DOI: 10.3389/fphar.2014.00039
Protein comparability assessments and potential applicability of high throughput biophysical methods and data visualization tools to compare physical stability profiles
Abstract
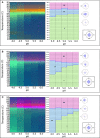
In this review, some of the challenges and opportunities encountered during protein comparability assessments are summarized with an emphasis on developing new analytical approaches to better monitor higher-order protein structures. Several case studies are presented using high throughput biophysical methods to collect protein physical stability data as function of temperature, agitation, ionic strength and/or solution pH. These large data sets were then used to construct empirical phase diagrams (EPDs), radar charts, and comparative signature diagrams (CSDs) for data visualization and structural comparisons between the different proteins. Protein samples with different sizes, post-translational modifications, and inherent stability are presented: acidic fibroblast growth factor (FGF-1) mutants, different glycoforms of an IgG1 mAb prepared by deglycosylation, as well as comparisons of different formulations of an IgG1 mAb and granulocyte colony stimulating factor (GCSF). Using this approach, differences in structural integrity and conformational stability profiles were detected under stress conditions that could not be resolved by using the same techniques under ambient conditions (i.e., no stress). Thus, an evaluation of conformational stability differences may serve as an effective surrogate to monitor differences in higher-order structure between protein samples. These case studies are discussed in the context of potential utility in protein comparability studies.
Keywords: biophysical; comparability; formulation; high throughput; monoclonal antibodies; protein; stability.
Figures


Similar articles
-
High-throughput biophysical analysis and data visualization of conformational stability of an IgG1 monoclonal antibody after deglycosylation.J Pharm Sci. 2013 Nov;102(11):3942-56. doi: 10.1002/jps.23730. Epub 2013 Sep 24. J Pharm Sci. 2013. PMID: 24114789 Free PMC article.
-
Physical stability comparisons of IgG1-Fc variants: effects of N-glycosylation site occupancy and Asp/Gln residues at site Asn 297.J Pharm Sci. 2014 Jun;103(6):1613-1627. doi: 10.1002/jps.23975. Epub 2014 Apr 16. J Pharm Sci. 2014. PMID: 24740840 Free PMC article.
-
Improved Comparative Signature Diagrams to Evaluate Similarity of Storage Stability Profiles of Different IgG1 mAbs.J Pharm Sci. 2016 Mar;105(3):1028-35. doi: 10.1016/j.xphs.2016.01.008. Epub 2016 Feb 9. J Pharm Sci. 2016. PMID: 26886311
-
High-throughput biophysical analysis of protein therapeutics to examine interrelationships between aggregate formation and conformational stability.AAPS J. 2014 Jan;16(1):48-64. doi: 10.1208/s12248-013-9539-6. Epub 2013 Oct 31. AAPS J. 2014. PMID: 24174400 Free PMC article. Review.
-
Multidimensional methods for the formulation of biopharmaceuticals and vaccines.J Pharm Sci. 2011 Oct;100(10):4171-97. doi: 10.1002/jps.22618. Epub 2011 Jun 6. J Pharm Sci. 2011. PMID: 21647886 Free PMC article. Review.
Cited by
-
Developability Assessment of Physicochemical Properties and Stability Profiles of HIV-1 BG505 SOSIP.664 and BG505 SOSIP.v4.1-GT1.1 gp140 Envelope Glycoprotein Trimers as Candidate Vaccine Antigens.J Pharm Sci. 2019 Jul;108(7):2264-2277. doi: 10.1016/j.xphs.2019.01.033. Epub 2019 Feb 15. J Pharm Sci. 2019. PMID: 30776383 Free PMC article.
-
Impact of Glycosylation on the Local Backbone Flexibility of Well-Defined IgG1-Fc Glycoforms Using Hydrogen Exchange-Mass Spectrometry.J Pharm Sci. 2018 Sep;107(9):2315-2324. doi: 10.1016/j.xphs.2018.04.026. Epub 2018 May 8. J Pharm Sci. 2018. PMID: 29751008 Free PMC article.
-
Assessment of structural and functional similarity of biosimilar products: Rituximab as a case study.MAbs. 2018 Jan;10(1):143-158. doi: 10.1080/19420862.2017.1402996. Epub 2017 Dec 7. MAbs. 2018. PMID: 29200314 Free PMC article.
-
Preformulation Characterization and Stability Assessments of Secretory IgA Monoclonal Antibodies as Potential Candidates for Passive Immunization by Oral Administration.J Pharm Sci. 2020 Jan;109(1):407-421. doi: 10.1016/j.xphs.2019.07.018. Epub 2019 Jul 29. J Pharm Sci. 2020. PMID: 31369743 Free PMC article.
-
Characterization of the structural forces governing the reversibility of the thermal unfolding of the human acidic fibroblast growth factor.Sci Rep. 2021 Aug 2;11(1):15579. doi: 10.1038/s41598-021-95050-2. Sci Rep. 2021. PMID: 34341408 Free PMC article.
References
-
- Alsenaidy M. A., Kim J. H., Majumdar R., Weis D. D., Joshi S. B., Tolbert T. J., et al. (2013). High-throughput biophysical analysis and data visualization of conformational stability of an IgG1 monoclonal antibody after deglycosylation. J. Pharm. Sci. 102, 3942–3956 10.1002/jps.23730 - DOI - PMC - PubMed
-
- Alsenaidy M. A., Wang T., Kim J. H., Joshi S. B., Lee J., Blaber M., et al. (2012). An empirical phase diagram approach to investigate conformational stability of “second-generation” functional mutants of acidic fibroblast growth factor-1. Protein Sci. 21, 418–432 10.1002/pro.2008 - DOI - PMC - PubMed
Publication types
LinkOut - more resources
Full Text Sources
Other Literature Sources

