Review
. 2014 Apr;271(1):6-27.
doi: 10.1148/radiol.14122524.

State of the art: Response assessment in lung cancer in the era of genomic medicine

Affiliations
Review

State of the art: Response assessment in lung cancer in the era of genomic medicine

Mizuki Nishino et al. Radiology. 2014 Apr.

Abstract

Tumor response assessment has been a foundation for advances in cancer therapy. Recent discoveries of effective targeted therapy for specific genomic abnormalities in lung cancer and their clinical application have brought revolutionary advances in lung cancer therapy and transformed the oncologist's approach to patients with lung cancer. Because imaging is a major method of response assessment in lung cancer both in clinical trials and practice, radiologists must understand the genomic alterations in lung cancer and the rapidly evolving therapeutic approaches to effectively communicate with oncology colleagues and maintain the key role in lung cancer care. This article describes the origin and importance of tumor response assessment, presents the recent genomic discoveries in lung cancer and therapies directed against these genomic changes, and describes how these discoveries affect the radiology community. The authors then summarize the conventional Response Evaluation Criteria in Solid Tumors and World Health Organization guidelines, which continue to be the major determinants of trial endpoints, and describe their limitations particularly in an era of genomic-based therapy. More advanced imaging techniques for lung cancer response assessment are presented, including computed tomography tumor volume and perfusion, dynamic contrast material-enhanced and diffusion-weighted magnetic resonance imaging, and positron emission tomography with fluorine 18 fluorodeoxyglucose and novel tracers. State-of-art knowledge of lung cancer biology, treatment, and imaging will help the radiology community to remain effective contributors to the personalized care of lung cancer patients.


Figures

Figure 1:
Figure 1:
EGFR is a transmembranous receptor tyrosine kinase. EGFR signaling pathways regulate important tumorgenic processes. Akt = V-akt murine thymoma viral oncogene homolog, EGF = epidermal growth factor, MAPK = mitogen-activated protein kinase, mTOR = mammalian target of rapamycin, PI3K = phosphatidylinositol 3-kinase, PTEN = phosphatase and tensin homolog, Raf = rapidly accelerated fibrosarcoma, Ras = rat sarcoma, STAT = signal transducer and activator of transcription, TGF-a, transforming growth factor α.
Figure 2a:
Figure 2a:
Dramatic radiographic response to erlotinib in a 55-year-old man with stage IV adenocarcinoma of the lung harboring exon 19 deletion of EGFR. (a) Contrast-enhanced CT scan of the chest before therapy demonstrates an irregular mass in the right middle lobe (arrow), with multiple metastatic nodules in both lungs. (b) Follow-up CT scan after 2 months of erlotinib therapy show near-complete resolution of the dominant mass with very faint residual opacities in the right middle lobe (arrow), representing a marked response to therapy. Bilateral metastatic nodules also decreased in size and number.
Figure 2b:
Figure 2b:
Dramatic radiographic response to erlotinib in a 55-year-old man with stage IV adenocarcinoma of the lung harboring exon 19 deletion of EGFR. (a) Contrast-enhanced CT scan of the chest before therapy demonstrates an irregular mass in the right middle lobe (arrow), with multiple metastatic nodules in both lungs. (b) Follow-up CT scan after 2 months of erlotinib therapy show near-complete resolution of the dominant mass with very faint residual opacities in the right middle lobe (arrow), representing a marked response to therapy. Bilateral metastatic nodules also decreased in size and number.
Figure 3:
Figure 3:
Genome-based approach to lung cancer. In the current era of genomic medicine, mutation testing of the tumor plays an important role in identifying the patients with targetable abnormalities with effective agents and optimizing therapeutic approach in advanced NSCLC. (The algorithm is based on National Comprehensive Cancer Network Clinical Practice Guidelines in Oncology, Non-Small Cell Lung Cancer, version 3.2012 [113]). * = If EGFR mutation is discovered prior to first-line chemotherapy, erlotinib is recommended. If EGFR mutation is discovered during first-line chemotherapy, switching to maintenance erlotinib or the addition of erlotinib to current chemotherapy is recommended (113). ALK = anaplastic lymphoma kinase, NOS = not otherwise specified.
Figure 4a:
Figure 4a:
Images in a 70-year-old woman with stage IV adenocarcinoma harboring EML4-ALK (anaplastic lymphoma kinase) translocation treated with ALK inhibitor crizotinib. (a) Coronal reformatted image from baseline chest CT demonstrates multiple nodules in the right lung (arrows) with nodular thickening of the right apical pleura (arrowheads), representing significant tumor burden. (b) The patient was treated with crizotinib. After 4 months of therapy, follow-up chest CT scan demonstrates marked decrease of the right lung nodules (arrows) and resolution of pleural tumor burden in the right apex (arrowheads).
Figure 4b:
Figure 4b:
Images in a 70-year-old woman with stage IV adenocarcinoma harboring EML4-ALK (anaplastic lymphoma kinase) translocation treated with ALK inhibitor crizotinib. (a) Coronal reformatted image from baseline chest CT demonstrates multiple nodules in the right lung (arrows) with nodular thickening of the right apical pleura (arrowheads), representing significant tumor burden. (b) The patient was treated with crizotinib. After 4 months of therapy, follow-up chest CT scan demonstrates marked decrease of the right lung nodules (arrows) and resolution of pleural tumor burden in the right apex (arrowheads).
Figure 5:
Figure 5:
Genomic subtypes of NSCLC. The pie chart represents the subdivisions of lung adenocarcinomas based on different driver mutations detected from the testing of 516 tumors (114,115). KRAS = V-Ki-ras2 Kirsten rat sarcoma viral oncogene homolog; EML4 = echinoderm microtubule-associated protein-like 4; ALK = anaplastic lymphoma kinase; BRAF = v-Raf murine sarcoma viral oncogene homolog B1; PI3KCA = phosphatidylinositol 3-kinase; HER2 = human epidermal growth factor receptor 2; MET = mesenchymal-epithelial transition factor; AMP = amplification; MEK1 = dual specificity mitogen-activated protein kinase kinase 1 (MAP2 K1); NRAS = neuroblastoma RAS viral (v-ras) oncogene homolog; AKT1 = V-akt murine thymoma viral oncogene homolog 1.
Figure 6:
Figure 6:
Unidimensional and bidimensional tumor measurements. CT scan of the chest in a 53-year-woman with stage IV adenocarcinoma of the lung depicts a lesion in the left upper lobe measuring 2.2 × 1.7 cm. With WHO criteria, the measurement of the lesion would be 3.7 cm2 (a product of 2.2 cm and 1.7 cm). The RECIST guideline uses the longest diameter of the lesion, which is 2.2 cm for this lesion.
Figure 7a:
Figure 7a:
Limitations of response assessment using RECIST in a 58-year-old woman with stage IV adenocarcinoma of the lung. (a, b) Contrast-enhanced axial and coronal CT images of the chest during pemetrexed and cisplatin therapy demonstrate a spiculated mass in the left upper lobe. The measurement of the dominant mass according to RECIST was 2.9 cm, measured in the longest diameter on an axial plane. Note a small nodular component of the mass at its inferior portion (arrow, b). (c, d) At follow-up CT during therapy, (c) the axial plane at the level of the longest diameter of the mass demonstrated a similar appearance and size of mass, 3.0 cm in the longest diameter. However, on (d) a coronal reformatted image at the level of the mass, the inferior component of the mass (arrow, d) has increased compared with the prior study (b), indicating increase of tumor burden, which is not captured by either RECIST or World Health Organization (WHO) measurements.
Figure 7b:
Figure 7b:
Limitations of response assessment using RECIST in a 58-year-old woman with stage IV adenocarcinoma of the lung. (a, b) Contrast-enhanced axial and coronal CT images of the chest during pemetrexed and cisplatin therapy demonstrate a spiculated mass in the left upper lobe. The measurement of the dominant mass according to RECIST was 2.9 cm, measured in the longest diameter on an axial plane. Note a small nodular component of the mass at its inferior portion (arrow, b). (c, d) At follow-up CT during therapy, (c) the axial plane at the level of the longest diameter of the mass demonstrated a similar appearance and size of mass, 3.0 cm in the longest diameter. However, on (d) a coronal reformatted image at the level of the mass, the inferior component of the mass (arrow, d) has increased compared with the prior study (b), indicating increase of tumor burden, which is not captured by either RECIST or World Health Organization (WHO) measurements.
Figure 7c:
Figure 7c:
Limitations of response assessment using RECIST in a 58-year-old woman with stage IV adenocarcinoma of the lung. (a, b) Contrast-enhanced axial and coronal CT images of the chest during pemetrexed and cisplatin therapy demonstrate a spiculated mass in the left upper lobe. The measurement of the dominant mass according to RECIST was 2.9 cm, measured in the longest diameter on an axial plane. Note a small nodular component of the mass at its inferior portion (arrow, b). (c, d) At follow-up CT during therapy, (c) the axial plane at the level of the longest diameter of the mass demonstrated a similar appearance and size of mass, 3.0 cm in the longest diameter. However, on (d) a coronal reformatted image at the level of the mass, the inferior component of the mass (arrow, d) has increased compared with the prior study (b), indicating increase of tumor burden, which is not captured by either RECIST or World Health Organization (WHO) measurements.
Figure 7d:
Figure 7d:
Limitations of response assessment using RECIST in a 58-year-old woman with stage IV adenocarcinoma of the lung. (a, b) Contrast-enhanced axial and coronal CT images of the chest during pemetrexed and cisplatin therapy demonstrate a spiculated mass in the left upper lobe. The measurement of the dominant mass according to RECIST was 2.9 cm, measured in the longest diameter on an axial plane. Note a small nodular component of the mass at its inferior portion (arrow, b). (c, d) At follow-up CT during therapy, (c) the axial plane at the level of the longest diameter of the mass demonstrated a similar appearance and size of mass, 3.0 cm in the longest diameter. However, on (d) a coronal reformatted image at the level of the mass, the inferior component of the mass (arrow, d) has increased compared with the prior study (b), indicating increase of tumor burden, which is not captured by either RECIST or World Health Organization (WHO) measurements.
Figure 8a:
Figure 8a:
Development of tumoral cavitation in a 64-year-old man with stage IV adenocarcinoma of the lung treated with bevacizumab, carboplatin, and paclitaxel. (a) Contrast-enhanced CT scan of the chest demonstrated a solid mass in the right upper lobe. The patient was subsequently treated with bevacizumab, carboplatin, and paclitaxel. (b) Follow-up CT at 1.5 months from the initiation of therapy demonstrated a development of tumoral cavitation within the mass. Since the cavity does not contain viable tumor cells, simply measuring the longest diameter of the mass may underestimate the response to treatment, representing one of the pitfalls of RECIST. (c) Follow-up CT at 4 months of therapy demonstrated further cavitation of the tumor occupying the majority of the tumor, with irregular and nodular components along the wall of the tumor.
Figure 8b:
Figure 8b:
Development of tumoral cavitation in a 64-year-old man with stage IV adenocarcinoma of the lung treated with bevacizumab, carboplatin, and paclitaxel. (a) Contrast-enhanced CT scan of the chest demonstrated a solid mass in the right upper lobe. The patient was subsequently treated with bevacizumab, carboplatin, and paclitaxel. (b) Follow-up CT at 1.5 months from the initiation of therapy demonstrated a development of tumoral cavitation within the mass. Since the cavity does not contain viable tumor cells, simply measuring the longest diameter of the mass may underestimate the response to treatment, representing one of the pitfalls of RECIST. (c) Follow-up CT at 4 months of therapy demonstrated further cavitation of the tumor occupying the majority of the tumor, with irregular and nodular components along the wall of the tumor.
Figure 8c:
Figure 8c:
Development of tumoral cavitation in a 64-year-old man with stage IV adenocarcinoma of the lung treated with bevacizumab, carboplatin, and paclitaxel. (a) Contrast-enhanced CT scan of the chest demonstrated a solid mass in the right upper lobe. The patient was subsequently treated with bevacizumab, carboplatin, and paclitaxel. (b) Follow-up CT at 1.5 months from the initiation of therapy demonstrated a development of tumoral cavitation within the mass. Since the cavity does not contain viable tumor cells, simply measuring the longest diameter of the mass may underestimate the response to treatment, representing one of the pitfalls of RECIST. (c) Follow-up CT at 4 months of therapy demonstrated further cavitation of the tumor occupying the majority of the tumor, with irregular and nodular components along the wall of the tumor.
Figure 9a:
Figure 9a:
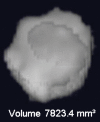
Tumor volume measurement in advanced NSCLC. (a) Contrast-enhanced CT scan of the chest in a 75-year-old woman prior to therapy demonstrates a dominant nodule in the right upper lobe. Clicking a small region of interest within the lesion allows the software to automatically segment the lesion. The boundary of the lesion can be adjusted manually if necessary. (b, c) The segmented tumor is displayed in a three-dimensional fashion and the tumor volume is obtained.
Figure 9b:
Figure 9b:
Tumor volume measurement in advanced NSCLC. (a) Contrast-enhanced CT scan of the chest in a 75-year-old woman prior to therapy demonstrates a dominant nodule in the right upper lobe. Clicking a small region of interest within the lesion allows the software to automatically segment the lesion. The boundary of the lesion can be adjusted manually if necessary. (b, c) The segmented tumor is displayed in a three-dimensional fashion and the tumor volume is obtained.
Figure 9c:
Figure 9c:
Tumor volume measurement in advanced NSCLC. (a) Contrast-enhanced CT scan of the chest in a 75-year-old woman prior to therapy demonstrates a dominant nodule in the right upper lobe. Clicking a small region of interest within the lesion allows the software to automatically segment the lesion. The boundary of the lesion can be adjusted manually if necessary. (b, c) The segmented tumor is displayed in a three-dimensional fashion and the tumor volume is obtained.
Figure 10a:
Figure 10a:
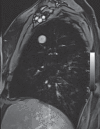
Images in a 65-year-old man with right upper lobe adenocarcinoma, with tracer transport rate constant (kep) of 3.2 min−1. (a) Axial T2-weighted half-Fourier acquisition single-shot turbo spin-echo MR image (pulse repetition time msec/echo time msec = 1200/100; field of view [FOV] = 400 mm; 320 × 320; one signal acquired; bandwidth [BW] = 780 kHz; flip angle [FA] = 150°; echo train length [ETL] = 256; 5.5-mm section thickness, 1.6-mm intersection gap; acquisition time = 6 min) and (b) postcontrast (gadopentetate dimeglumine 0.1 mmol/kg bolus injection) sagittal T1-weighted volumetric interpolated breath-hold examination MR image (3.4/1.3; FOV = 400 mm; 260 × 320; one signal acquired; BW = 505 kHz; FA = 10°; 4-mm section thickness, 0-mm intersection gap; acquisition time = 1.7 min) demonstrate right upper lobe lesion representing adenocarcinoma. (c) Representative parametric maps of tumor area on T1-weighted MR image (500/1.6, FOV = 400 mm, 192 × 180, one signal acquired, BW = 360 kHz, FA = 10°, 5-mm section thickness, oblique sagittal orientation, 124 frames, 2 seconds per frame, acquisition time = 4 min, gadopentetate dimeglumine 0.1 mmol/kg intravenously). Left panel: Goodness-of-fit map color-coded according to confidence level of χ2 test overlaid on T1-weighted image. Middle panel: Boundaries of voxels with more than 50% confidence level of χ2 test are superimposed on T1-weighted image. Right panel: Color-coded kep map. The map shows kep values of the entire tumor area. The kep values within the boundaries of the middle panel were used for the evaluation. The isolated voxel at the edge of the tumor is a single voxel. (Reprinted, with permission, from reference .)
Figure 10b:
Figure 10b:
Images in a 65-year-old man with right upper lobe adenocarcinoma, with tracer transport rate constant (kep) of 3.2 min−1. (a) Axial T2-weighted half-Fourier acquisition single-shot turbo spin-echo MR image (pulse repetition time msec/echo time msec = 1200/100; field of view [FOV] = 400 mm; 320 × 320; one signal acquired; bandwidth [BW] = 780 kHz; flip angle [FA] = 150°; echo train length [ETL] = 256; 5.5-mm section thickness, 1.6-mm intersection gap; acquisition time = 6 min) and (b) postcontrast (gadopentetate dimeglumine 0.1 mmol/kg bolus injection) sagittal T1-weighted volumetric interpolated breath-hold examination MR image (3.4/1.3; FOV = 400 mm; 260 × 320; one signal acquired; BW = 505 kHz; FA = 10°; 4-mm section thickness, 0-mm intersection gap; acquisition time = 1.7 min) demonstrate right upper lobe lesion representing adenocarcinoma. (c) Representative parametric maps of tumor area on T1-weighted MR image (500/1.6, FOV = 400 mm, 192 × 180, one signal acquired, BW = 360 kHz, FA = 10°, 5-mm section thickness, oblique sagittal orientation, 124 frames, 2 seconds per frame, acquisition time = 4 min, gadopentetate dimeglumine 0.1 mmol/kg intravenously). Left panel: Goodness-of-fit map color-coded according to confidence level of χ2 test overlaid on T1-weighted image. Middle panel: Boundaries of voxels with more than 50% confidence level of χ2 test are superimposed on T1-weighted image. Right panel: Color-coded kep map. The map shows kep values of the entire tumor area. The kep values within the boundaries of the middle panel were used for the evaluation. The isolated voxel at the edge of the tumor is a single voxel. (Reprinted, with permission, from reference 75.)
Figure 10c:
Figure 10c:
Images in a 65-year-old man with right upper lobe adenocarcinoma, with tracer transport rate constant (kep) of 3.2 min−1. (a) Axial T2-weighted half-Fourier acquisition single-shot turbo spin-echo MR image (pulse repetition time msec/echo time msec = 1200/100; field of view [FOV] = 400 mm; 320 × 320; one signal acquired; bandwidth [BW] = 780 kHz; flip angle [FA] = 150°; echo train length [ETL] = 256; 5.5-mm section thickness, 1.6-mm intersection gap; acquisition time = 6 min) and (b) postcontrast (gadopentetate dimeglumine 0.1 mmol/kg bolus injection) sagittal T1-weighted volumetric interpolated breath-hold examination MR image (3.4/1.3; FOV = 400 mm; 260 × 320; one signal acquired; BW = 505 kHz; FA = 10°; 4-mm section thickness, 0-mm intersection gap; acquisition time = 1.7 min) demonstrate right upper lobe lesion representing adenocarcinoma. (c) Representative parametric maps of tumor area on T1-weighted MR image (500/1.6, FOV = 400 mm, 192 × 180, one signal acquired, BW = 360 kHz, FA = 10°, 5-mm section thickness, oblique sagittal orientation, 124 frames, 2 seconds per frame, acquisition time = 4 min, gadopentetate dimeglumine 0.1 mmol/kg intravenously). Left panel: Goodness-of-fit map color-coded according to confidence level of χ2 test overlaid on T1-weighted image. Middle panel: Boundaries of voxels with more than 50% confidence level of χ2 test are superimposed on T1-weighted image. Right panel: Color-coded kep map. The map shows kep values of the entire tumor area. The kep values within the boundaries of the middle panel were used for the evaluation. The isolated voxel at the edge of the tumor is a single voxel. (Reprinted, with permission, from reference 75.)
Figure 11a:
Figure 11a:
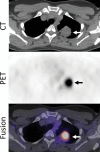
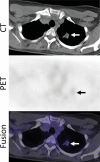
Images in a 53-year-woman with stage IV lung adenocarcinoma, harboring exon 19 deletion, treated with erlotinib. (a) A PET/CT scan prior to erlotinib therapy demonstrated a 3.7-cm dominant mass in the left upper lobe (arrows). The mass had an intense 18F-FDG uptake, with maximum SUV of 10.7. (b) Follow-up PET/CT scan during erlotinib therapy demonstrated a significant decrease in FDG uptake, with minimal residual uptake (maximum SUV: 1.5) (arrows). Tumor size has also decreased, measuring 2.1 cm in the longest diameter.
Figure 11b:
Figure 11b:
Images in a 53-year-woman with stage IV lung adenocarcinoma, harboring exon 19 deletion, treated with erlotinib. (a) A PET/CT scan prior to erlotinib therapy demonstrated a 3.7-cm dominant mass in the left upper lobe (arrows). The mass had an intense 18F-FDG uptake, with maximum SUV of 10.7. (b) Follow-up PET/CT scan during erlotinib therapy demonstrated a significant decrease in FDG uptake, with minimal residual uptake (maximum SUV: 1.5) (arrows). Tumor size has also decreased, measuring 2.1 cm in the longest diameter.

References

    1. Siegel R, Naishadham D, Jemal A. Cancer statistics, 2012. CA Cancer J Clin 2012;62(1):10–29. - PubMed
    1. American Cancer Society. Cancer facts and figures , 2012. http://www.cancer.org/Research/CancerFactsFigures/ACSPC-031941. Published 2012.
    1. Paez JG, Jänne PA, Lee JC, et al. . EGFR mutations in lung cancer: correlation with clinical response to gefitinib therapy. Science 2004;304(5676):1497–1500. - PubMed
    1. Lynch TJ, Bell DW, Sordella R, et al. . Activating mutations in the epidermal growth factor receptor underlying responsiveness of non-small-cell lung cancer to gefitinib. N Engl J Med 2004;350(21):2129–2139. - PubMed
    1. Pao W, Miller V, Zakowski M, et al. . EGF receptor gene mutations are common in lung cancers from “never smokers” and are associated with sensitivity of tumors to gefitinib and erlotinib. Proc Natl Acad Sci U S A 2004;101(36):13306–13311. - PMC - PubMed

Publication types

LinkOut - more resources