. 2014 May;8(3):766-80.
doi: 10.1016/j.molonc.2014.02.006. Epub 2014 Mar 12.

p70S6 kinase mediates breast cancer cell survival in response to surgical wound fluid stimulation

Affiliations

p70S6 kinase mediates breast cancer cell survival in response to surgical wound fluid stimulation

Ilenia Segatto et al. Mol Oncol. 2014 May.

Abstract

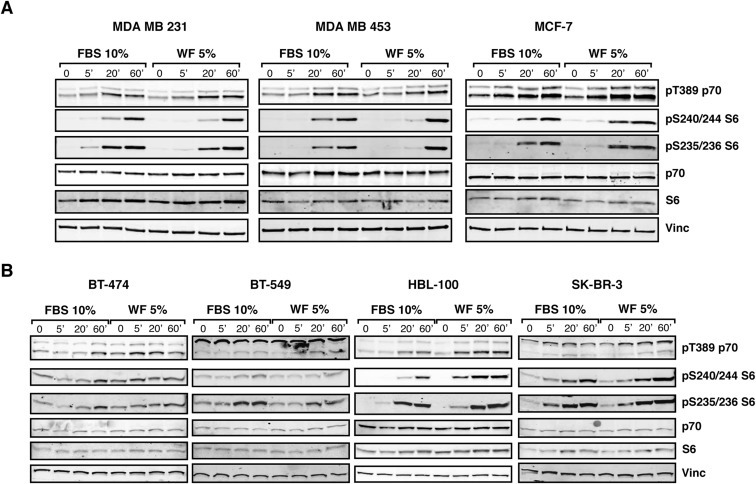
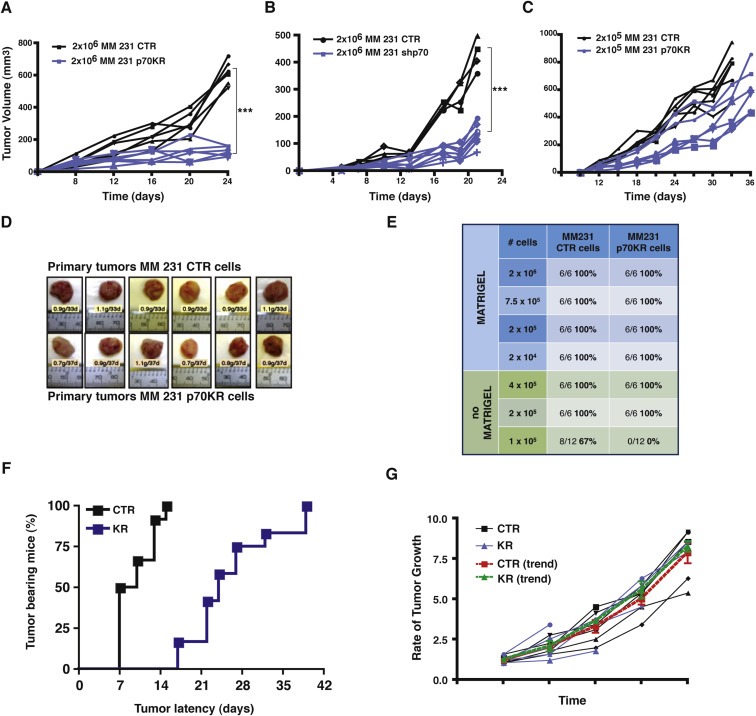
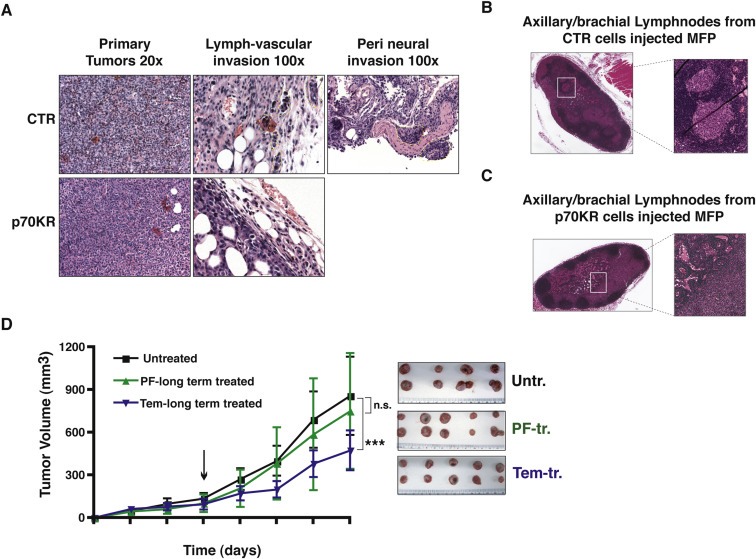
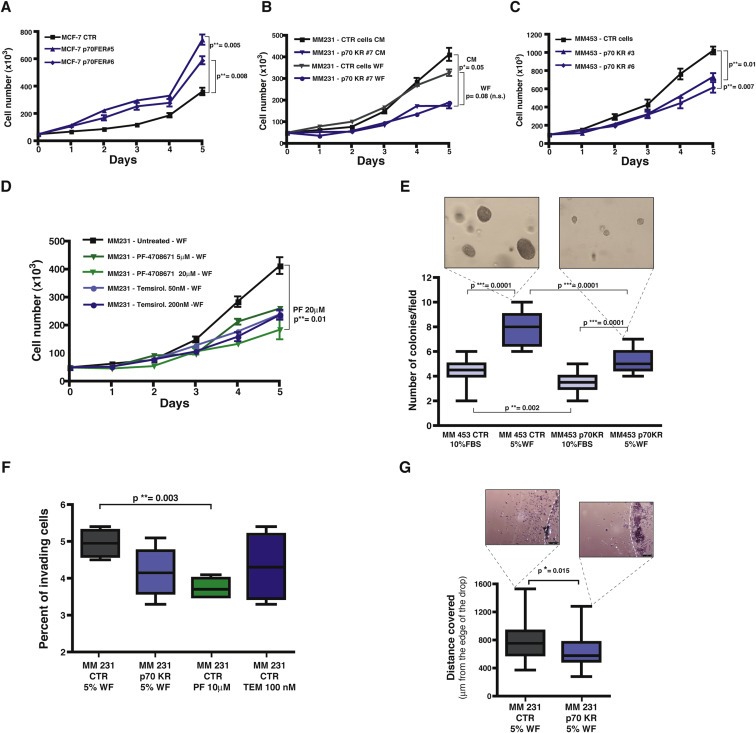
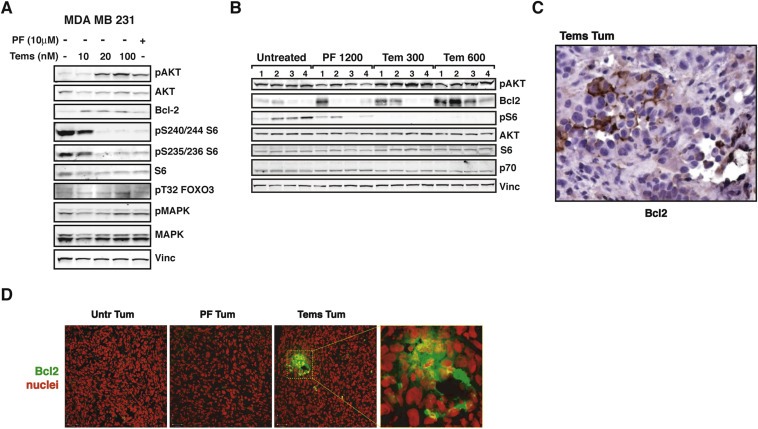
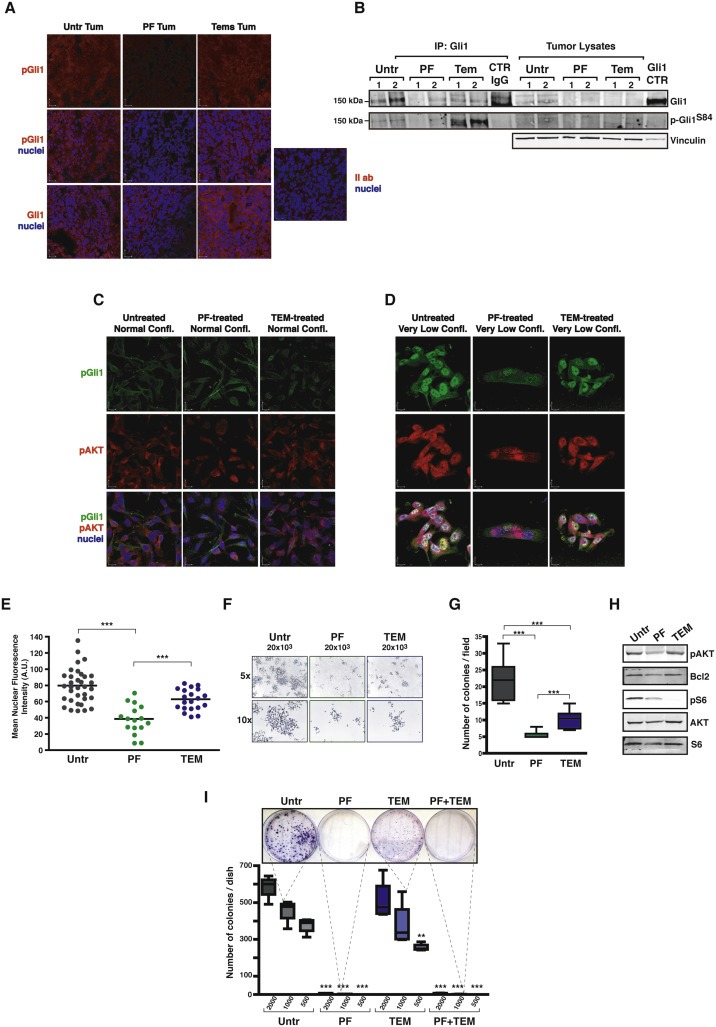
In early breast cancer, local relapses represent a determinant and not simply an indicator of risk for distant relapse and death. Notably, 90% of local recurrences occur at or close to the same quadrant of the primary cancer. Relevance of PI3K/mTOR/p70S6K signaling in breast tumorigenesis is very well documented. However, the pathway/s involved in the process of breast cancer local relapse are not well understood. The ribosomal protein p70S6K has been implicated in breast cancer cell response to post-surgical inflammation, supporting the hypothesis that it may be crucial also for breast cancer recurrence. Here, we show that p70S6K activity is required for the survival of breast cancer cells challenged in "hostile" microenvironments. We found that impairment of p70S6K activity in breast cancer cells strongly decreased their tumor take rate in nude mice. In line with this observation, if cells were challenged to grow in anchorage independence or in clonogenic assay, growth of colonies was strongly dependent on an intact p70S6K signaling. This in vitro finding was particularly evident when breast cancer cells were grown in the presence of wound fluids harvested following surgery from breast cancer patients, suggesting that the stimuli present in the post-surgical setting at least partially relied on activity of p70S6K to stimulate breast cancer relapse. From a mechanistic point of view, our results indicated that p70S6K signaling was able to activate Gli1 and up-regulate the anti-apoptotic protein Bcl2, thereby activating a survival response in breast cancer cells challenged in hostile settings. Our work highlights a previously poorly recognized function of p70S6K in preserving breast cancer cell survival, which could eventually be responsible for local relapse and opens the way to the design of new and more specific therapies aiming to restrain the deleterious effects of wound response.

Keywords: Breast cancer; Proliferation; Survival; Xenograft; mTOR; p70S6K.


Figures

Figure 1
Figure 1
In breast cancer cell lines, p70S6K is efficiently activated following stimulation with wound fluids. A. Western blot analysis of MDA MB 231, MDA MB 453 and MCF‐7 cell lines serum starved and then stimulated for the indicated times with 10% serum (FBS) or 5% wound fluids (WF). B. Same as in (A), but using BT‐474, BT‐549, HBL‐100 and SK‐BR‐3 cell lines, as indicated. Vinculin expression was used as loading control.
Figure 2
Figure 2
Primary tumor growth is altered by impairing p70S6K activity. A. Growth curves, expressed as tumor volume (mm3), of primary tumors derived from injection of MDA MB 231 cells (2 × 106) stably transduced with a retroviral empty vector (CTR) or with a retroviral vector encoding for a kinase inactive mutant of p70S6K (KR), in thoracic mammary fat pads of nude mice (2 FP/mouse) in 50 μl Matrigel/PBS (1:1). Mice were sacrificed after 3 weeks. Statistical significance was calculated using the Student's t‐test, pooling together values of the last measurement of controls vs p70KR. Three asterisks (***) indicate a p value ≤ 0.005. B. Same as in (A) but using MDA MB 231 cells silenced for p70S6K (shp70) in place of the MDA MB 231 cells expressing the p70KR mutant. C. Growth curves, expressed as tumor volume (mm3), of primary tumors derived from injection of MDA MB 231 cells (2 × 105) stably transduced with a retroviral empty vector (CTR) or with a retroviral vector encoding for a kinase inactive mutant of p70S6K (KR), in the nude mouse mammary fat pads (2 MFP/mouse) in 50 μl Matrigel/PBS (1:1). Mice were sacrificed when tumor volume was >600 mm3. After 7 weeks, all mice were sacrificed. D. Pictures of the primary tumor masses excised from mice described in (C), injected with MDA MB 231 control cells (upper images) or with p70KR expressing cells (lower images). E. Tumor take‐rate assessed by injection of the indicated numbers of MDA MB 231 cells, stably transduced with a retroviral empty vector (CTR) or with a retroviral vector encoding for a kinase inactive mutant of p70S6K (KR), in the presence of absence of Matrigel. F. Graph reports the time dependent appearance of primary tumors derived from injection of MDA MB 231 cells (2 × 105 and 4 × 105) stably transduced with a retroviral empty vector (CTR) or with a retroviral vector encoding for a kinase inactive mutant of p70S6K (KR), in the nude mouse mammary fat pads (2 MFP/mouse) without Matrigel. G. Graph reports the rate of tumor growth, independently from the time of appearance, in mice described in (F). Values are expressed as ratio of the tumor volume over the value of 20 mm3, considered as cut off. The red and the green lines represent the trend of growth of the MDA MB 231 CTR and p70KR, respectively.
Figure 3
Figure 3
Invasion of surrounding tissue and local lymph‐hematological district was blocked by impairing p70S6K activity. A. Representative images of primary tumor histology (20× objective), stained by hematoxylin and eosin. Presence of lymph‐vascular and perineural invasion by control cells is evidenced by yellow dashed line (100× objective). B and C. Representative images of axillary/brachial lymphnodes, stained by hematoxylin and eosin. Presence of lymphnode metastasis in mice injected with control cells (B), and not with p70KR cells (C), is evidenced. D. Growth curves, expressed as tumor volume (mm3), of primary tumors derived from injection of MDAMB231 control cells (2 × 106), in the thoracic mammary fat pads of nude mice (2 MFP/mouse). Mice were intraperitoneally injected with PF‐4708671 (25 mg/kg, i.e. 600 μg/mouse) or Temsirolimus (12.5 mg/kg, i.e. 300 μg/mouse) or vehicle (untreated), twice a week for three weeks. Data represent the mean (±S.D.) of 10 tumors/treatment. Picture on the right shows the primary tumors, excised at the end of the treatment. Statistical significance was calculated using the Student's t‐test, pooling together values of the last measurement of controls vs p70KR. Three asterisks (***) indicate a p value ≤ 0.005. Difference in tumor volume between Untreated and PF‐treated tumors was not significant (n.s.).
Figure 4
Figure 4
Growth and motility of breast cancer cell lines is altered by impairing p70S6K activity. A. Growth curve analysis of MCF‐7 cell line stably transduced with a retroviral empty vector (CTR) or with a retroviral vector encoding for a constitutively active form of p70S6K (FER). Two independent cell clones have been evaluated. Cells (50 × 103/well) have been seeded in complete medium (10% FBS) on day 0, and then counted by Trypan Blue exclusion test, every day for 5 days. Data represents the mean (±S.D.) of two independent experiments performed in triplicate. B. Growth curve analysis of MDA MB 231 cell line stably transduced with a retroviral empty vector (CTR) or with a retroviral vector encoding for a kinase inactive mutant of p70S6K (KR#7). Cells (50 × 103/well) have been seeded on day 0, in complete medium (10% FBS, CM) or in the presence of 3% wound fluids (WF), as indicated, and then counted by Trypan Blue exclusion test, every day for 5 days. Data represents the mean (±S.D.) of two independent experiments performed in triplicate. C. Growth curve analysis of MDA MB 453 cell line stably transduced with a retroviral empty vector (CTR) or with a retroviral vector encoding for the kinase inactive mutant of p70S6K (KR). Two independent cell clones have been evaluated. Cells (90 × 103/well) have been seeded in complete medium (10% FBS) on day 0, and then counted by Trypan Blue exclusion test, every day for 5 days. Data represents the mean (±S.D.) of two independent experiments performed in triplicate. D. Growth curve analysis of MDA MB 231 cell line in the presence of the indicated inhibitors. Cells (50 × 103/well) have been seeded in medium containing 3% wound fluids (WF) on day 0, in the presence of PF‐4708671 (5 μM or 20 μM) or Temsirolimus (50 nM or 200 nM) or vehicle (untreated) and then counted by Trypan Blue exclusion test, every day for 5 days. Fresh medium containing the inhibitor was replaced on day 3. Data represents the mean (±S.D.) of two independent experiments performed in triplicate. E. Anchorage independent growth of MDA MB 453 cells stably transduced with a retroviral empty vector (CTR) or with a retroviral vector encoding for a kinase inactive mutant of p70S6K (KR). Cells (15 × 103/well) were included in soft agar in presence of complete medium (10% FBS) or 5% wound fluids (WF), for 3 weeks. Medium with serum or wound fluid was replaced twice a week. Graph reports the count of colony number/field evaluated in each condition, using a 10× objective of a contrast phase microscope. At least 20 fields/condition were counted. Pictures show the size of the colonies of MDA MB 453 CTR and p70KR, in the WF culture condition. F. Matrigel invasion assay of MDA MB 231 cells, stably transduced with a retroviral empty vector (CTR) or with a retroviral vector encoding for a kinase inactive mutant of p70S6K (KR) or treated with the indicated inhibitor. Cells (1 × 105/transwell) have been seeded on top of a transwell chamber, pre‐coated with 6 μg Matrigel, in duplicate, in the presence of 5% wound fluids (WF) plus PF‐4708671 (10 μM) or Temsirolimus (100 nM), where indicated. The percent of invading cells after 12 h is shown and represents the mean (±S.D.) of two independent experiments performed in duplicate. G. Matrigel evasion assay of MDA MB 231 cells stably transduced with a retroviral empty vector (CTR) or with a retroviral vector encoding for a kinase inactive mutant of p70S6K (KR). Cells (7.5 × 103/12 μl drop) were included in Matrigel in the presence of 5% wound fluids (WF) for 6 days, then fixed and analyzed for the distance covered from the edge of the drop. In all panels, statistical significance was calculated using the Student's t‐test. A p value ≤ 0.05 was considered significant.
Figure 5
Figure 5
p70S6K1 signaling results in upregulation of Bcl2 in breast cancer cells. A. Western blot analysis of MDA MB 231 cells treated with the indicated inhibitor (PF‐4708671 10 μM or Temsirolimus 10, 20 and 100 nM) or left untreated. Vinculin expression was used as loading control. B. Western blot analysis of primary tumor lysates derived from injection of MDA MB 231 control cells (2 × 10⁶), in nude mouse thoracic mammary fat pads. When tumors reached a volume of 50–100 mm3, mice were intraperitoneally injected with PF‐4708671 (50 mg/kg, i.e. 1200 μg/mouse) or Temsirolimus (12.5 mg/kg, i.e. 300 μg/mouse or 25 mg/kg, i.e. 600 μg/mouse) or vehicle (Untreated) for three consecutive days and then sacrificed. C. Immunohistochemistry analysis of Bcl2 on tumor section from a Tems‐treated mouse of the experiment described in (B). Nor untreated tumors nor those from PF‐treated mice displayed positivity for Bcl2 (magnification 200×). D. Immunofluorescence analysis on tumor sections from experiment described in (B), acquired by confocal microscopy. The panels show the merge of the immunostaining for Bcl2 (AF‐488, pseudocolored in green) with the nuclear staining with propidium iodide (pseudocolored in red). Bars correspond to 35 μm. The panel at the right shows higher magnification of the dashed area.
Figure 6
Figure 6
Pro‐survival response of breast cancer cells relies on the p70S6K1/Gli1 axis. A. Immunofluorescence analysis of tumor sections from experiment described in Figure 5B, acquired by confocal microscopy. Panels show the immunostaining for pSer84Gli1 (AF‐546, pseudocolored in red) alone or merged with the nuclear staining with TO‐PRO‐3 Iodide (pseudocolored in blue) or for Gli1 (AF‐546, pseudocolored in red) merged with the nuclear staining with TO‐PRO‐3 Iodide (pseudocolored in blue). Panel on the right represent staining omitting only the primary antibody. Bars correspond to 22 μm. B. Western Blot analysis of tumor protein lysates from experiment described in Figure 5B, immunoprecipitated for Gli1 and blotted for Gli1 and pS84‐Gli1, as indicated. Molecular weight marker of 150 kDa is indicated on the left. Vinculin was used as loading control of lysates. Gli1 CTR indicates a lysate of TOV112D cells, positive control for Gli1 expression. C. Immunofluorescence analysis of MDA MB 231 cells seeded at normal confluence conditions and treated as indicated, acquired by confocal microscopy. Panels show the immunostaining for pSer84Gli1 (AF‐488, pseudocolored in green) or for pAKT (AF‐633, pseudocolored in red) or merged with the nuclear staining with Propidium Iodide (pseudocolored in blue). Bars correspond to 15 μm. D. Same as in (C) except that MDA MB 231 cells were seeded at very low confluence. Bars correspond to 11 μm. E. Graph reports the mean nuclear fluorescence intensity, expressed as arbitrary units (A.U.) of the cells in (D). Values have been calculated measuring at least 16 cells/treatment and using the Volocity software (Perkin Elmer). F. Pictures refer to MDA MB 231 cells plated at very low density (20 × 103 cell/100 mm dish) in the presence of the indicated treatments or left untreated. Both 5× and 10× objectives have been used to capture images. G. Graph reports the number of colonies/field from the experiment described in (F). H. Western blot analysis of protein lysates from cells of the experiment described in (F). I. Colony assay of MDA MB 231 cells plated at ultra‐low density (2 × 103, 1 × 103 or 500 cell/100 mm dish, as indicated) and treated as indicated. Colonies were stained with crystal violet, then photographed (picture above) and counted (graph below). Data represent the counts of two different experiments, performed in duplicate. In all panels, statistical significance was calculated using the Student's t‐test. Two asterisks (**) indicate a p value ≤ 0.01. Three asterisks (***) indicate a p value ≤ 0.005.

References

    1. Abdulkarim, B.S. , Cuartero, J. , Hanson, J. , Deschênes, J. , Lesniak, D. , Sabri, S. , 2011. Increased risk of locoregional recurrence for women with T1-2N0 triple-negative breast cancer treated with modified radical mastectomy without adjuvant radiation therapy compared with breast-conserving therapy. J. Clin. Oncol.. 29, 2852–2858. - PMC - PubMed
    1. Akar, U. , Ozpolat, B. , Mehta, K. , Lopez-Berestein, G. , Zhang, D. , Ueno, N.T. , Hortobagyi, G.N. , Arun, B. , 2010. Targeting p70S6K prevented lung metastasis in a breast cancer xenograft model. Mol. Cancer Ther.. 9, 1180–1187. - PubMed
    1. Baker, D.G. , Masterson, T.M. , Pace, R. , Constable, W.C. , Wanebo, H. , 1989. The influence of the surgical wound on local tumor recurrence. Surgery. 106, 525–532. - PubMed
    1. Baldassarre, G. , Belletti, B. , Nicoloso, M.S. , Schiappacassi, M. , Vecchione, A. , Spessotto, P. , Morrione, A. , Canzonieri, V. , Colombatti, A. , 2005. p27(Kip1)-stathmin interaction influences sarcoma cell migration and invasion. Cancer Cell. 7, 51–63. - PubMed
    1. Belletti, B. , Nicoloso, M.S. , Schiappacassi, M. , Berton, S. , Lovat, F. , Wolf, K. , Canzonieri, V. , D'Andrea, S. , Zucchetto, A. , Friedl, P. , Colombatti, A. , Baldassarre, G. , 2008. Stathmin activity influences sarcoma cell shape, motility, and metastatic potential. Mol. Biol. Cell. 19, 2003–2013. - PMC - PubMed

Publication types

MeSH terms

Substances