. 2014 Mar 24:5:3483.
doi: 10.1038/ncomms4483.

Activation of the mitochondrial unfolded protein response does not predict longevity in Caenorhabditis elegans

Affiliations

Activation of the mitochondrial unfolded protein response does not predict longevity in Caenorhabditis elegans

Christopher F Bennett et al. Nat Commun. .

Abstract

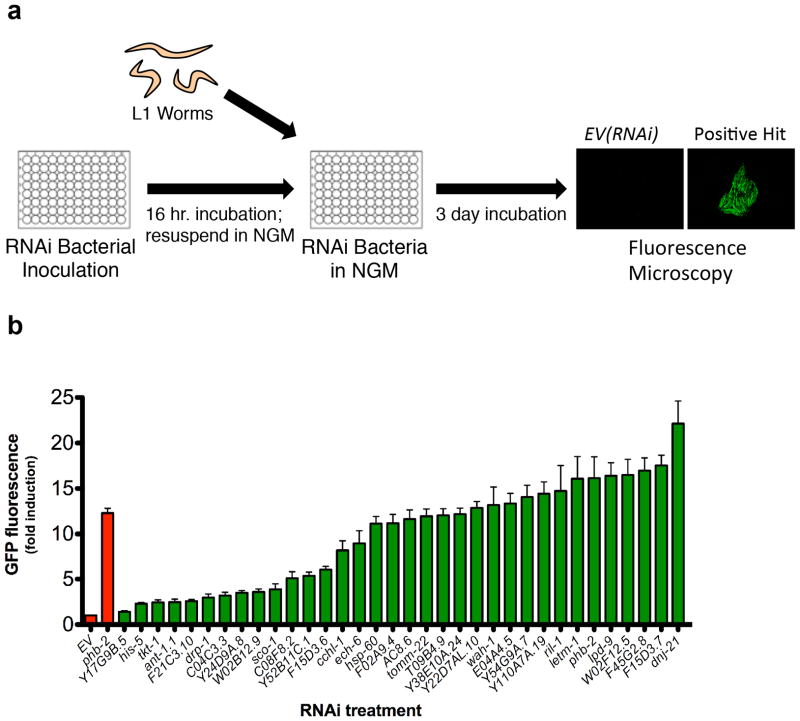
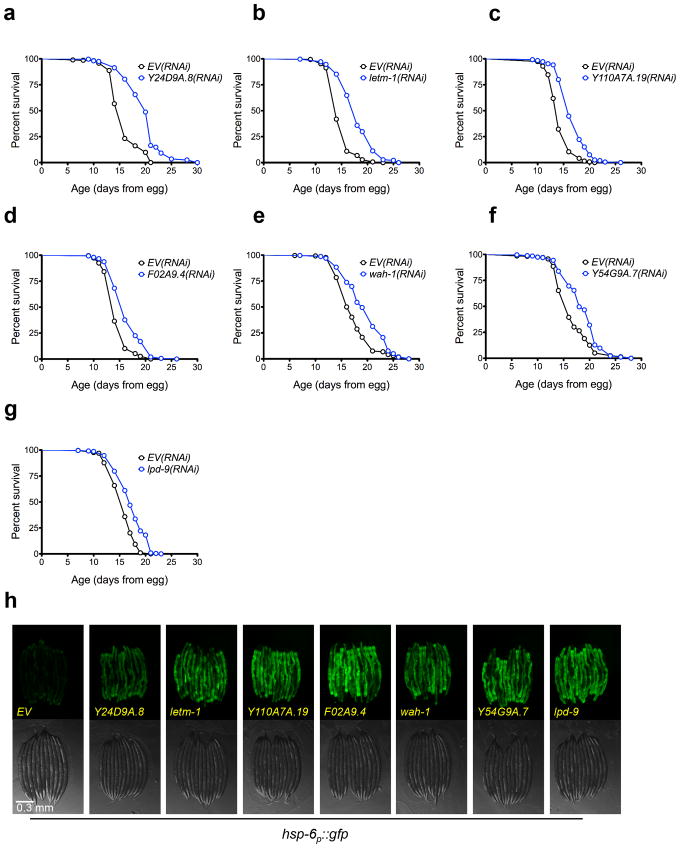
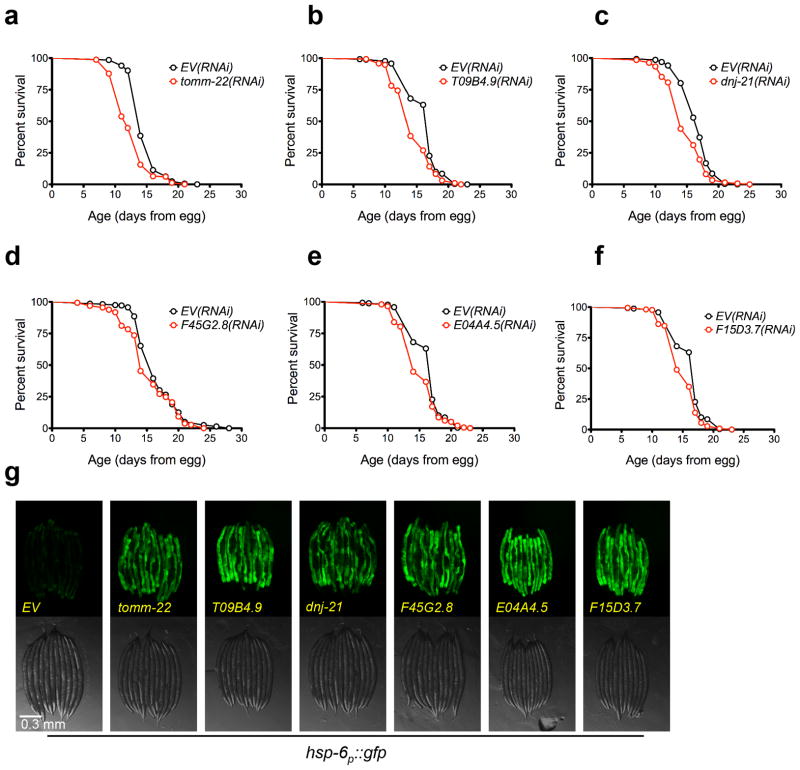
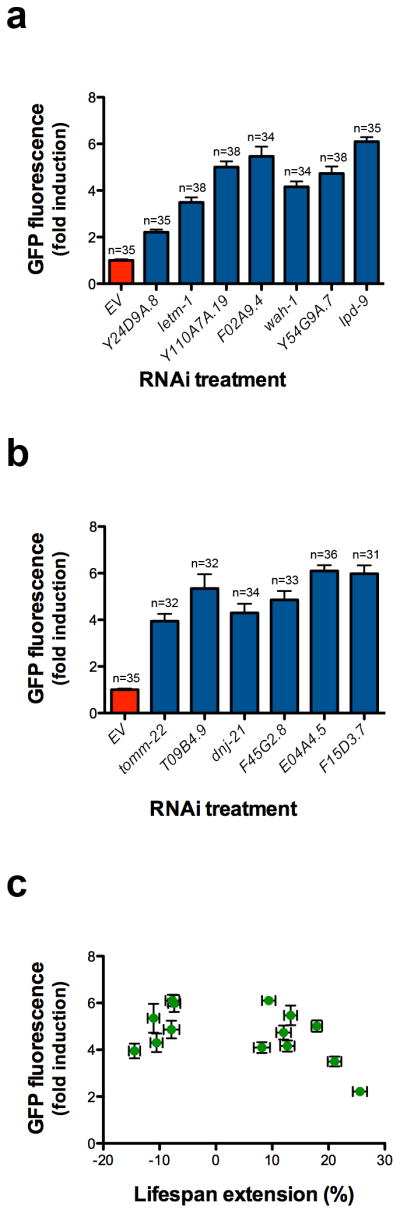
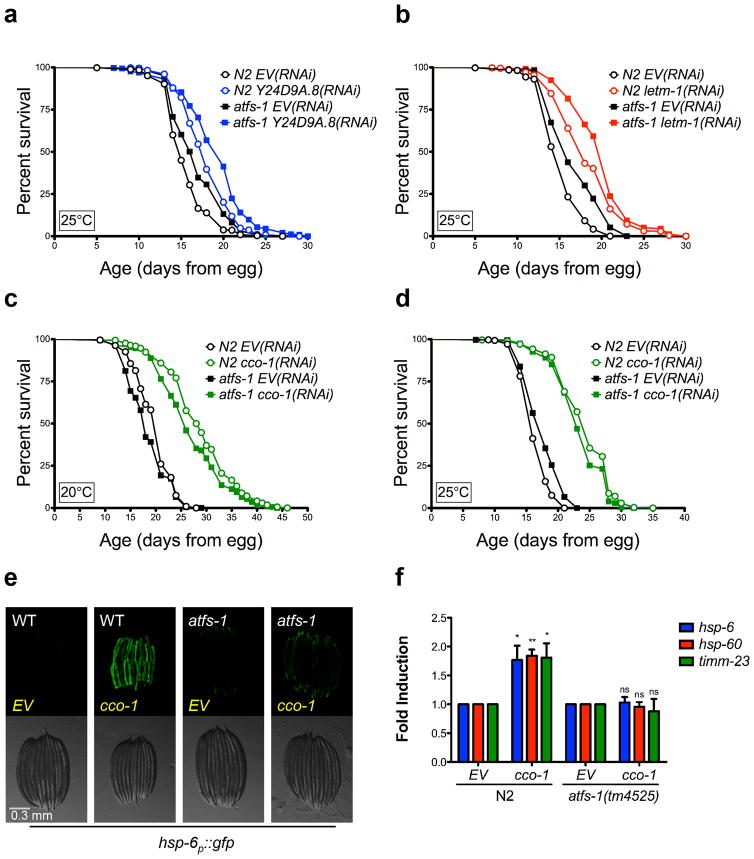
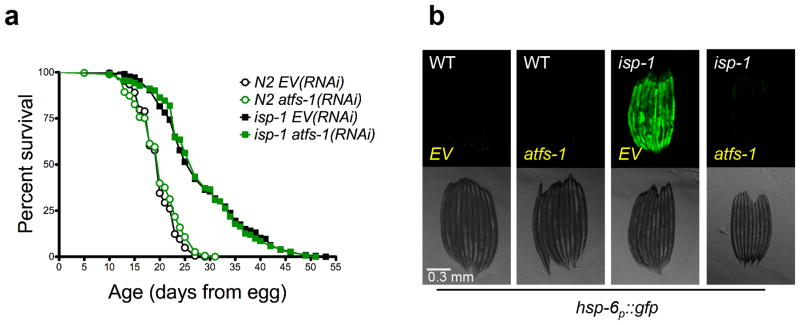
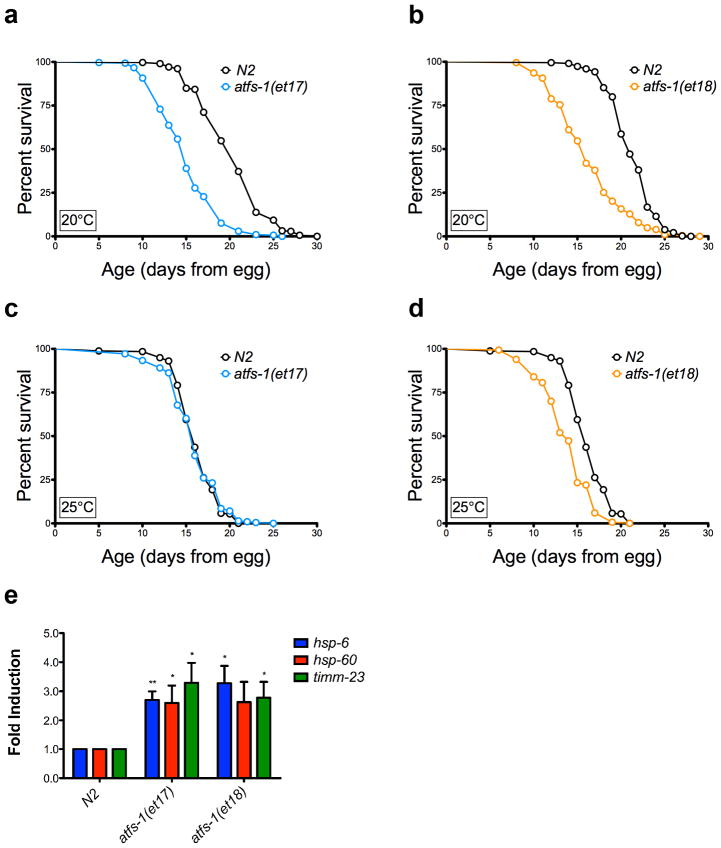
Recent studies have propagated the model that the mitochondrial unfolded protein response (UPR(mt)) is causal for lifespan extension from inhibition of the electron transport chain (ETC) in Caenorhabditis elegans. Here we report a genome-wide RNAi screen for negative regulators of the UPR(mt). Lifespan analysis of nineteen RNAi clones that induce the hsp-6p::gfp reporter demonstrate differential effects on longevity. Deletion of atfs-1, which is required for induction of the UPR(mt), fails to prevent lifespan extension from knockdown of two genes identified in our screen or following knockdown of the ETC gene cco-1. RNAi knockdown of atfs-1 also has no effect on lifespan extension caused by mutation of the ETC gene isp-1. Constitutive activation of the UPR(mt) by gain of function mutations in atfs-1 fails to extend lifespan. These observations identify several new factors that promote mitochondrial homoeostasis and demonstrate that the UPR(mt), as currently defined, is neither necessary nor sufficient for lifespan extension.


Conflict of interest statement

COMPETING FINANCIAL INTERESTS

The authors declare no competing financial interests.

Figures

Figure 1
Figure 1. A genome-wide RNAi screen for negative regulators of the mitochondrial unfolded protein response
(a) RNAi bacteria were grown overnight in 96 well plates, while hsp-6p::gfp animals were synchronized at L1 larval stage. The next day, RNAi bacteria was induced with IPTG, resuspended in liquid NGM, and added to reporter animals in 96-well plates. Animals were allowed to develop for three days and GFP was measured by fluorescent microscopy. (b) hsp-6p::gfp induction was quantified for 34 RNAi clones corresponding to positive hits that were not annotated as functioning in the ETC or mitochondrial translation. Validation included sequencing each RNAi clone and GFP quantification of individual animals grown at 20°C. GFP fluorescence is the mean fluorescence relative to EV(RNAi) (N=3 independent experiments, error bars indicate SEM).
Figure 2
Figure 2. Several UPRmt inducing RNAi clones extend lifespan
(a) N2 fed EV(RNAi) (mean 15.8 ± .2 days, n = 284), N2 fed Y24D9A.8(RNAi) (mean 19.8 ± .2 days, n = 316, p < 0.0001). (b) N2 fed EV(RNAi) (mean 15.0 ± .1 days, n = 320), N2 fed letm-1(RNAi) (mean 18.1 ± .2 days, n = 318, p < 0.0001). (c) N2 fed EV(RNAi) (mean 14.3 ± .1 days, n = 267), N2 fed Y110A7A.19(RNAi) (mean 16.8 ± .1 days, n = 360, p < 0.0001). (d) N2 fed EV(RNAi) (mean 14.6 ± .1 days, n = 266), N2 fed F02A9.4(RNAi) (mean 16.6 ± .2 days, n = 302, p < 0.0001). (e) N2 fed EV(RNAi) (mean 17.4 ± .2 days, n = 264), N2 fed wah-1(RNAi) (mean 19.6 ± .2 days, n = 301, p < 0.0001). (f) N2 fed EV(RNAi) (mean 16.5 ± .2 days, n = 279), N2 fed Y54G9A.7(RNAi) (mean 18.5 ± .2 days, n = 266, p < 0.0001). (g) N2 fed EV(RNAi) (mean 15.7 ± .1 days, n = 293), N2 fed lpd-9(RNAi) (mean 17.3 ± .2 days, n = 226, p < 0.0001). (h) The hsp-6p::gfp reporter is induced by knockdown of longevity conferring RNAi clones. hsp-6p::gfp worms were placed onto RNAi bacteria from egg and GFP measurements were taken three days later. Scale bar, 0.3 mm. Lifespans experiments in this figure were performed at 25°C. N=3 independent experiments, with pooled data shown. Lifespans are indicated as mean +/− SEM and p-values were calculated using Wilcoxon rank-sum test. Data by individual experiment and statistical analysis provided in Supplementary Materials (Supplementary Data 1).
Figure 3
Figure 3. Several UPRmt inducing RNAi clones shorten lifespan
(a) N2 fed EV(RNAi) (mean 14.8 ± .1 days, n = 335), N2 fed tomm-22(RNAi) (mean 12.7 ± .2 days, n = 327, p < 0.0001). (b) N2 fed EV(RNAi) (mean 16.3 ± .2 days, n = 260), N2 fed T09B4.9(RNAi) (mean 14.5 ± .2 days, n = 289, p < 0.0001). (c) N2 fed EV(RNAi) (mean 16.7 ± .1 days, n = 293), N2 fed dnj-21(RNAi) (mean 14.9 ± .2 days, n = 270, p < 0.0001). (d) N2 fed EV(RNAi) (mean 16.5 ± .2 days, n = 279), N2 fed F45G2.8(RNAi) (mean 15.2 ± .2 days, n = 291, p < 0.0001). (e) N2 fed EV(RNAi) (mean 16.3 ± .2 days, n = 260), N2 fed E04A4.5(RNAi) (mean 15.1 ± .2 days, n = 199, p < 0.0001). (f) N2 fed EV(RNAi) (mean 16.3 ± .2 days, n = 260), N2 fed F15D3.7(RNAi) (mean 15.1 ± .2 days, n = 217, p < 0.0001). (g) The hsp-6p::gfp reporter is induced by knockdown of RNAi clones that reduce lifespan. hsp-6p::gfp worms were placed onto RNAi bacteria from egg and grown at 25°C. GFP measurements were taken three days later. Scale bar, 0.3 mm. Lifespan experiments in this figure were performed at 25°C. N=3 independent experiments, with pooled data shown. Lifespans are indicated as mean +/− SEM and p-values were calculated using Wilcoxon rank-sum test. Data by individual experiment and statistical analysis provided in Supplementary Materials (Supplementary Data 1).
Figure 4
Figure 4. Induction of hsp-6p::gfp is not correlated with lifespan extension
hsp-6p::gfp induction from three separate experiments performed at 25°C for (a) long-lived RNAi clones and (b) short-lived RNAi clones. GFP fluorescence is the average fluorescence of an individual worm relative to EV(RNAi) and error bars indicate SEM. (c) hsp-6p::gfp induction is not significantly positively correlated with lifespan extension. The Pearson’s correlation R2 is 0.1912 and p-value is 0.12. Error bars indicate SEM for GFP fluorescence and % mean lifespan extension relative to EV(RNAi).
Figure 5
Figure 5. UPRmt inducing RNAi clones do not require atfs-1 for lifespan extension
(a) Y24D9A.8(RNAi) lifespan extension is not dependent on atfs-1. N2 fed EV(RNAi) (mean 15.7 ± .1 days, n = 535), N2 fed Y24D9A.8(RNAi) (mean 18.1 ± .1 days, n = 456, p < 0.0001), atfs-1(tm425) fed EV(RNAi) (mean 17 ± .2 days, n = 417), atfs-1(tm4525) fed Y24D9A.8(RNAi) (19.2 ± .2 days, n = 334, p < 0.0001). (b) letm-1(RNAi) lifespan extension is not dependent on atfs-1. N2 fed EV(RNAi) (mean 15.5 ± .1, n = 460), N2 fed letm-1(RNAi) (mean 18.6 ± .2, n = 421, p < 0.0001), atfs-1(tm425) fed EV(RNAi) (mean 17 ± .2, n = 386), atfs-1(tm4525) fed letm-1(RNAi) (mean 20.1 ± .2, n = 358, p < 0.0001). (c) The long lifespan of cco-1(RNAi) is not dependent on atfs-1 at 20°C. N2 fed EV(RNAi) (mean 19.9 ± .2, n = 215), N2 fed cco-1(RNAi) (mean 28.9 ± .5, n = 170, p < 0.0001), atfs-1(tm425) fed EV(RNAi) (mean 18.6 ± .3, n = 202), atfs-1(tm4525) fed cco-1(RNAi) (mean 26.9 ± .5, n = 170, p < 0.0001). (d) The long lifespan of cco-1(RNAi) is not dependent on atfs-1 at 25°C. N2 fed EV(RNAi) (mean 16.6 ± .1, n = 279), N2 fed cco-1(RNAi) (mean 24.2 ± .3, n = 242, p < 0.0001), atfs-1(tm425) fed EV(RNAi) (mean 17.8 ± .2, n = 302), atfs-1(tm4525) fed cco-1(RNAi) (mean 23.5 ± .3, n = 202, p < 0.0001). (e) hsp-6p::gfp induction by cco-1(RNAi) is attenuated in the atfs-1(tm4525) mutant. Scale bar, 0.3 mm. (f) Induction of UPRmt targets hsp-6, hsp-60, and timm-23 does not occur in the atfs-1(tm4525) mutant. N2 and atfs-1(tm4525) worms were grown on cco-1(RNAi) from egg at 20°C and harvested at L4. Gene expression was normalized to EV(RNAi). (N=4, Error bars represent SEM, p* < 0.05, p** < 0.01), p > 0.05 is not significant (ns), student’s t-test). Lifespan experiments in this figure represent pooled data, are indicated as mean +/− SEM, and p-values were calculated using Wilcoxon rank-sum test. Data by individual experiment and statistical analysis provided in Supplementary Materials (Supplementary Data 2).
Figure 6
Figure 6. The UPRmt is not required for isp-1(qm150) longevity
(a) Knockdown of atfs-1 does not attenuate the longevity of complex III mutant isp-1(qm150). N2 fed EV(RNAi) (mean 19.7 ± .2, n = 365), N2 fed atfs-1(RNAi) (mean 20 ± .2 days, n = 346, p = 0.399), isp1(qm150) fed EV(RNAi) (mean 28.2 ± .6 days, n = 206), isp-1(qm150) fed atfs-1(RNAi) (mean 28.3 ± .5 days, n = 293, p = 0.612). (b) hsp-6p::gfp induction by isp-1(qm150) mutation is attenuated by atfs-1(RNAi). Scale bar, 0.3 mm. Lifespan experiments in this figure represent pooled data, are indicated as mean +/− SEM, and p-values were calculated using Wilcoxon rank-sum test. Data by individual experiment and statistical analysis provided in Supplementary Materials (Supplementary Data 2).
Figure 7
Figure 7. The UPRmt is not sufficient for lifespan extension
(a) Constitutive UPRmt mutation atfs-1(et17) shortens lifespan at 20°C. N2 fed HT115 bacteria (mean 20.3 ± .2 days, n = 312), atfs-1(et17) fed HT115 bacteria (mean 15 ± .2, n = 303, p < 0.0001). (b) Constitutive UPRmt mutation atfs-1(et18) shortens lifespan at 20°C. N2 fed HT115 bacteria (mean 21.3 ± .1, n = 418), atfs-1(et18) fed HT115 bacteria (mean 16.3 ± .3 days, n = 203, p < 0.0001). (c) atfs-1(et17) mutation does not affect lifespan at 25°C. N2 fed HT115 bacteria (mean = 16.2 ± .15 days), atfs-1(et17) fed HT115 bacteria (mean = 15.9 ± .21 days, p = 0.31). (d) atfs-1(et18) mutation shortens lifespan at 25°C. N2 fed HT115 bacteria (mean = 16.2 ± .15 days), atfs-1(et18) fed HT115 bacteria (mean = 13.8 ± .13 days, p < 0.0001). (e) Constitutive UPRmt mutations atfs-1(et17) and atfs-1(et18) induce expression of hsp-6, hsp-60, and timm-23. Gene expression was normalized to N2 fed EV(RNAi). (N=4, Error bars represent SEM, p* < 0.05, p** < 0.01, student’s t-test). The gene expression data for hsp-60 in the atfs-1(et18) allele is trending significant, with p = 0.05. Lifespan experiments in this figure represent pooled data, are indicated as mean +/− SEM, and p-values were calculated using Wilcoxon rank-sum test. Data by individual experiment and statistical analysis provided in Supplementary Materials (Supplementary Data 2).

References

    1. Wallace DC. A mitochondrial paradigm for degenerative diseases and ageing. Novartis Found Symp. 2001;235:247–263. discussion 263–246. - PubMed
    1. Bratic A, Larsson NG. The role of mitochondria in aging. The Journal of clinical investigation. 2013;123:951–957. doi: 10.1172/JCI64125. - DOI - PMC - PubMed
    1. Harman D. Aging: a theory based on free radical and radiation chemistry. Journal of gerontology. 1956;11:298–300. - PubMed
    1. Ristow M, Zarse K. How increased oxidative stress promotes longevity and metabolic health: The concept of mitochondrial hormesis (mitohormesis) Exp Gerontol. 2010;45:410–418. doi: 10.1016/j.exger.2010.03.014. - DOI - PubMed
    1. Yanos ME, Bennett CF, Kaeberlein M. Genome-Wide RNAi Longevity Screens in Caenorhabditis elegans. Current Genomics. 2012;13:508–518. doi: 10.2174/138920212803251391. - DOI - PMC - PubMed

Publication types

MeSH terms

Substances

LinkOut - more resources