Review
. 2014 Apr;14(4):271-80.
doi: 10.1038/nri3642.

Democratizing systems immunology with modular transcriptional repertoire analyses

Affiliations
Review

Democratizing systems immunology with modular transcriptional repertoire analyses

Damien Chaussabel et al. Nat Rev Immunol. 2014 Apr.

Abstract

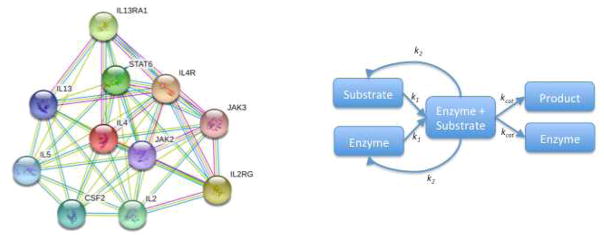
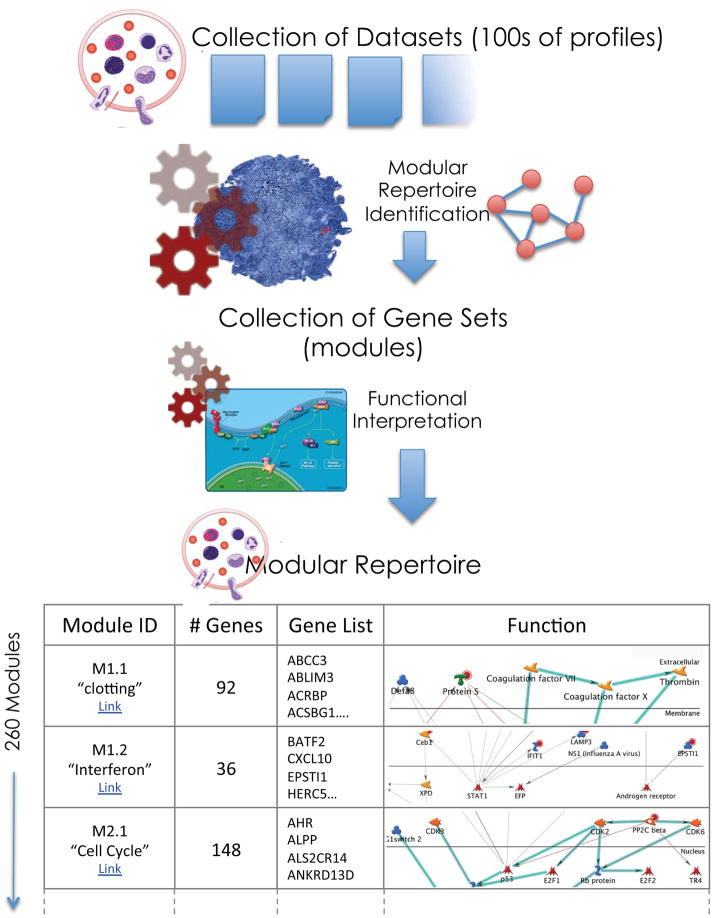
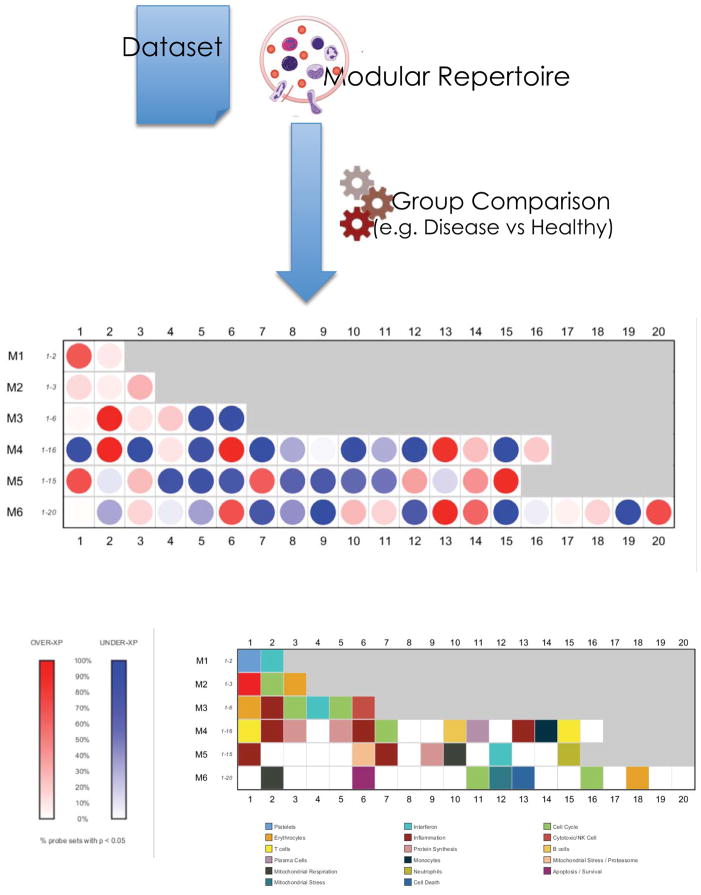
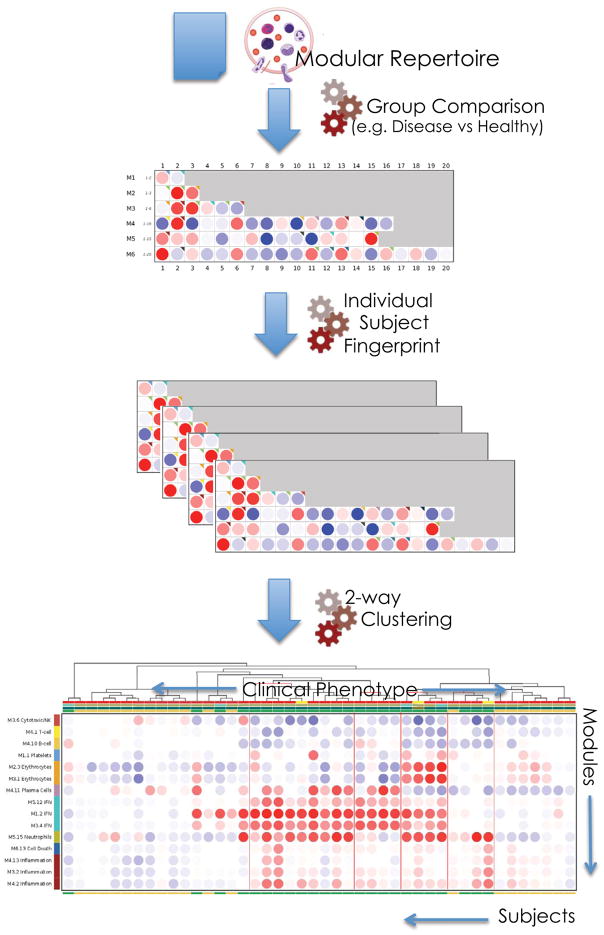
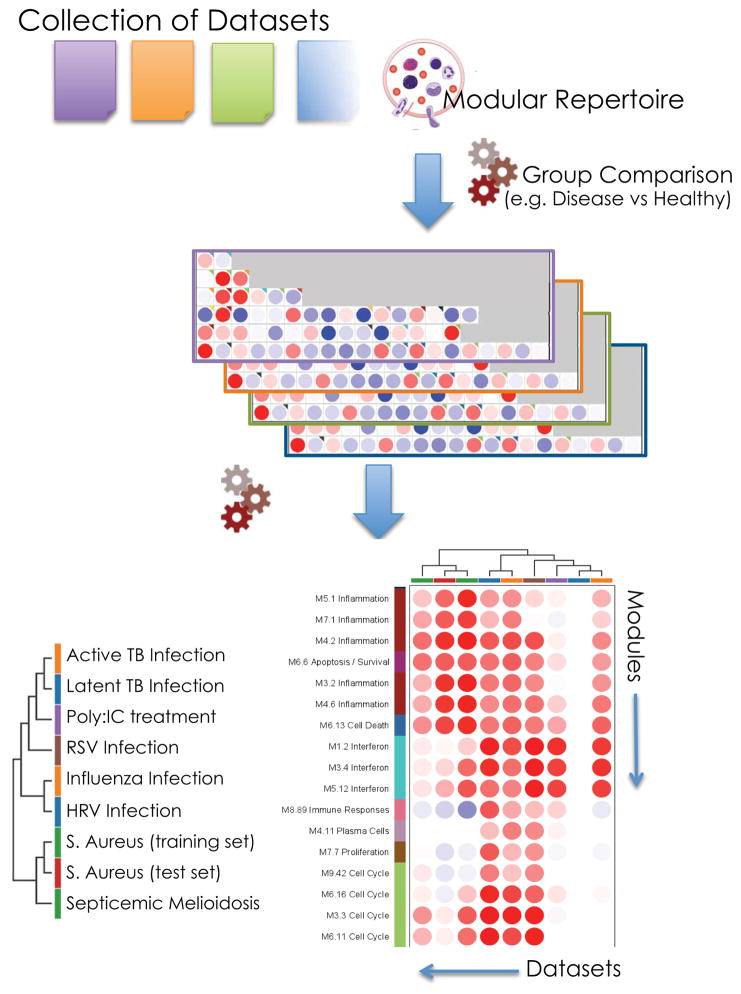
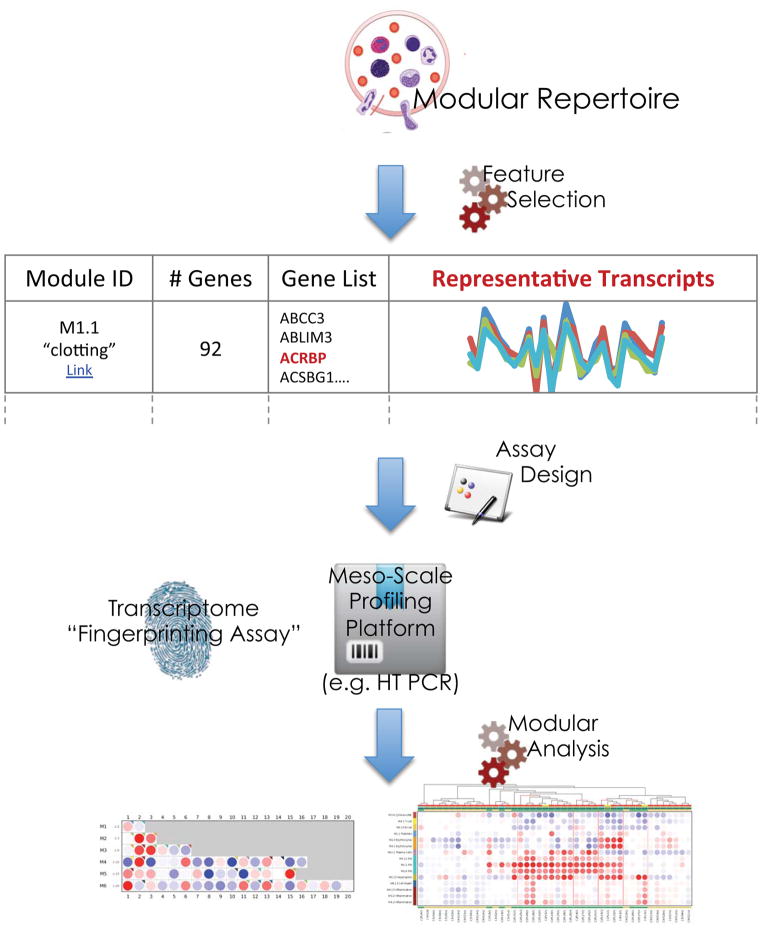
Individual elements that constitute the immune system have been characterized over the few past decades, mostly through reductionist approaches. The introduction of large-scale profiling platforms has more recently facilitated the assessment of these elements on a global scale. However, the analysis and the interpretation of such large-scale datasets remains a challenge and a barrier for the wider adoption of systems approaches in immunological and clinical studies. In this Innovation article, we describe an analytical strategy that relies on the a priori determination of co-dependent gene sets for a given biological system. Such modular transcriptional repertoires can in turn be used to simplify the analysis and the interpretation of large-scale datasets, and to design targeted immune fingerprinting assays and web applications that will further facilitate the dissemination of systems approaches in immunology.


Figures

None
A. An undirected and unweighted graph generated by String (http://string-db.org/), showing potential interactions among IL-4 and proteins found to interact with IL-4. Nodes represent proteins. Edges represent evidence of interaction between proteins. Edge color indicates the type of evidence for the interaction. B. A directed and weighted graph of a single substrate enzyme catalyzed reaction. Nodes represent components components of the reaction. Edges represent the kinetics of the reaction and are weighted by the appropriate rate constants (k1: rate of enzyme-substrate association; k2: rate of enzyme-substrate disassociation; kcat: rate of enzyme catalysis)
Figure 1
Figure 1. Modular repertoire identification
Modular repertoires are determined for a given biological system, such as whole blood, through an entirely data-driven process. A collection of relevant transcriptome datasets is assembled and carefully curated using quality control criteria. Each dataset is clustered independently and co-clustering events recorded. This information is used to build a large co-clustering network. Each edge connecting two genes indicates a co-clustering event. Edges carry different weights depending on the number of datasets in which two genes co-cluster. Highly connected subnetworks (i.e. modules) are mined using graph theory. The first round of selection (M1 modules) selects sub-networks for which connections carry the maximum weight (genes co-cluster in all datasets). Subsequent rounds of selection (M2, M3, M4…) allow for the selection of modules for which gene co-cluster in all but 1, 2, 3 or more datasets. Finally the resulting collection of modules is subjected to functional interpretation.
Figure 2
Figure 2. Mapping perturbations of the modular repertoire
Modular repertoires can be used as frameworks for the analysis of individual datasets. The proportion of transcripts in a given module passing a set cutoff and expressed as a percentage is represented as a spot on a grid. Red spots indicate an increase in transcript abundance relative to a given state. Blue spots indicate a decrease in abundance. The first row on this grid includes modules identified in the first round of selection (M1; sub-network constituted by genes co-clustering in all datasets); modules identified in subsequent rounds of selection make up the next rows (M2, M3, M4 etc…). Only modules from the first 6 rounds of selection are shown on this map. Functional interpretations are indicated by a color code on a similar grid.
Figure 3
Figure 3. Mapping perturbations of the modular repertoire across individual samples
Mapping perturbations of the modular repertoire for a group of subjects does not account for the heterogeneity observed at the individual level. Modular fingerprints can be derived for individual subjects using a reference set of samples (for example,. healthy baseline). This allows for the exploration of inter-individual variability and classification of subjects according to modular patterns of activity.
Figure 4
Figure 4. Mapping perturbations of the modular repertoire across studies
Modular repertoires can be used as frameworks for the combined meta-analysis of disparate collections of datasets. Modular fingerprints are derived independently from each study using their respective control group as baseline. Patterns of module activity are compared across studies using hierarchical clustering where studies and modules are arranged according to similarity. In the example provided results from five independent studies are compared.
Figure 5
Figure 5. Transcriptome fingerprinting assays
Modular repertoires can be used as a basis for the development of targeted assays. Transcripts within a module that best represent the overall pattern of transcriptional activity are used as surrogates for the entire gene set. This allows for the profiling of transcriptome repertoires with a combined set of representative targets using a cost-effective and sensitive ‘meso-scale’ profiling assay (interrogating tens or hundreds of transcripts).

References

    1. Schuh W, Meister S, Herrmann K, Bradl H, Jack HM. Transcriptome analysis in primary B lymphoid precursors following induction of the pre-B cell receptor. Molecular immunology. 2008;45:362–375. - PubMed
    1. Chaussabel D, Pascual V, Banchereau J. Assessing the human immune system through blood transcriptomics. BMC biology. 2010;8:84. - PMC - PubMed
    1. Pascual V, Chaussabel D, Banchereau J. A genomic approach to human autoimmune diseases. Annual review of immunology. 2010;28:535–571. - PMC - PubMed
    1. Li S, Nakaya HI, Kazmin DA, Oh JZ, Pulendran B. Systems biological approaches to measure and understand vaccine immunity in humans. Seminars in immunology. 2013 - PMC - PubMed
    1. Ravindran R, et al. Vaccine activation of the nutrient sensor GCN2 in dendritic cells enhances antigen presentation. Science. 2014;343:313–317. - PMC - PubMed

Publication types