. 2014 May;24(5):513-31.
doi: 10.1038/cr.2014.35. Epub 2014 Mar 25.

Human colorectal cancer-specific CCAT1-L lncRNA regulates long-range chromatin interactions at the MYC locus

Affiliations

Human colorectal cancer-specific CCAT1-L lncRNA regulates long-range chromatin interactions at the MYC locus

Jian-Feng Xiang et al. Cell Res. 2014 May.

Erratum in

  • Cell Res. 2014 Sep;24(9):1150

Abstract

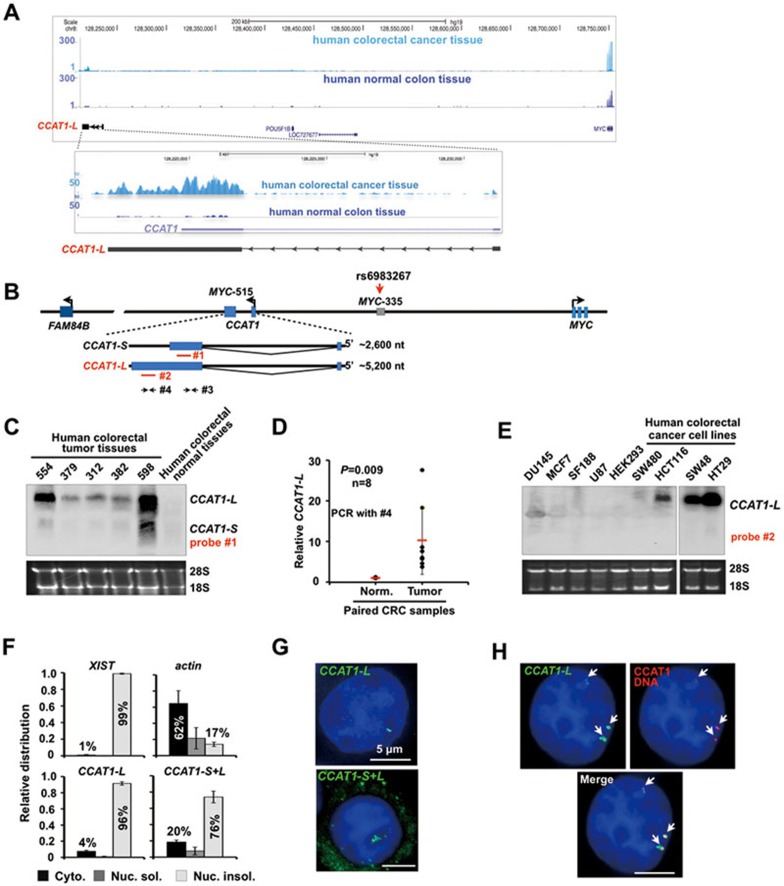
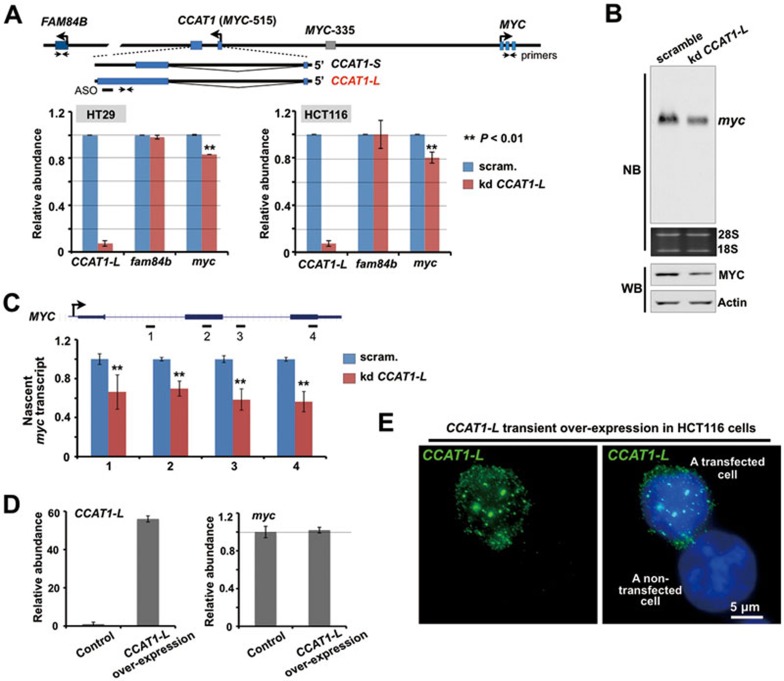
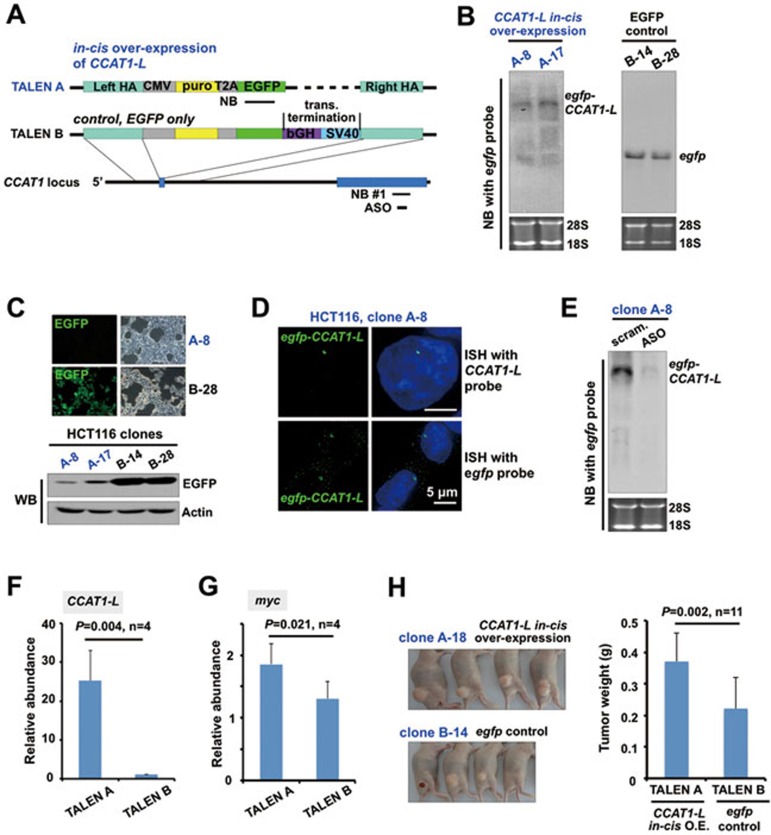
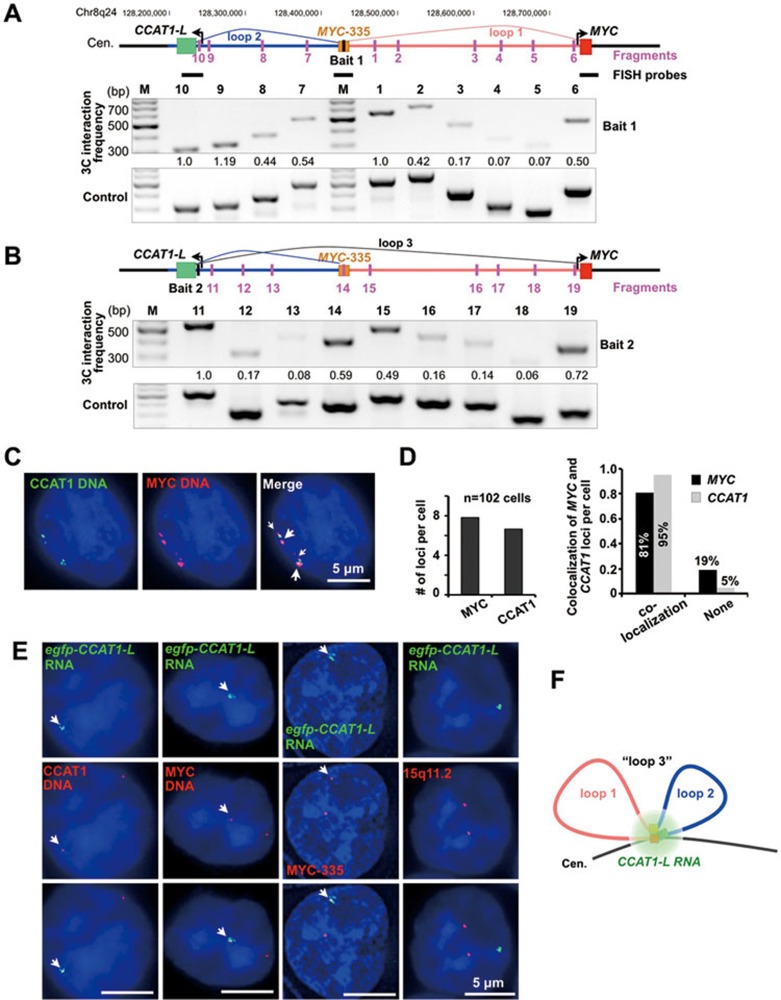
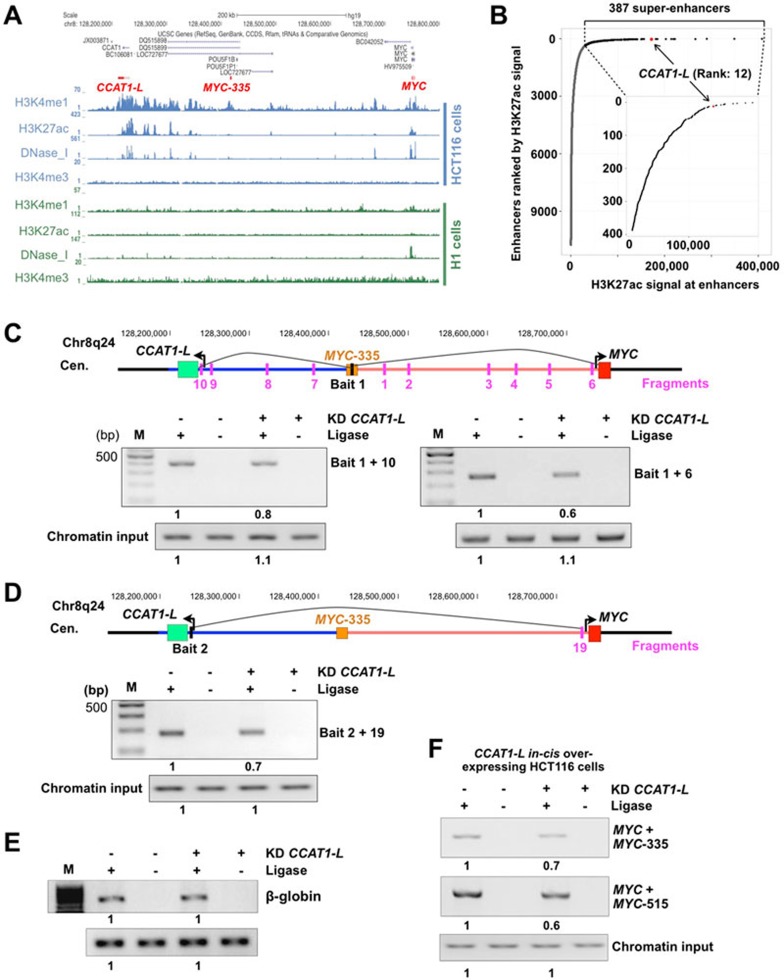
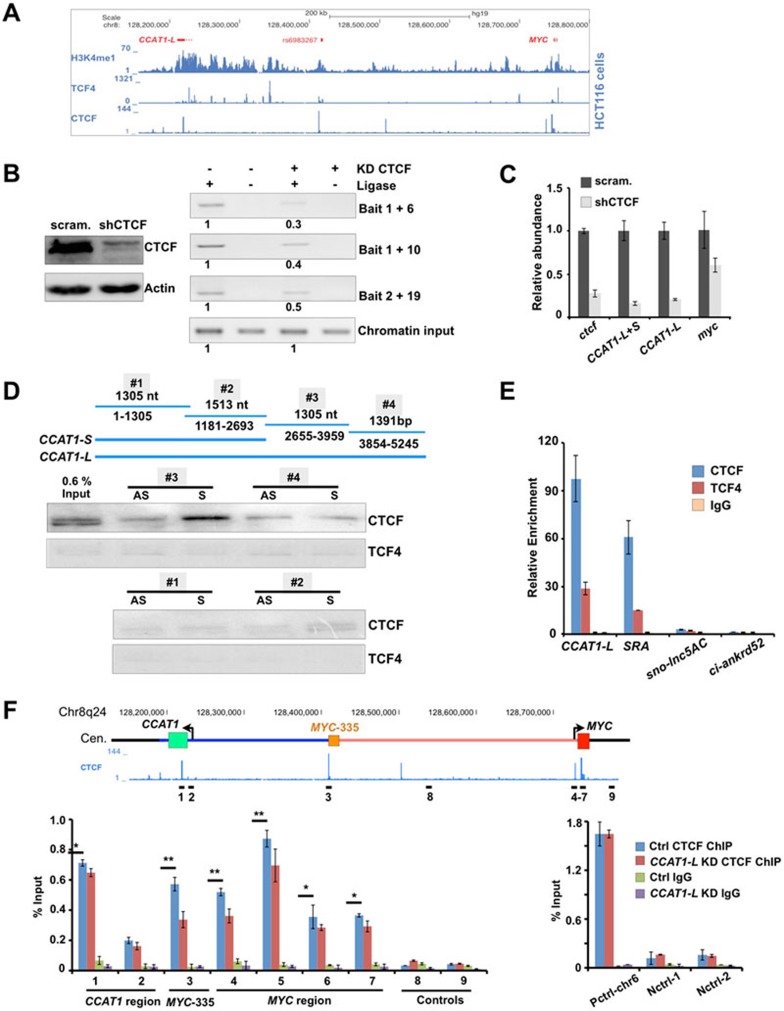
The human 8q24 gene desert contains multiple enhancers that form tissue-specific long-range chromatin loops with the MYC oncogene, but how chromatin looping at the MYC locus is regulated remains poorly understood. Here we demonstrate that a long noncoding RNA (lncRNA), CCAT1-L, is transcribed specifically in human colorectal cancers from a locus 515 kb upstream of MYC. This lncRNA plays a role in MYC transcriptional regulation and promotes long-range chromatin looping. Importantly, the CCAT1-L locus is located within a strong super-enhancer and is spatially close to MYC. Knockdown of CCAT1-L reduced long-range interactions between the MYC promoter and its enhancers. In addition, CCAT1-L interacts with CTCF and modulates chromatin conformation at these loop regions. These results reveal an important role of a previously unannotated lncRNA in gene regulation at the MYC locus.


Figures

Figure 1
Figure 1
CCAT1-L, a nuclear-retained lncRNA, is specifically expressed in human CRC tissue samples. (A) RNA-seq of paired CRC/control mucosa samples from a Chinese patient revealed that a novel lncRNA, CCAT1-L, is transcribed from a locus 515 kb upstream of the MYC locus (MYC-515) on 8q24. Note that we refer the previously annotated 2 600 nt CCAT1 as CCAT1-S throughout this study. (B) A schematic view of CCAT1 locus and its adjacent genomic information on 8q24. The locus 335 kb upstream of the MYC locus (MYC-335) contains an enhancer and a CRC risk SNP,. Red lines denote antisense (AS) probes recognizing either both CCAT1 isoforms (#1) or only CCAT1-L (#2) in northern blot; arrows denote PCR primer sets that recognize either both CCAT1 isoforms (#3) or only CCAT1-L (#4). (C) Northern blot validated CCAT1-L expression in human CRC patient samples. (D) The relative expression of CCAT1-L in CRC tissues and paired control mucosa samples from the same patients. The primer sets only recognizing CCAT1-L was used (#4 in B). P values from one-tailed t-test in the pairwise comparison are shown. (E) Northern blot confirmed CCAT1-L expression in human CRC cell lines. (F) CCAT1-L is associated with the nuclear insoluble fractions. Total RNAs from HT29 cells were separated into cytoplasmic, nuclear soluble, and nuclear insoluble fractions. Bar plots represent relative abundance of RNAs in the nuclear soluble and insoluble fractions as measured by RT-qPCR. #3 or #4 described in B were used to detect either both CCAT1 isofroms or CCAT1-L only. Error bars represent standard deviation (± SD) in triplicate experiments. (G) CCAT1-L is exclusively nuclear retained, while CCAT1-S is cytoplasmically distributed. RNA ISH (green) was performed with Dig-labeled probes (B) either recognizing CCAT1-L (top panel) or both isoforms of CCAT1 (bottom panel) in HT29 cells. (H) CCAT1-L accumulates at its site of transcription. Double FISH of CCAT1-L (green) and its adjacent DNA region (red). A single Z stack of representative images acquired with an Olympus IX70 DeltaVision Deconvolution System microscope is shown. DAPI is in blue and the white scale bar in all images denotes 5 μm. Representative images are shown (G, H). In C and E, 18S and 28S rRNAs were used as loading controls. Supportive data are included in Supplementary information, Figures S1 and S2.
Figure 2
Figure 2
CCAT1-L regulates MYC expression in cis. (A) Knockdown of CCAT1-L led to modestly reduced expression of MYC in both HT29 and HCT116 cells. Top, bars represent ASO and arrows represent primer sets. Bottom, bar plots represent relative expression of CCAT1-L, MYC and FAM84B 36 h post the ASO treatment (normalized to actin). (B) Northern blot and western blot (WB) revealed the reduced expression of MYC after knockdown of CCAT1-L in HT29 cells. Actin was used as a loading control in WB. (C) CCAT1-L regulates MYC expression at the transcriptional level. A crude preparation of nuclei was subjected to nuclear run-on assay under the indicated conditions in HT29 cells. Nascent transcription of MYC detected from scramble ASO-treated nuclei was defined as one. (D) Overexpression of CCAT1-L in trans in expression vector resulted in no apparent activation of MYC. Left, RT-qPCR validated the increased expression of CCAT1-L in the pEGFP-C1 vector in HCT116 cells. Right, the overexpression of CCAT1-L in HCT116 cells did not lead to increase of MYC expression, as revealed by RT-qPCR. (E) Overexpression of CCAT1-L in vectors resulted in aberrant localization in the nucleus. RNA ISH (green) was performed with a probe recognizing CCAT1-L (Figure 1B) in HCT116 cells transfected with the CCAT1-L-expressing vector. Note that the overexpressed CCAT1-L produced from transfection vectors assembled as numerous nuclear dots. Representative images are shown. Scale bar, 5 μm. Error bars in A, C and D represent ± SD in triplicate experiments. In A and C, P values from one-tailed t-test in the pairwise comparison are shown.
Figure 3
Figure 3
In cis overexpression of CCAT1-L enhances MYC expression and tumorigenesis. (A) A schematic view of the strategy to in cis express CCAT1-L in HCT116 cells by TALEN. TALEN A, the CCAT1-L in cis overexpression cell line. A cassette of CMV promoter and sequences of puromycin and egfp mRNAs was inserted just upstream of the first exon of CCAT1 by TALEN. TALEN B, the control cell line that overexpresses egfp. The same cassette of TALEN A but with two additional poly(A) sites to terminate the transcription downstream of egfp was inserted into the same genomic location as that in TALEN A (see Supplementary information, Figure S3 for details). Note that the transcription occurred in both egfp-CCAT1-L- and egfp-overexpressing cell lines. (B) Northern blot validated the overexpression of egfp-CCAT1-L (left panel) or egfp (right panel) in different TALEN lines by using a probe recognizing egfp shown in A. (C) In cis overexpressed egfp-CCAT1-L (B) was poorly translated into EGFP due to its nuclear retention, while the overexpressed egfp was efficiently translated into EGFP. Fluorescence microscopy (top) and WB (bottom) of representative TALEN A or TALEN B lines are shown. (D) Nuclear-retained egfp-CCAT1-L exclusively accumulated as a single nuclear dot, as revealed by ISH probes recognizing either CCAT1-L or egfp in the representative TALEN A clone. (E) Northern blot validated that egfp-CCAT1-L can be efficiently knocked down by the ASO that targets CCAT1-L, assayed with a probe recognizing egfp. (F) RT-qPCR revealed the overexpression of CCAT1-L in TALEN A lines, but not in control TALEN B lines (normalized to actin and the non-engineered HCT116 cells). Four lines of TALEN A and TALEN B cells were analyzed individually. (G) In cis overexpression of egfp-CCAT1-L enhanced MYC expression, as revealed by RT-qPCR (normalized to actin and the non-engineered HCT116 cells). The same lines of TALEN A and TALEN B cells in F were analyzed. (H) In cis overexpression of egfp-CCAT1-L increased tumor formation in a mouse xenograft model. Xenograft tumors were collected 4 weeks after inoculation of cells. Left, representative xenograft tumors generated from a TALEN A and a TALEN B line are shown. Right, comparison was made between the egfp-CCAT1-L in cis overexpressing TALEN A lines and the egfp in cis overexpressed TALEN B lines. Note that xenograft tumors raised from individual in cis egfp-CCAT1-L-overexpressing HCT116 cell lines were larger than those raised from control TALEN-engineered cell lines. Error bars in F-H represent ± SD in indicated multiple experiments. P values from one-tailed t-test in the pairwise comparison are shown. 18S and 28S rRNAs were used as loading controls in all northern blots. Supportive data are included in Supplementary information, Figures S1-S4.
Figure 4
Figure 4
The long-range interaction between the MYC promoter and its upstream regulatory elements. (A) The existence of multiple chromatin loops in the upstream region of MYC in HT29 cells. Physical map of the region spanning a 550 kb distance with CCAT1-L (MYC-515) at one end and MYC at the other, interrogated by 3C. Top, the position of the constant fragment containing MYC-335, a known region that is looping with the MYC promoter, is marked by a black bar (bait 1); positions of HindIII restriction target fragments are marked by pink bars and primers were designed accordingly. Bottom, 3C interaction frequencies of the constant fragment with other fragments revealed the increased interaction between MYC-335 and MYC promoter and between MYC-335 and MYC-515. 3C products were confirmed by Sanger sequencing (examples were shown in Supplementary information, Figure S5B). The relative abundance of each 3C PCR product was determined using ImageJ, normalized by each corresponding input signal and the bait PCR product (set as 1.0), and labeled underneath. (B) The chromatin loops in the upstream region of MYC. Top, the position of the constant fragment containing CCAT1-L locus (MYC-515) is marked by a black bar (bait 2); see A for details. (C) Double DNA FISH of CCAT1-L (green) and MYC (red) genomic loci in HT29 cells. FISH probes are labeled as black bars in A. White arrows indicate the co-localized loci from a representative cell. (D) The majority of CCAT1-L and MYC genomic regions are spatially close. Left, each HT29 cell contains multiple CCAT1-L and MYC loci, and the number of each locus per cell was calculated from totally 102 cells counted. Right, the majority of CCAT1-L loci in HT29 cells co-localize with MYC loci. (E) CCAT1-L RNA accumulates to chromatin regions at or near the MYC locus. Double FISH of egfp-CCAT1-L (green) with CCAT1-L DNA region, MYC locus and MYC-335 region revealed the co-localization of egfp-CCAT1-L with these loci, but not with 15q11-13. Position-specific 10-15 kb probes (shown in A) or a probe recognizing15q11-13 were used in DNA FISH. White arrows indicate the single-allele overexpressing egfp-CCAT1-L or its co-localized DNA regions in representative cells. (F) A schematic drawing of chromatin loops at the MYC locus. Loop 1 (pink line) is between the MYC promoter (red box) and MYC-335 (brown box); loop 2 (blue line) is between MYC-335 and MYC-515 (green box); the spatially close localization of loop 1 and loop 2 resulted in the chromatin looping between the MYC promoter and MYC-515, which is “loop 3”. In C and E, a single Z stack of representative images acquired with an Olympus IX70 DeltaVision Deconvolution System microscope is shown. Supportive data are included in Supplementary information, Figure S5.
Figure 5
Figure 5
CCAT1-L is required to maintain the chromatin looping at the MYC locus. (A) The chromatin region between MYC-515 and MYC-335 exhibits strong characteristics of a super-enhancer in HCT116 cells but not in H1 cells (histone modifications data were retrieved from ENCODE collection). CCAT1-L, MYC-335 and MYC loci are highlighted in red. (B) Distribution of H3K27ac signal across enhancers (outer figure) and super-enhancers (inner figure) in HCT116 cells. Rank and H3K27ac signal of enhancers and super-enhancers were downloaded from the literature. 387 super-enhancers (black points) were identified from uneven distribution of H3K27ac signal among normal enhancers (grey points), and the CCAT1-L-associated super-enhancer (red point) is ranked as #12 super-enhancers with high H3K27ac signals. (C, D) Knockdown of CCAT1-L reduced the chromatin looping at the MYC locus. The long-range interaction frequencies between three chromatin regions (MYC-335/MYC, MYC-335/MYC-515, and MYC/MYC-515) were reduced after knockdown of CCAT1-L as revealed by 3C assays in HT29 cells. Over 90% of CCAT1-L was depleted after the ASO treatment in 3C assays (data not shown). (E) Knockdown of CCAT1-L has no effect on the chromatin looping at the β-globin locus. The same HindIII restriction fragments were designed for 3C primers and PCRs were performed at the same time as C and D. (F) Knockdown of CCAT1-L reduced the chromatin looping at the MYC locus in HCT116 cell line with CCAT1-L in cis overexpression. The long-range interaction frequencies between the chromatin regions examined in B and C were also reduced after knockdown of CCAT1-L in the HCT116 cell line as revealed by 3C assays. In C-F, the relative abundance of each 3C PCR product was determined using ImageJ and labeled underneath. 3C experiments were repeated three times. Supportive data are included in Supplementary information, Figures S5 and S6.
Figure 6
Figure 6
CCAT1-L interacts with CTCF and modulates CTCF binding to chromatin. (A) ChIP-seq revealed that TCF4 and CTCF are enriched at 8q24 in HCT116 cells (ChIP-seq data were retrieved from ENCODE collection). (B) CTCF is required for chromatin looping at 8q24. Left, knockdown of CTCF was achieved using shRNA against CTCF as confirmed by WB. Right, the long-range interaction frequencies between three chromatin regions (MYC-335/MYC, MYC-335/MYC-515, and MYC/MYC-515, primers used in Figure 4) were reduced after knockdown of CTCF as revealed by 3C assays in HT29 cells. The relative abundance of each 3C PCR product was determined using ImageJ and labeled underneath. 3C experiments were repeated for three times. (C) CTCF is required for MYC and CCAT1-L expression. The relative abundance of MYC and CCAT1-L was analyzed by RT-qPCR in control and CTCF-knockdown HT29 cells. (D) CCAT1-L and CTCF interact in vitro. Top, a schematic view of four overlapping CCAT1-L RNA fragments for IVT. Bottom, biotin-labeled RNA pull-down assay using different fragments of CCAT1-L transcript in HT29 nuclear extracts showed that one fragment of CCAT1-L binding to CTCF. No CCAT1-L fragment was specifically associated with TCF4. (E) Interaction between endogenous CCAT1-L and CTCF was confirmed by RNA immunoprecipitation (RIP). RIP was performed with HT29 cells after UV crosslinking by using anti-CTCF, anti-TCF4 and anti-IgG, followed by RT-qPCR. Bar plots represent fold enrichments of RNAs immunoprecipitated by each indicated antibody over anti-IgG. SRA, steroid receptor RNA activator; sno-lnc5AC, H/ACA sno-lncRNA; ci-ankrd52, a circular intronic RNA. (F) CCAT1-L modulates CTCF binding to chromatin. Knockdown of CCAT1-L reduced the interaction of CTCF to its occupied sites in chromatin. ChIP with anti-CTCF in scramble- and CCAT1-L ASO-treated HT29 cells. Data were expressed as the percentage of CTCF co-precipitating DNAs in MYC promoter, MYC-335, MYC-515 regions and negative CTCF binding sites on 8q24, versus input under each indicated condition (left). Control CTCF ChIPs were performed on positive and other negative CTCF binding sites (right). P values from one-tailed t-test in the pairwise comparison are shown (*P < 0.05, **P < 0.01). In E and F, error bars represent ± SD in triplicate experiments. Supportive data are included in Supplementary information, Figure S6.

Comment in

  • 'Lnc'-ing enhancers to MYC regulation.
    Younger ST, Rinn JL. Younger ST, et al. Cell Res. 2014 Jun;24(6):643-4. doi: 10.1038/cr.2014.54. Epub 2014 Apr 29. Cell Res. 2014. PMID: 24777251 Free PMC article.

References

    1. Rinn JL, Chang HY. Genome regulation by long noncoding RNAs. Annu Rev Biochem. 2012;81:145–166. - PMC - PubMed
    1. Ulitsky I, Bartel DP. lincRNAs: genomics, evolution, and mechanisms. Cell. 2013;154:26–46. - PMC - PubMed
    1. Gutschner T, Diederichs S. The hallmarks of cancer: a long non-coding RNA point of view. RNA Biol. 2012;9:703–719. - PMC - PubMed
    1. Gupta RA, Shah N, Wang KC, et al. Long non-coding RNA HOTAIR reprograms chromatin state to promote cancer metastasis. Nature. 2010;464:1071–1076. - PMC - PubMed
    1. Huarte M, Guttman M, Feldser D, et al. A large intergenic noncoding RNA induced by p53 mediates global gene repression in the p53 response. Cell. 2010;142:409–419. - PMC - PubMed

Publication types

MeSH terms

Associated data