. 2014 Mar 25:4:4457.
doi: 10.1038/srep04457.

A novel, visible light-induced, rapidly cross-linkable gelatin scaffold for osteochondral tissue engineering

Affiliations

A novel, visible light-induced, rapidly cross-linkable gelatin scaffold for osteochondral tissue engineering

Tetsuro Mazaki et al. Sci Rep. .

Abstract

Osteochondral injuries remain difficult to repair. We developed a novel photo-cross-linkable furfurylamine-conjugated gelatin (gelatin-FA). Gelatin-FA was rapidly cross-linked by visible light with Rose Bengal, a light sensitizer, and was kept gelled for 3 weeks submerged in saline at 37°C. When bone marrow-derived stromal cells (BMSCs) were suspended in gelatin-FA with 0.05% Rose Bengal, approximately 87% of the cells were viable in the hydrogel at 24 h after photo-cross-linking, and the chondrogenic differentiation of BMSCs was maintained for up to 3 weeks. BMP4 fusion protein with a collagen binding domain (CBD) was retained in the hydrogels at higher levels than unmodified BMP4. Gelatin-FA was subsequently employed as a scaffold for BMSCs and CBD-BMP4 in a rabbit osteochondral defect model. In both cases, the defect was repaired with articular cartilage-like tissue and regenerated subchondral bone. This novel, photo-cross-linkable gelatin appears to be a promising scaffold for the treatment of osteochondral injury.


Figures

Figure 1
Figure 1. Properties of modified gelatin.
(a) Synthetic scheme of modified gelatin and the cross-linking mechanism. (b) 1H-NMR spectra of gelatin in D2O before and after modification. (c) Time course of gel formation of furfuryl-conjugated gelatin (gelatin-FA and gelatin-FI, each 10%) with Rose Bengal (0.5%) after visible light illumination.
Figure 2
Figure 2. Storage (G′) and loss (G″) moduli of gelatin-FA and gelatin-FI hydrogels (10%) at 37°C cross-linked by visible light in the presence of Rose Bengal (0.5%).
Figure 3
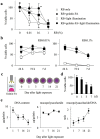
Figure 3. Cytotoxicity and phototoxicity.
(a) BMSCs (5 × 10³ cells) were cultured in gelatin-FA (15%) and various concentrations of RB (0.01, 0.1, and 1%) and gelled by illumination with visible light for 2 min. After 24 h, the % cell viability was determined. *P < 0.05, **P < 0.001, vs. RB + light illumination (5 wells each, Mann–Whitney U test). (b) BMSCs (5 × 10³ cells) were cultured in gelatin-FA (15%) plus RB (0.01 or 0.1%). The % viable cells were monitored at 24 h, 72 h and on day 7 after light illumination with visible light for 2 min. Open circle; RB only, closed circle; RB + gelatin-FA, open square; RB + light illumination, closed square; RB + gelatin-FA + light illumination (5 well each). (c) Gelatin-FA (15%) with 0.05% RB was submerged in PBS, and exposed to visible light for 2 min, after which the hydrogels were observed for 21 days at 37°C. Representative photographs (5 wells each) are shown. (d) BMSCs (5 × 10³ cells) were suspended in gelatin-FA (15%) with 0.05% RB, submerged in PBS, and exposed to visible light for 2 min, after which the hydrogels were observed for 7 days at 37°C. The percent viable cells in the hydrogels were examined at indicated time-points after the light illumination (5 wells each). (e) BMSCs (5 × 10⁴ cells) were suspended in gelatin-FA (15%) and 0.05% RB, submerged in PBS, and gelled by illumination with visible light for 2 min. DNA and acidic mucopolysaccharide contents in the gelatin-FA hydrogels were measured at indicated time-points. The resultant acidic mucopolysaccharide-to-DNA ratio was then calculated (5 wells each).
Figure 4
Figure 4. Gelatin-FA as a cell scaffold in an osteochondral defect model.
BMSCs (1.5 × 10⁵ cells) were suspended in gelatin solution (15% gelation-FA + 0.05% RB), implanted into osteochondral defects, and exposed to visible light for 2 min. (a) Schematic illustration of the operative procedure. (b) Gross appearance after the procedure. Representative photographs (six femurs each). (c) Gross grading scores at 4 and 12 weeks after the surgery. *P < 0.05, **P < 0.01, ***P < 0.001 (six femurs each). (d) Representative safranin O staining photos at 4 and 12 weeks are shown (six femurs each). The scale bar indicates 500 μm. (e) Representative macrophage staining photos at 4 weeks are shown (six femurs each). The scale bar indicates 200 μm. (f) Histological grading scores at 4 and 12 weeks. *P < 0.05, **P < 0.01, ***P < 0.001 (six femurs each). (g, h) Representative type II collagen immunostaining (g) and aggrecan staining (h) at 12 weeks after the surgery are shown (six femurs each). The scale bar indicates 500 μm (g) and 200 μm (h).
Figure 5
Figure 5. Micro-computed tomography (CT) analysis at 12 weeks after BMSCs implantation.
(a) Representative three-dimensional-CT images from each group (six femurs each) are shown. (b) Bone growth was assessed by bone volume (BV) per tissue volume (TV). *P < 0.05, **P < 0.01 (six femurs each).
Figure 6
Figure 6. Gelatin-FA as a growth-factor scaffold in an osteochondral defect model.
BMP4 or CBD-BMP4 (each 250 nM) was mixed into 15% gelatin-FA containing 0.05% RB, and the mixtures were implanted into osteochondral bone defects and exposed to visible light for 2 min. (a) Representative photographs of the gross appearance after the procedure (five femurs each). (b) Gross grading scores at 4 and 12 weeks after the procedure (five femurs each). (c) Representative images of safranin O staining (five femurs each). The scale bar indicates 500 μm. (d) Histological grading scores at 4 and 12 weeks (five femurs each). (e) The expression levels of chondrogenic factors at 4 weeks (5 femurs each). *P < 0.05, **P < 0.01, ***P < 0.001 (five femurs each). ****P < 0.05, vs. untreated control (five femurs each, Mann–Whitney U Test).
Figure 7
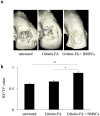
Figure 7. Micro-computed tomography (CT) analysis at 12 weeks after BMP4 or CBD-BMP4 implantation.
(a) Representative three-dimensional-CT images from each group (five femurs each). (b) Bone growth was assessed by bone volume (BV) per tissue volume (TV). *P < 0.05, **P < 0.01, ***P < 0.001 (five femurs each).

References

    1. Buckwalter J. A., Mankin H. J. & Grodzinsky A. J. Articular cartilage and osteoarthritis. Instr Course Lect 54, 465–480 (2005). - PubMed
    1. Mandelbaum B. R. et al. Articular cartilage lesions of the knee. Am J Sports Med 26, 853–861 (1998). - PubMed
    1. Buckwalter J. A., Martin J. A. & Brown T. D. Perspectives on chondrocyte mechanobiology and osteoarthritis. Biorheology 43, 603–609 (2006). - PubMed
    1. Nukavarapu S. P. & Dorcemus D. L. Osteochondral tissue engineering: Current strategies and challenges. Biotechnol Adv 31, 706–721 (2013). - PubMed
    1. Panseri S. et al. Osteochondral tissue engineering approaches for articular cartilage and subchondral bone regeneration. Knee Surg Sports Traumatol Arthrosc 20, 1182–1191 (2012). - PubMed

Publication types

LinkOut - more resources