. 2014 Mar 24;9(3):e85345.
doi: 10.1371/journal.pone.0085345. eCollection 2014.

Interleukin-6 modulation of intestinal epithelial tight junction permeability is mediated by JNK pathway activation of claudin-2 gene

Affiliations

Interleukin-6 modulation of intestinal epithelial tight junction permeability is mediated by JNK pathway activation of claudin-2 gene

Rana Al-Sadi et al. PLoS One. .

Abstract

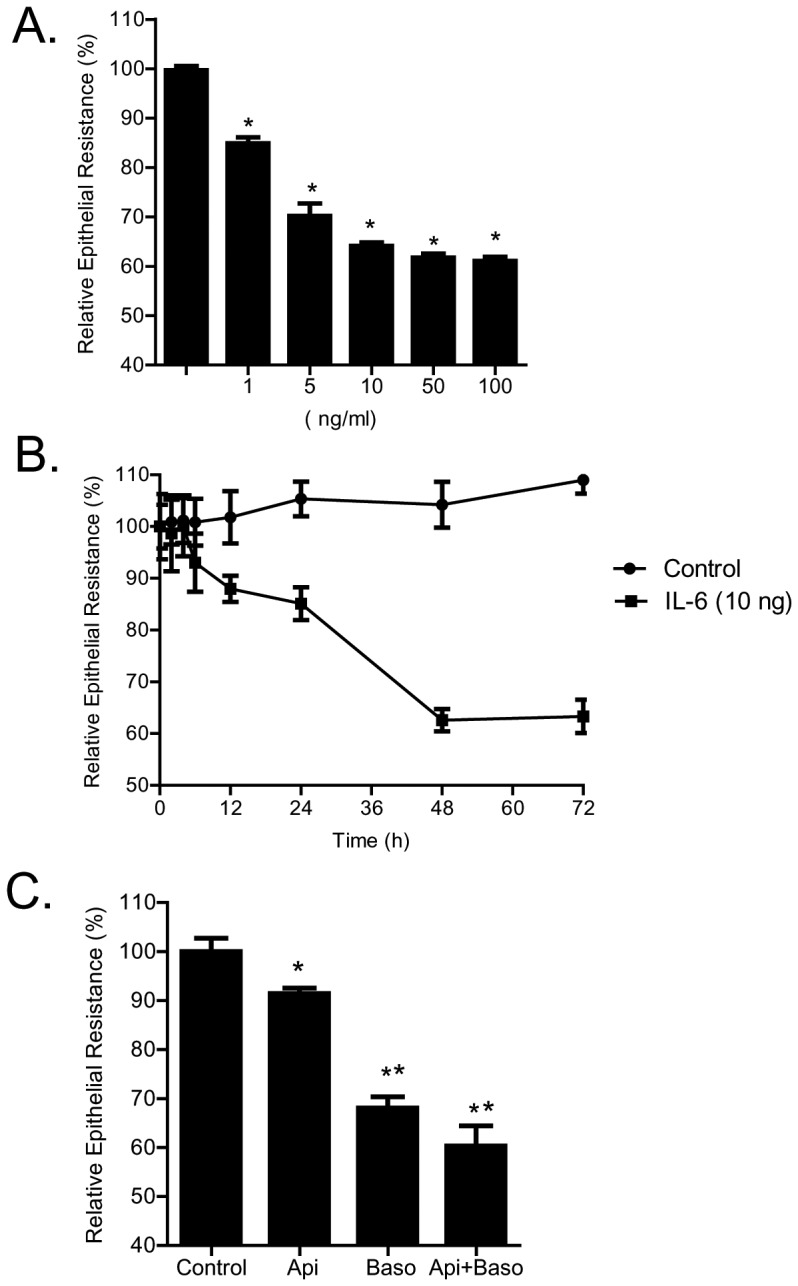
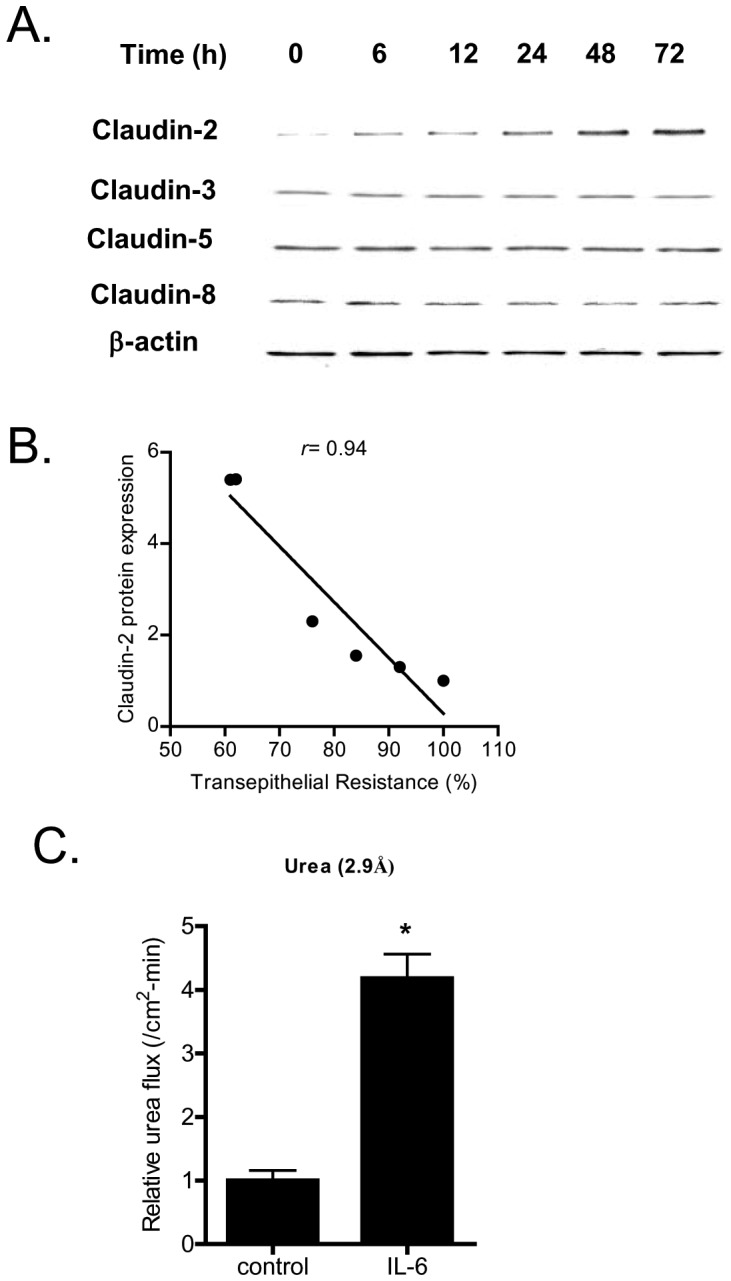
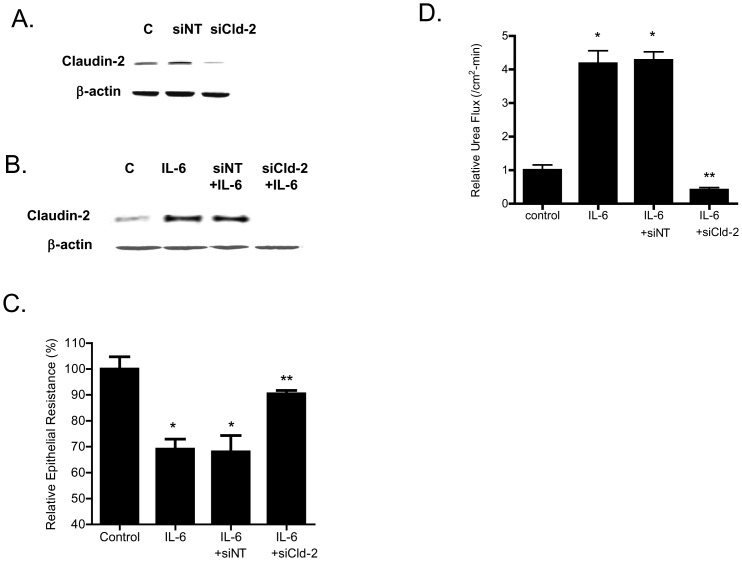
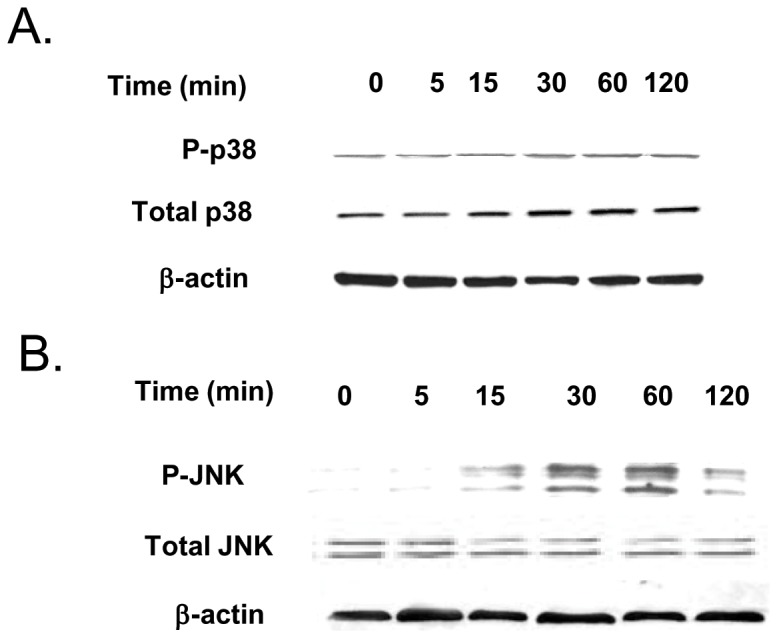
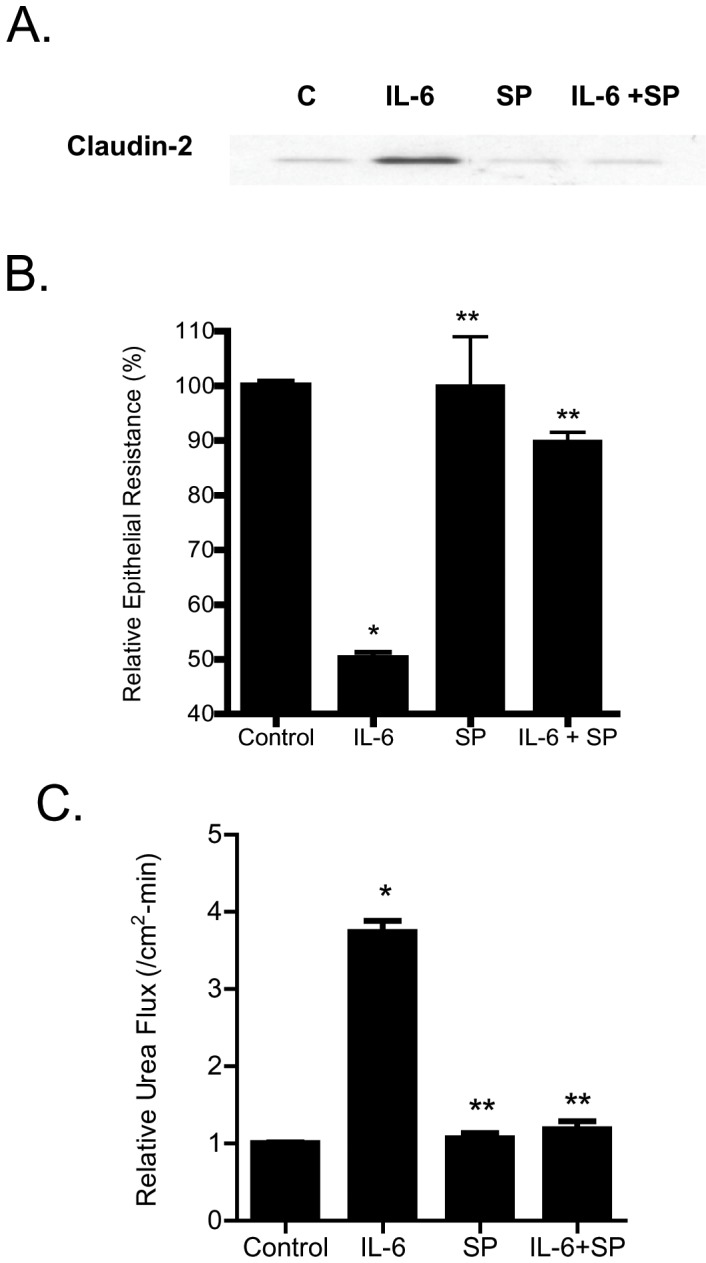
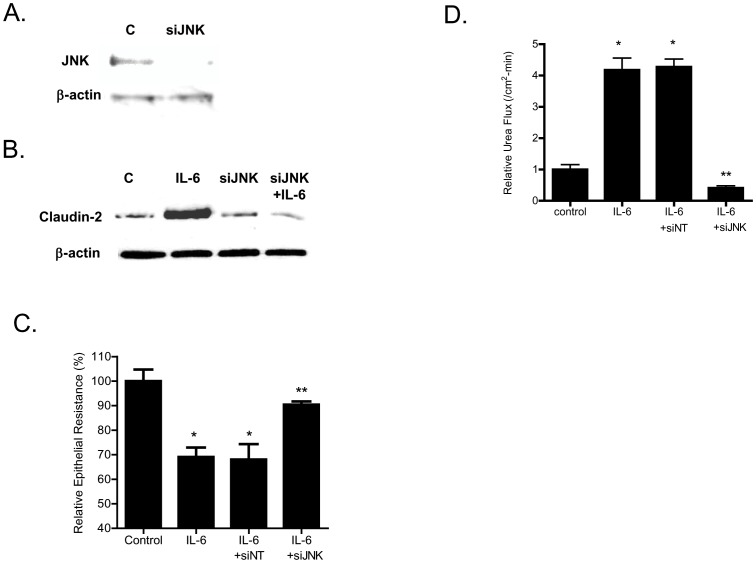
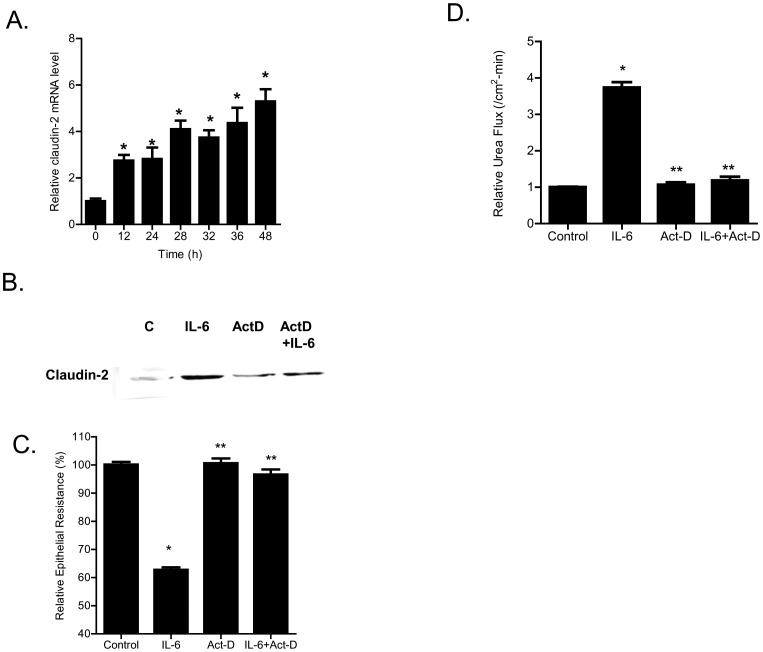
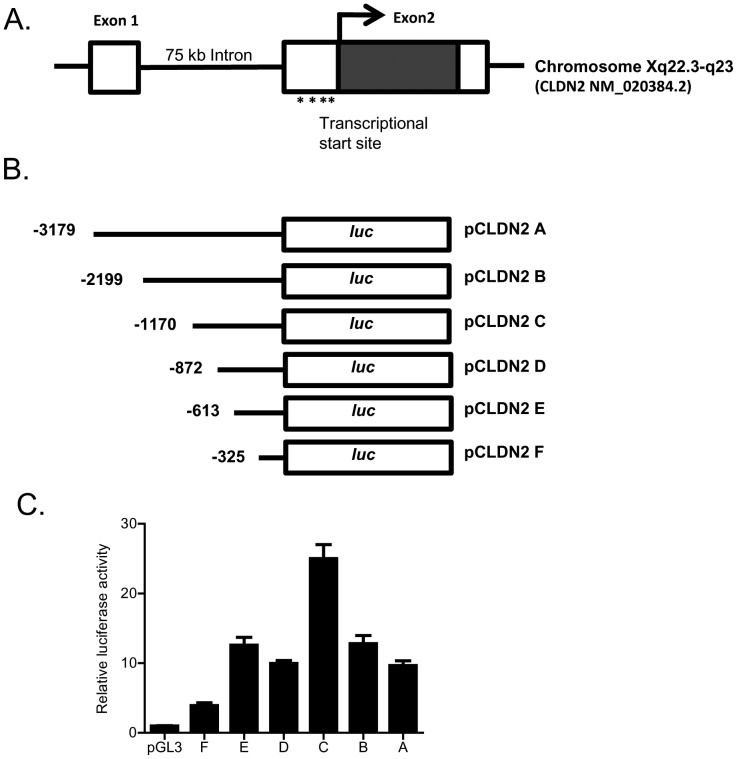
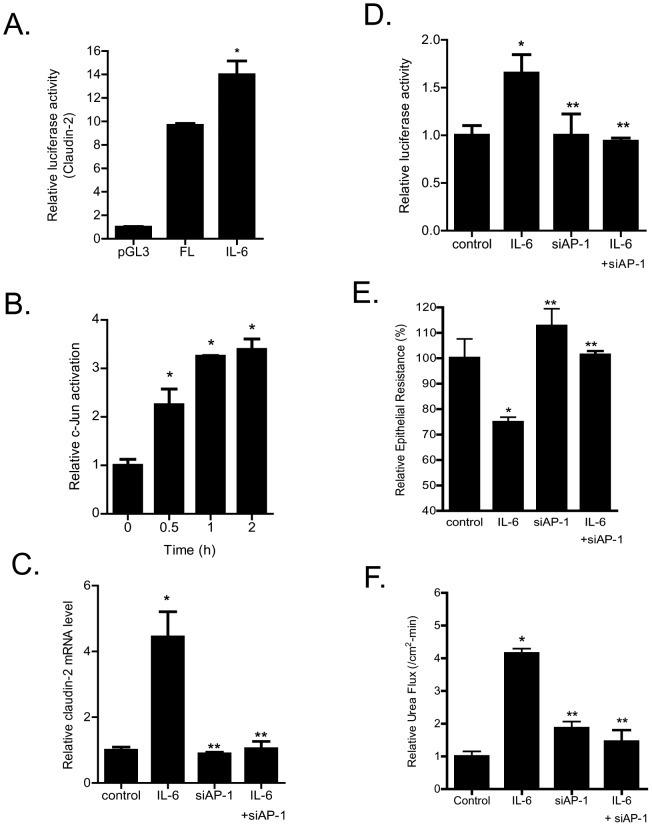
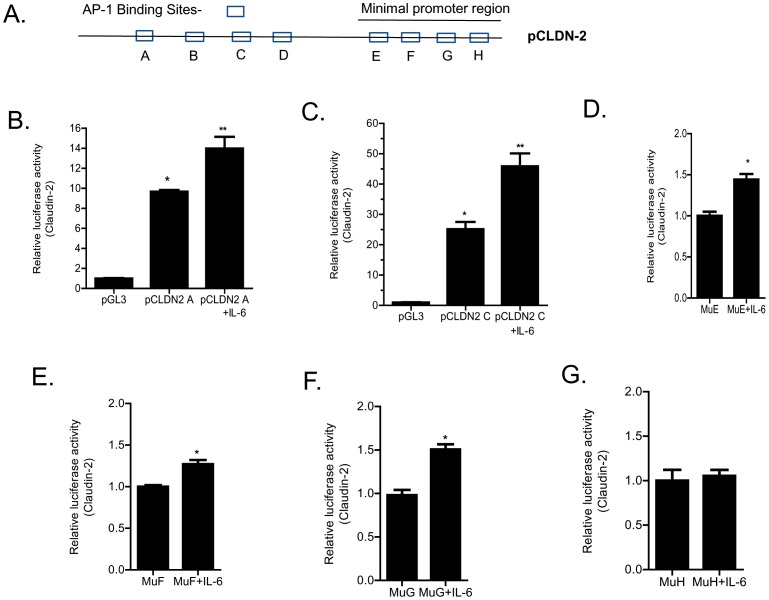
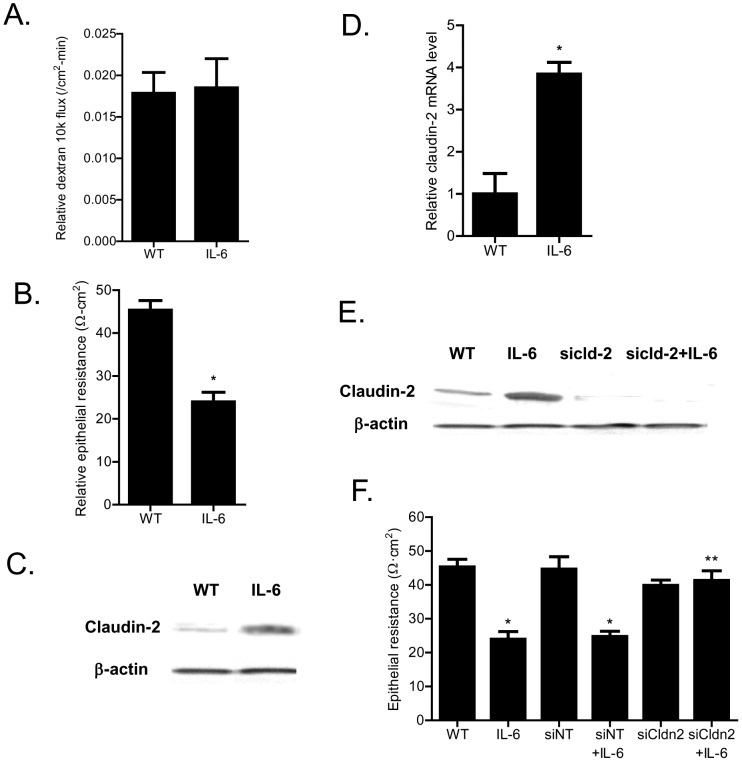
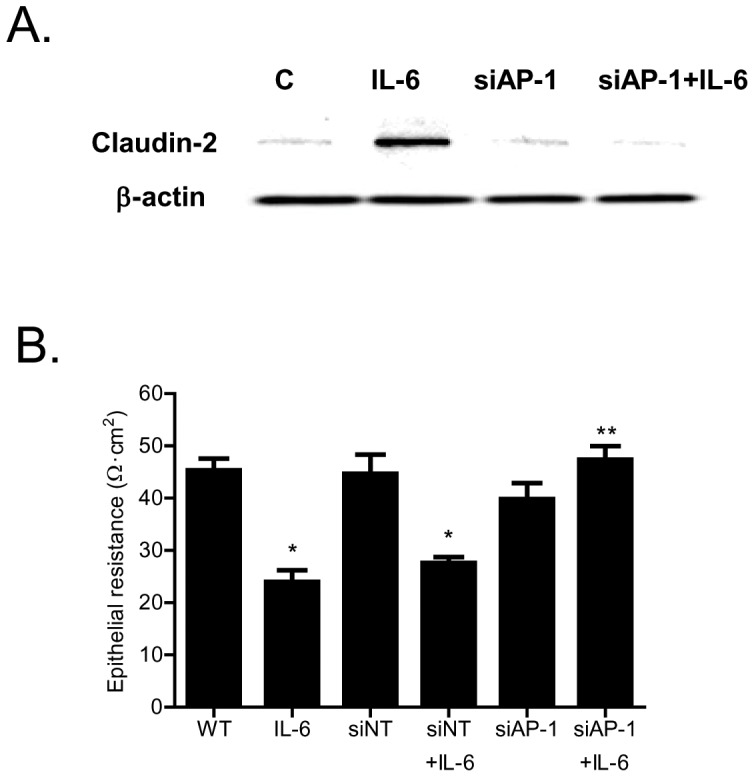
Defective intestinal epithelial tight junction (TJ) barrier has been shown to be a pathogenic factor in the development of intestinal inflammation. Interleukin-6 (IL-6) is a pleiotropic, pro-inflammatory cytokine which plays an important role in promoting inflammatory response in the gut and in the systemic circulation. Despite its key role in mediating variety inflammatory response, the effect of IL-6 on intestinal epithelial barrier remains unclear. The purpose of this study was to investigate the effect of IL-6 on intestinal epithelial TJ barrier and to delineate the intracellular mechanisms involved using in-vitro (filter-grown Caco-2 monolayers) and in-vivo model (mouse intestinal perfusion) systems. Our results indicated that IL-6 causes a site-selective increase in Caco-2 intestinal epithelia TJ permeability, causing an increase in flux of small-sized molecules having molecular radius <4 Å. The size-selective increase in Caco-2 TJ permeability was regulated by protein-specific increase in claudin-2 expression. The IL-6 increase in TJ permeability required activation of JNK signaling cascade. The JNK pathway activation of AP-1 resulted in AP-1 binding to its binding sequence on the claudin-2 promoter region, leading to promoter activation and subsequent increase in claudin-2 gene transcription and protein synthesis and TJ permeability. Our in-vivo mouse perfusion showed that IL-6 modulation of mouse intestinal permeability was also mediated by AP-1 dependent increase in claudin-2 expression. In conclusion, our studies show for the first time that the IL-6 modulation of intestinal TJ permeability was regulated by JNK activation of AP-1 and AP-1 activation of claudin-2 gene.


Conflict of interest statement

Competing Interests: The authors have declared that no competing interests exist.

Figures

Figure 1
Figure 1. Effect of IL-6 on trans-epithelial electrical resistance (TER) in Caco-2 intestinal epithelial monolayers.
(A) IL-6 caused a dose-dependent decrease in TER over 48-h experimental period (n = 4). *p<0.001 vs. control. (B) IL-6 (10 ng/ml) caused a time-dependant decrease in Caco-2 TER (n = 4). (C) Membrane specificity of IL-6 effect on Caco-2 epithelial resistance. IL-6 (10 ng/ml) was added to either apical, basolateral, or combined apical and basolateral compartments (n = 4). *, p<0.05 vs. control; **, p<001 vs. IL-6 addition to apical compartment alone.
Figure 2
Figure 2. Effect of IL-6 on Caco-2 tight junction proteins expression.
(A) IL-6 caused a time-dependent increase in claudin-2 protein expression but not claudins 3, 5, and 8 as assessed by Western Blot analysis. (B) Graph of claudin-2 protein expression vs. relative decrease in transepithelial resistance following IL-6 treatment (relative correlation coefficient, r = 0.94). (C) IL-6 treatment (10 ng/ml) of Caco-2 monolayers over 48 h experimental period induced a significant increase in mucosal-to-serosal urea flux (n = 4). *, p<0.001 vs. control.
Figure 3
Figure 3. Effect of siRNA- induced knock-down of claudin-2 on Caco-2 intestinal epithelial permeability.
(A) SiRNA claudin-2 transfection resulted in a near-complete depletion of claudin-2 expression as assessed by Western blot analysis (4 days post-transfection). (B) IL-6 caused an increase in claudin-2 protein expression. Knocking-down claudin-2 by siRNA transfection prevented the IL-6 induced increase in claudin-2 expression as assessed by Western Blot analysis. (C) siRNA induced knock down of claudin-2 prevented the IL-6 induced drop in Caco-2 TER. (n = 6). *, p<0.001 vs. control; **, p<001 vs. IL-6 treatment. (D) Claudin-2 depletion prevented the IL-6 induced increase in urea flux across Caco-2 monolayers. (n = 6). *, p<0.001 vs. control; **, p<001 vs. IL-6 treatment.
Figure 4
Figure 4. Effect of IL-6 on activation of the p38 kinase and JNK phosphorylation.
(A) IL-6 treatment of Caco-2 monolayers did not affect the phosphorylation of p38 kinase as assessed by Western Blot of phosph-p38 kinase. (B) IL-6 treatment caused a time-dependent increase in JNK phosphorylation in Caco-2 monolayers.
Figure 5
Figure 5. Effect of inhibition of JNK pathway on IL-6 induced increase in Caco-2 TJ permeability.
(A) Pre-treatment with JNK inhibitor SP-600125 (25 µM) prevented the IL-6 induced increase in claudin-2 protein expression. (B) SP-600125 pre-treatment prevented the IL-6 induced drop in Caco-2 TER (n = 6). *, p<0.001 vs. control; **, p<001 vs. IL-6 treatment. (C) SP-600125 pre-treatment prevented the IL-6 induced increase in urea flux in filter-grown Caco-2 monolayers. (n = 6). *, p<0.001 vs. control; **, p<001 vs. IL-6 treatment.
Figure 6
Figure 6. Effect of siRNA- induced knock-down of JNK on Caco-2 intestinal epithelial permeability.
(A) JNK siRNA transfection resulted in a near-complete depletion of JNK expression. (B) SiRNA-induced knock down of JNK prevented the IL-6 induced increase in claudin-2 expression. (C) SiRNA induced knock down of JNK abolished the IL-6 induced drop in Caco-2 TER (n = 4). *, p<0.001 vs. control; **, p<001 vs. IL-6 treatment. (D) JNK siRNA transfection prevented the IL-6 increase in urea flux in Caco-2 monolayers (n = 4). *, p<0.001 vs. control; **, p<001 vs. IL-6 treatment.
Figure 7
Figure 7. Effect of mRNA transcription inhibitor on IL-6 induced increase in Caco-2 TJ permeability.
(A) IL-6 caused a time-dependent increase in claudin-2 mRNA expression as assessed by real-time PCR (n = 8). *, p<0.001 vs. control. (B) mRNA polymerase inhibitor actinomycin-D (100 µg/ml) prevented the IL-6 induced increase in claudin-2 protein expression as assessed by Western Blot analysis. (C) Pre-treatment with actinomycin-D prevented the IL-6 induced drop in Caco-2 TER (n = 4). *, p<0.001 vs. control; **, p<0.001 vs. IL-6 treatment. (D) Pre-treatment with actinomycin-D also prevented the IL-6 induced increase in urea flux in Caco-2 monolayers (n = 4). *, p<0.001 vs. control; **, p<0.001 vs. IL-6 treatment.
Figure 8
Figure 8. Determination of claudin-2 minimal promoter region.
(A) Schematic diagram showing claudin-2 gene mapped to chromosome Xq22.3-q23 region, and organized into 2 exons. The transcription and translation start sites were located in exon 2. The exon 1 and exon 2 were separated by 7.5 kb intron. The 5′ untranslated region was located in exon 1. (B) Schematic diagram showing the deletion constructs of claudin-2 gene that were generated. (C) Transfection of FL and deletion constructs of claudin-2 promoter in Caco-2 monolayers. Transfection of full length (pCLDN2 A) promoter region caused a 10-fold increase in the luciferase activity compared to the pGL3 basic vector alone when transfected into the Caco-2 cells (n = 8). The deletion construct −1170 (pCLDN2 C) exhibited the maximal promoter activity (n = 8). *, p<0.05 vs. pGL3; **, p<0.001 vs. full length promoter region.
Figure 9
Figure 9. Effect of siRNA induced AP-1 knock-down on IL-6 increase in claudin-2 promoter activity and Caco-2 TJ permeability.
(A) IL-6 caused a significant increase in claudin-2 promoter activity as assessed by luciferase assay (n = 8). *, p<0.001 vs. control. (B) IL-6 caused a time-dependent increase in c-JUN DNA binding to AP-1 standard DNA site as assayed by ELISA-based DNA binding assay (n = 6). *, p<0.001 vs. control. (C) siRNA induced knock-down of AP-1 prevented the IL-6 increase in claudin-2 mRNA expression (n = 8). *, p<0.0001 vs. control; **, p<0.0001 vs. IL-6 treatment. (D) AP-1 depletion by siRNA transfection prevented the IL-6 induced increase in claudin-2 promoter activity (n = 4). *, p<0.001 vs. control; **, p<0.001 vs. IL-6 treatment. (E) siRNA induced knock down of AP-1 abolished the IL-6 induced drop in Caco-2 TER (n = 4). *, p<0.001 vs. control; **, p<001 vs. IL-6 treatment. (F) Knocking-down AP-1 by siRNA transfection prevented the IL-6 increase in urea flux in Caco-2 monolayers (n = 4). *, p<0.001 vs. control; **, p<001 vs. IL-6 treatment.
Figure 10
Figure 10. Identification of DNA binding sequence responsible for IL-6 induced increase in claudin-2 promoter activity.
(A) Schematic diagram showing 8 potential AP-1 binding sites within the claudin-2 promoter region. Four binding sites were located outside the minimal promoter region (trans-AP-1) and four sites were within the minimal promoter region (cis-AP-1). (B) IL-6 treatment caused an increase in promoter activity in the FL promoter construct (pCLDN2 A) (n = 6). *, p<0.001 vs. control; **, p<001 vs. IL-6 treatment. (C) IL-6 caused a similar increase in promoter activity in the deletion construct lacking the trans-AP-1 sites (pCLDN2 C) (n = 6). *, p<0.001 vs. control; **, p<001 vs. IL-6 treatment. The site-directed mutagenesis of three up-stream cis-AP-1 binding sequences (E, F, G) did not affect the IL-6 induced increase in claudin-2 promoter activity (D), (E), (F) (n = 6). *, p<0.001 vs. control; **, p<001 vs. IL-6 treatment. The mutation of the down-stream cis-AP-1 binding (sequence H) prevented the IL-6 induced increase in claudin-2 promoter activity (n = 6) (G).
Figure 11
Figure 11. Effect of IL-6 on mouse small intestinal permeability and claudin-2 expression in-vivo.
(A) Intraperitoneal treatment of IL-6 (5 µg) did not affect the mucosal-to-serosal flux of dextran 10K in mouse intestinal tissues (n = 5). (B) IL-6 treatment caused a drop in mouse intestinal TER as measured in Ussing chambers. *, p<0.001 vs. control. (C) IL-6 caused an increase in mouse intestinal tissue claudin-2 expression as assessed by Western Blot analysis. (D) IL-6 treatment resulted in an increase in claudin-2 mRNA levels in mouse intestinal tissue (n = 5). *, p<0.0001 vs. control. (E) Claudin-2 siRNA transfection in-vivo prevented the IL-6 induced increase in mouse intestinal claudin-2 protein expression as assessed by Western blot analysis. (F) Claudin-2 siRNA transfection in-vivo prevented the IL-6 induced drop in mouse intestinal TER as measured in Ussing chambers (n = 5). *, p<0.001 vs. control; **, p<001 vs. IL-6 treatment.
Figure 12
Figure 12. Effect of siRNA induced knock-down of intestinal tissue AP-1 on IL-6 induced drop in intestinal tissue electrical resistance.
(A) siRNA induced knock-down of AP-1 in-vivo prevented the IL-6 induced increase in mouse intestinal claudin-2 protein expression as assessed by Western blot analysis. B) AP-1 siRNA transfection in-vivo prevented the IL-6 induced drop in mouse intestinal TER as measured in Ussing chambers (n = 5). *, p<0.001 vs. control; **, p<001 vs. IL-6 treatment.

References

    1. Ma TY, Anderson JM (2012) Tight junctions and the intestinal barrier. In: Physiology of the Gastrointestinal Tract,. Burlington, MA: Elsevier Academic Press.
    1. Turner JR (2009) Intestinal mucosal barrier function in health and disease. Nat Rev Immunol 9: 799–809. - PubMed
    1. Piontek J, Winkler L, Wolburg H, Muller SL, Zuleger N, et al. (2008) Formation of tight junction: determinants of homophilic interaction between classic claudins. FASEB J 22: 146–158. - PubMed
    1. Hollander D (1999) Intestinal permeability, leaky gut, and intestinal disorders. Curr Gastroenterol Rep 1: 410–416. - PubMed
    1. Al-Sadi R, Ye D, Dokladny K, Ma TY (2008) Mechanism of IL-1beta-induced increase in intestinal epithelial tight junction permeability. J Immunol 180: 5653–5661. - PMC - PubMed

Publication types

MeSH terms