Modeling the zebrafish segmentation clock's gene regulatory network constrained by expression data suggests evolutionary transitions between oscillating and nonoscillating transcription
- PMID: 24663100
- PMCID: PMC4063927
- DOI: 10.1534/genetics.114.163642
Modeling the zebrafish segmentation clock's gene regulatory network constrained by expression data suggests evolutionary transitions between oscillating and nonoscillating transcription
Abstract
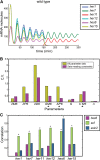
During segmentation of vertebrate embryos, somites form in accordance with a periodic pattern established by the segmentation clock. In the zebrafish (Danio rerio), the segmentation clock includes six hairy/enhancer of split-related (her/hes) genes, five of which oscillate due to negative autofeedback. The nonoscillating gene hes6 forms the hub of a network of 10 Her/Hes protein dimers, which includes 7 DNA-binding dimers and 4 weak or non-DNA-binding dimers. The balance of dimer species is critical for segmentation clock function, and loss-of-function studies suggest that the her genes have both unique and redundant functions within the clock. However, the precise regulatory interactions underlying the negative feedback loop are unknown. Here, we combine quantitative experimental data, in silico modeling, and a global optimization algorithm to identify a gene regulatory network (GRN) designed to fit measured transcriptional responses to gene knockdown. Surprisingly, we find that hes6, the clock gene that does not oscillate, responds to negative feedback. Consistent with prior in silico analyses, we find that variation in transcription, translation, and degradation rates can mediate the gain and loss of oscillatory behavior for genes regulated by negative feedback. Extending our study, we found that transcription of the nonoscillating Fgf pathway gene sef responds to her/hes perturbation similarly to oscillating her genes. These observations suggest a more extensive underlying regulatory similarity between the zebrafish segmentation clock and the mouse and chick segmentation clocks, which exhibit oscillations of her/hes genes as well as numerous other Notch, Fgf, and Wnt pathway genes.
Keywords: gene regulatory network; her/hes; segmentation clock; simulated annealing; zebrafish.
Copyright © 2014 by the Genetics Society of America.
Figures


Similar articles
-
The Her7 node modulates the network topology of the zebrafish segmentation clock via sequestration of the Hes6 hub.Development. 2012 Mar;139(5):940-7. doi: 10.1242/dev.073544. Epub 2012 Jan 25. Development. 2012. PMID: 22278920 Free PMC article.
-
Short-lived Her proteins drive robust synchronized oscillations in the zebrafish segmentation clock.Development. 2013 Aug;140(15):3244-53. doi: 10.1242/dev.093278. Development. 2013. PMID: 23861061
-
Topology and dynamics of the zebrafish segmentation clock core circuit.PLoS Biol. 2012;10(7):e1001364. doi: 10.1371/journal.pbio.1001364. Epub 2012 Jul 24. PLoS Biol. 2012. PMID: 22911291 Free PMC article.
-
Oscillatory gene expression and somitogenesis.Wiley Interdiscip Rev Dev Biol. 2012 Sep-Oct;1(5):629-41. doi: 10.1002/wdev.46. Epub 2012 Mar 22. Wiley Interdiscip Rev Dev Biol. 2012. PMID: 23799565 Review.
-
Understanding the somitogenesis clock: what's missing?Mech Dev. 2007 Aug;124(7-8):501-17. doi: 10.1016/j.mod.2007.06.004. Epub 2007 Jun 15. Mech Dev. 2007. PMID: 17643270 Review.
Cited by
-
Geometric models for robust encoding of dynamical information into embryonic patterns.Elife. 2020 Aug 10;9:e55778. doi: 10.7554/eLife.55778. Elife. 2020. PMID: 32773041 Free PMC article.
-
Pnrc2 regulates 3'UTR-mediated decay of segmentation clock-associated transcripts during zebrafish segmentation.Dev Biol. 2017 Sep 1;429(1):225-239. doi: 10.1016/j.ydbio.2017.06.024. Epub 2017 Jun 23. Dev Biol. 2017. PMID: 28648842 Free PMC article.
-
Pumilio response and AU-rich elements drive rapid decay of Pnrc2-regulated cyclic gene transcripts.Dev Biol. 2020 Jun 15;462(2):129-140. doi: 10.1016/j.ydbio.2020.03.017. Epub 2020 Apr 1. Dev Biol. 2020. PMID: 32246943 Free PMC article.
-
Simplifications and approximations in a single-gene circuit modeling.Sci Rep. 2024 May 31;14(1):12498. doi: 10.1038/s41598-024-63265-8. Sci Rep. 2024. PMID: 38822072 Free PMC article.
-
Sumoylation of Hes6 Regulates Protein Degradation and Hes1-Mediated Transcription.Endocrinol Metab (Seoul). 2015 Sep;30(3):381-8. doi: 10.3803/EnM.2015.30.3.381. Epub 2015 May 18. Endocrinol Metab (Seoul). 2015. PMID: 26435136 Free PMC article.
References
-
- Ay A., Knierer S., Sperlea A., Holland J., Ozbudak E. M., 2013. Short-lived Her proteins drive robust synchronized oscillations in the zebrafish segmentation clock. Development 140: 3244–3253 - PubMed
Publication types
MeSH terms
Substances
Grants and funding
LinkOut - more resources
Full Text Sources
Other Literature Sources
Molecular Biology Databases
Miscellaneous

