

Arabidopsis ANGULATA10 is required for thylakoid biogenesis and mesophyll development
- PMID: 24663344
- PMCID: PMC4036511
- DOI: 10.1093/jxb/eru131
Arabidopsis ANGULATA10 is required for thylakoid biogenesis and mesophyll development
Abstract
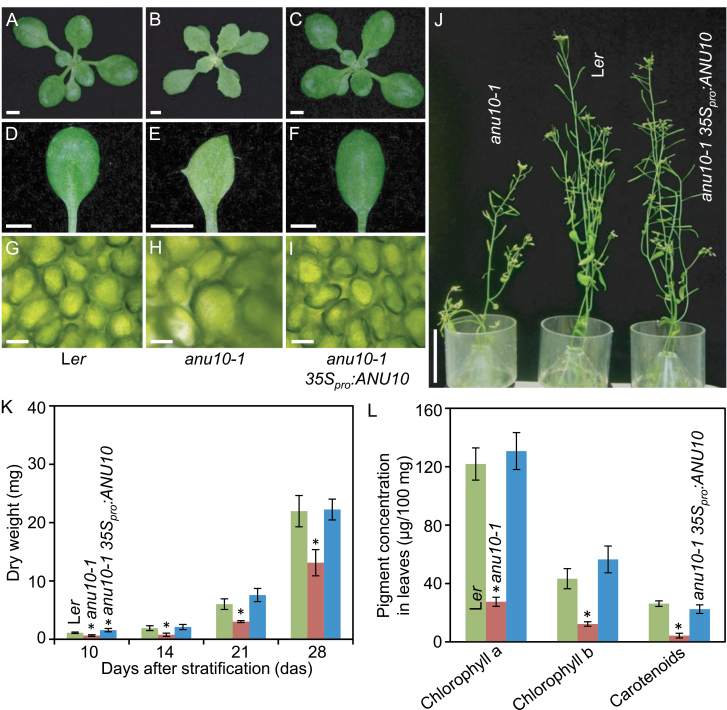
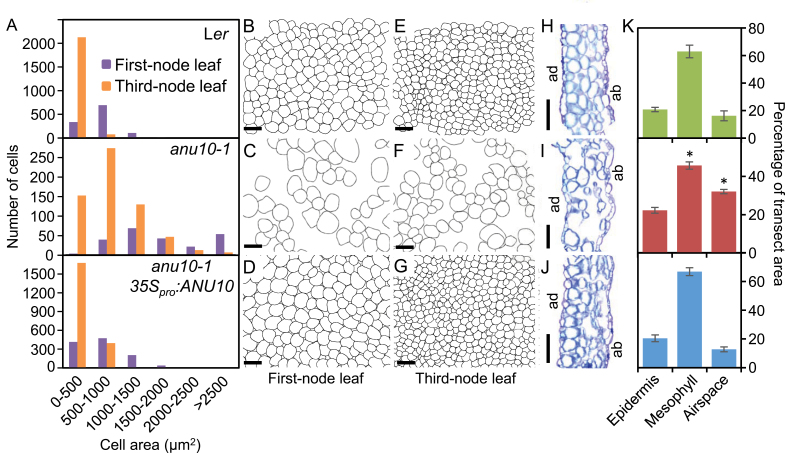
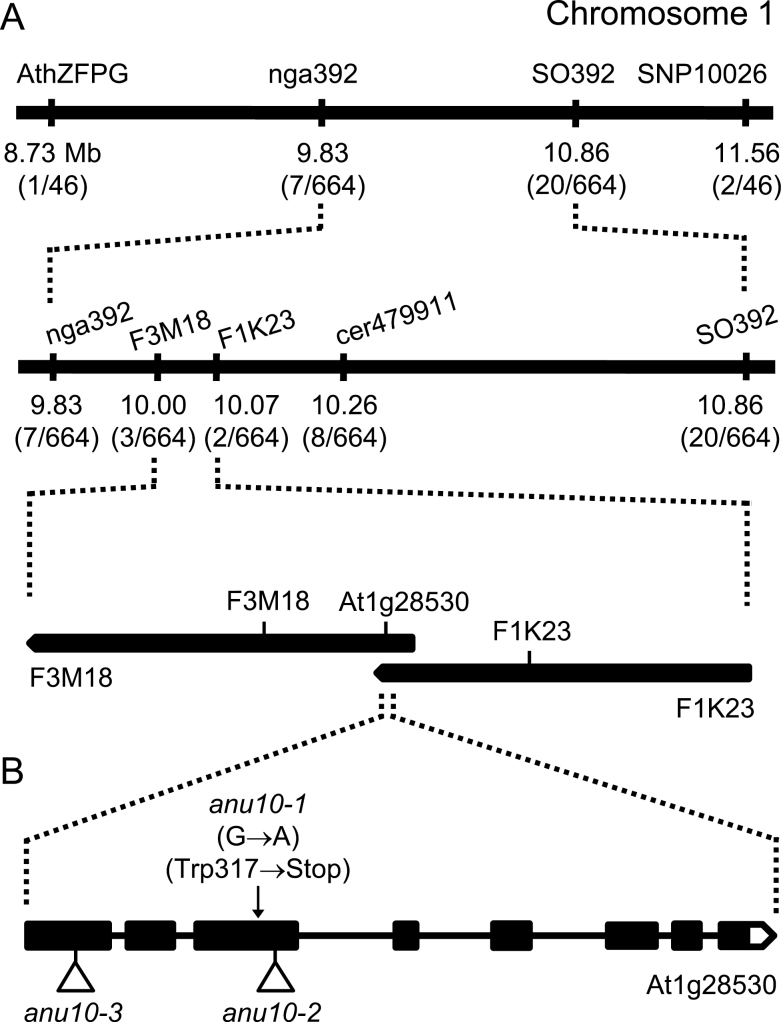
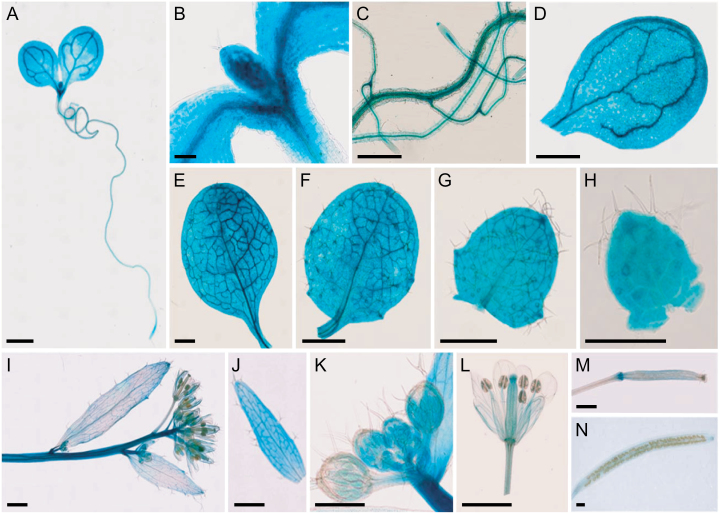
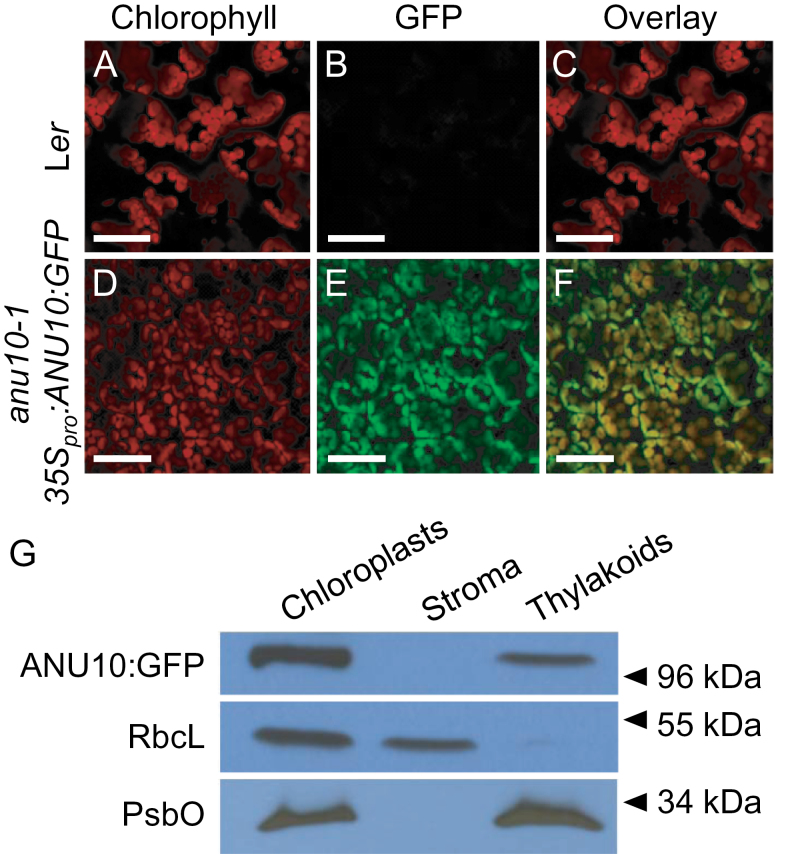
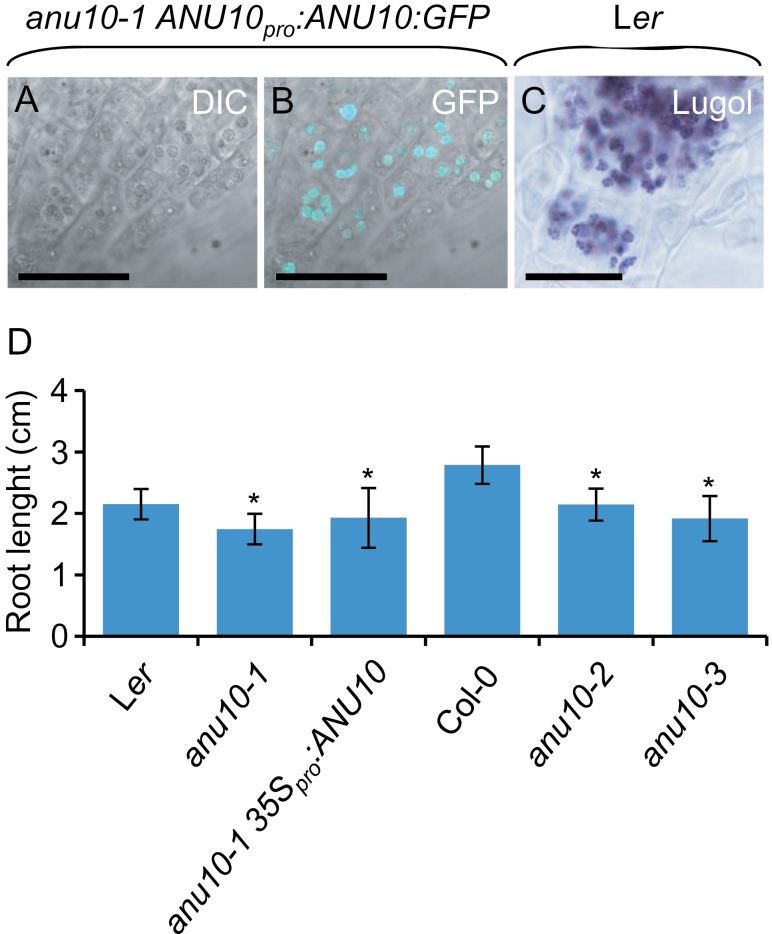
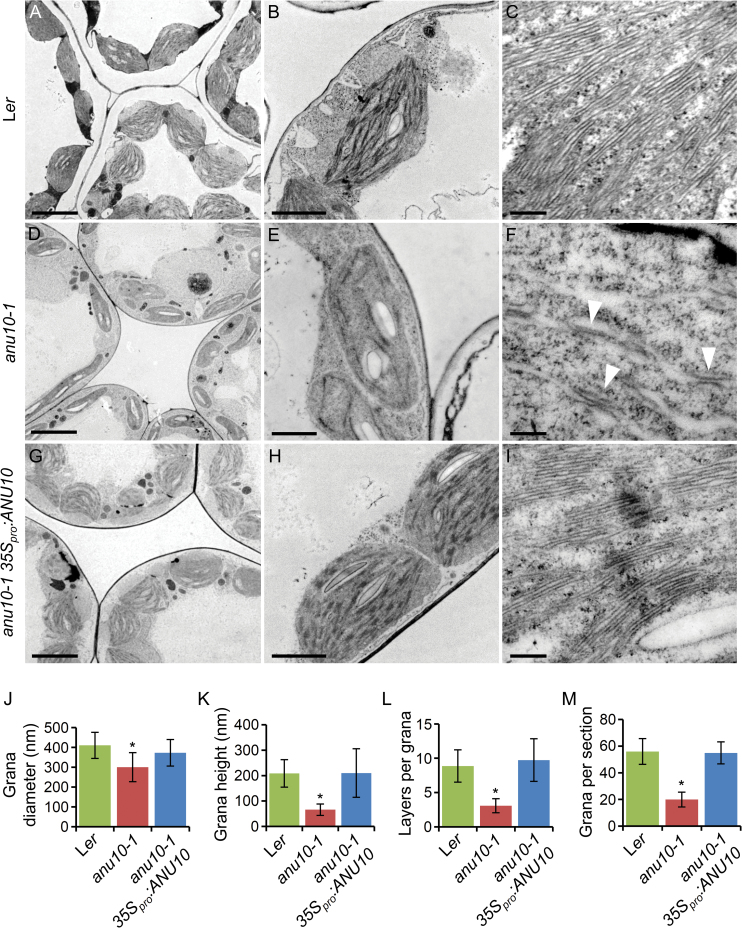
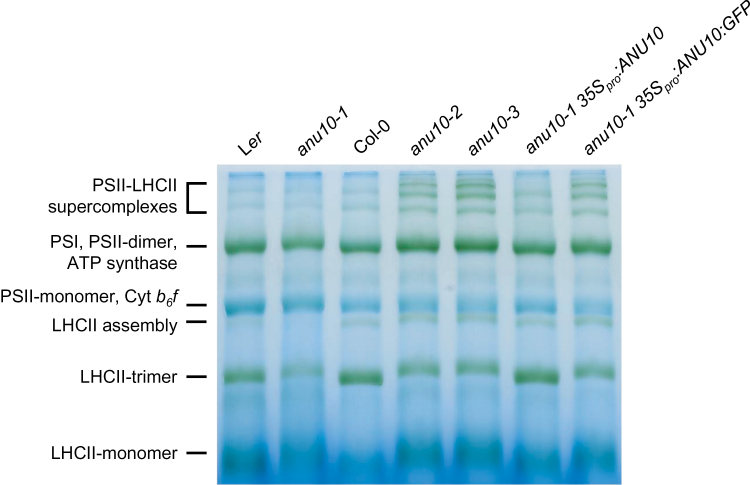
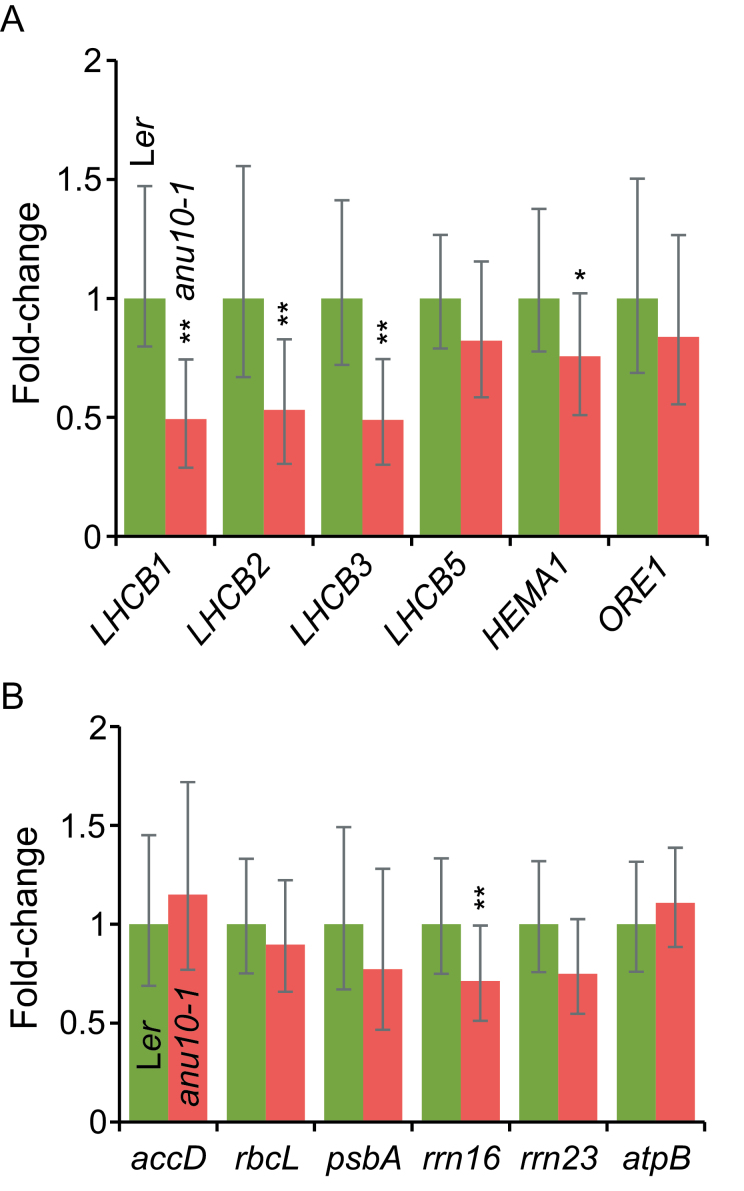
The chloroplasts of land plants contain internal membrane systems, the thylakoids, which are arranged in stacks called grana. Because grana have not been found in Cyanobacteria, the evolutionary origin of genes controlling the structural and functional diversification of thylakoidal membranes in land plants remains unclear. The angulata10-1 (anu10-1) mutant, which exhibits pale-green rosettes, reduced growth, and deficient leaf lateral expansion, resulting in the presence of prominent marginal teeth, was isolated. Palisade cells in anu10-1 are larger and less packed than in the wild type, giving rise to large intercellular spaces. The ANU10 gene encodes a protein of unknown function that localizes to both chloroplasts and amyloplasts. In chloroplasts, ANU10 associates with thylakoidal membranes. Mutant anu10-1 chloroplasts accumulate H2O2, and have reduced levels of chlorophyll and carotenoids. Moreover, these chloroplasts are small and abnormally shaped, thylakoidal membranes are less abundant, and their grana are absent due to impaired thylakoid stacking in the anu10-1 mutant. Because the trimeric light-harvesting complex II (LHCII) has been reported to be required for thylakoid stacking, its levels were determined in anu10-1 thylakoids and they were found to be reduced. Together, the data point to a requirement for ANU10 for chloroplast and mesophyll development.
Keywords: Arabidopsis thaliana; LHCII trimers; chloroplast; grana; mesophyll development; thylakoid biogenesis; thylakoid stacking..
© The Author 2014. Published by Oxford University Press on behalf of the Society for Experimental Biology.
Figures
Similar articles
-
The GDC1 gene encodes a novel ankyrin domain-containing protein that is essential for grana formation in Arabidopsis.Plant Physiol. 2011 Jan;155(1):130-41. doi: 10.1104/pp.110.165589. Epub 2010 Nov 19. Plant Physiol. 2011. PMID: 21098677 Free PMC article.
-
Arabidopsis CURVATURE THYLAKOID1 proteins modify thylakoid architecture by inducing membrane curvature.Plant Cell. 2013 Jul;25(7):2661-78. doi: 10.1105/tpc.113.113118. Epub 2013 Jul 9. Plant Cell. 2013. PMID: 23839788 Free PMC article.
-
Correlation between spatial (3D) structure of pea and bean thylakoid membranes and arrangement of chlorophyll-protein complexes.BMC Plant Biol. 2012 May 25;12:72. doi: 10.1186/1471-2229-12-72. BMC Plant Biol. 2012. PMID: 22631450 Free PMC article.
-
Composition, phosphorylation and dynamic organization of photosynthetic protein complexes in plant thylakoid membrane.Photochem Photobiol Sci. 2020 May 20;19(5):604-619. doi: 10.1039/d0pp00025f. Photochem Photobiol Sci. 2020. PMID: 32297616 Review.
-
A brief history of thylakoid biogenesis.Open Biol. 2019 Jan 31;9(1):180237. doi: 10.1098/rsob.180237. Open Biol. 2019. PMID: 30958119 Free PMC article. Review.
Cited by
-
Retrograde Signals Navigate the Path to Chloroplast Development.Plant Physiol. 2018 Feb;176(2):967-976. doi: 10.1104/pp.17.01299. Epub 2017 Dec 18. Plant Physiol. 2018. PMID: 29254985 Free PMC article. Review.
-
CAX-INTERACTING PROTEIN4 depletion causes early lethality and pre-mRNA missplicing in Arabidopsis.Plant Physiol. 2024 Dec 24;197(1):kiae641. doi: 10.1093/plphys/kiae641. Plant Physiol. 2024. PMID: 39657023 Free PMC article.
-
Deficient glutamate biosynthesis triggers a concerted upregulation of ribosomal protein genes in Arabidopsis.Sci Rep. 2017 Jul 21;7(1):6164. doi: 10.1038/s41598-017-06335-4. Sci Rep. 2017. PMID: 28733652 Free PMC article.
-
Rapid identification of angulata leaf mutations using next-generation sequencing.Planta. 2014 Nov;240(5):1113-22. doi: 10.1007/s00425-014-2137-8. Epub 2014 Aug 8. Planta. 2014. PMID: 25102851
-
CXIP4 depletion causes early lethality and pre-mRNA missplicing in Arabidopsis.bioRxiv [Preprint]. 2024 Jun 10:2024.06.06.597795. doi: 10.1101/2024.06.06.597795. bioRxiv. 2024. Update in: Plant Physiol. 2024 Dec 24;197(1):kiae641. doi: 10.1093/plphys/kiae641. PMID: 38915646 Free PMC article. Updated. Preprint.
References
-
- Albertsson P. 2001. A quantitative model of the domain structure of the photosynthetic membrane. Trends in Plant Science 6, 349–358 - PubMed
-
- Allen JF, Forsberg J. 2001. Molecular recognition in thylakoid structure and function. Trends in Plant Science 6, 317–326 - PubMed
-
- Andersson J, Wentworth M, Walters RG, Howard CA, Ruban AV, Horton P, Jansson S. 2003. Absence of the Lhcb1 and Lhcb2 proteins of the light-harvesting complex of photosystem II—effects on photosynthesis, grana stacking and fitness. The Plant Journal 35, 350–361 - PubMed
Publication types
MeSH terms
Substances
LinkOut - more resources
Full Text Sources
Other Literature Sources
Molecular Biology Databases
