. 2014 Mar 10;22(5):5787-807.
doi: 10.1364/OE.22.005787.

Model for estimating the penetration depth limit of the time-reversed ultrasonically encoded optical focusing technique

Model for estimating the penetration depth limit of the time-reversed ultrasonically encoded optical focusing technique

Mooseok Jang et al. Opt Express. .

Abstract

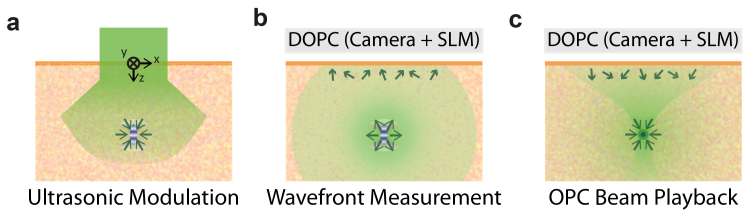
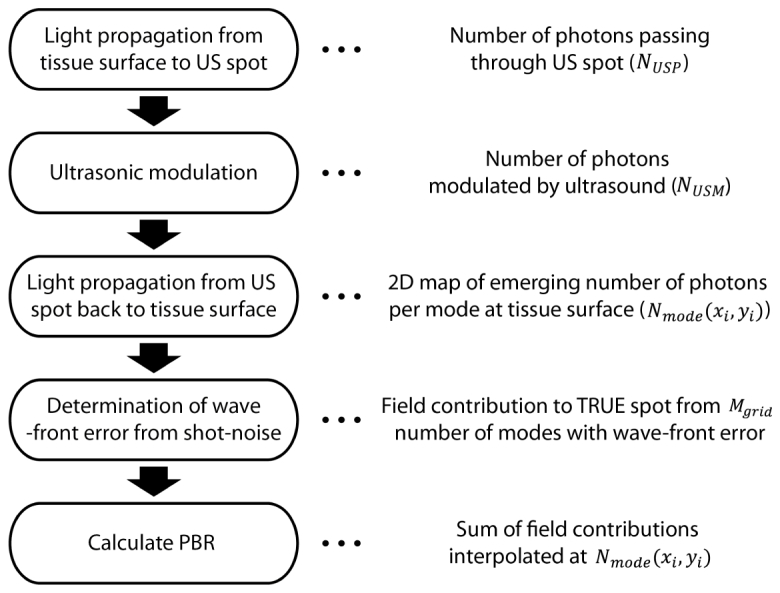
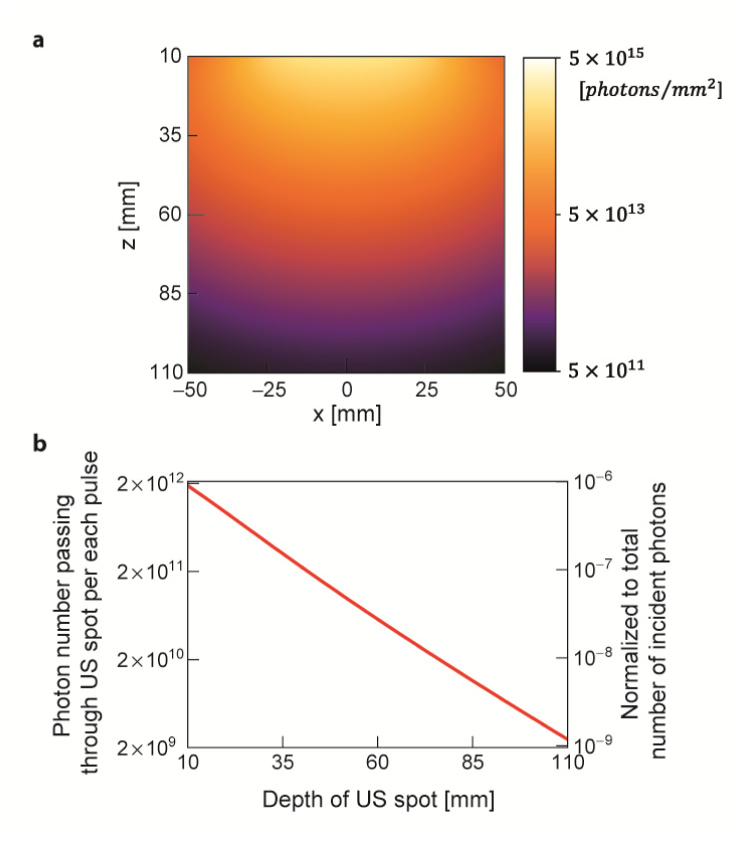
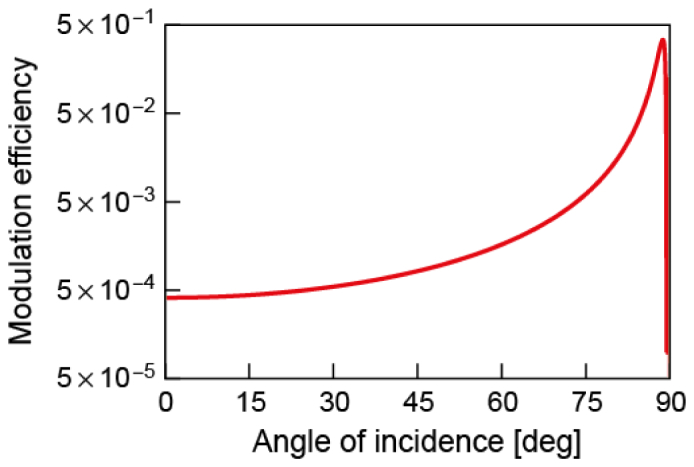
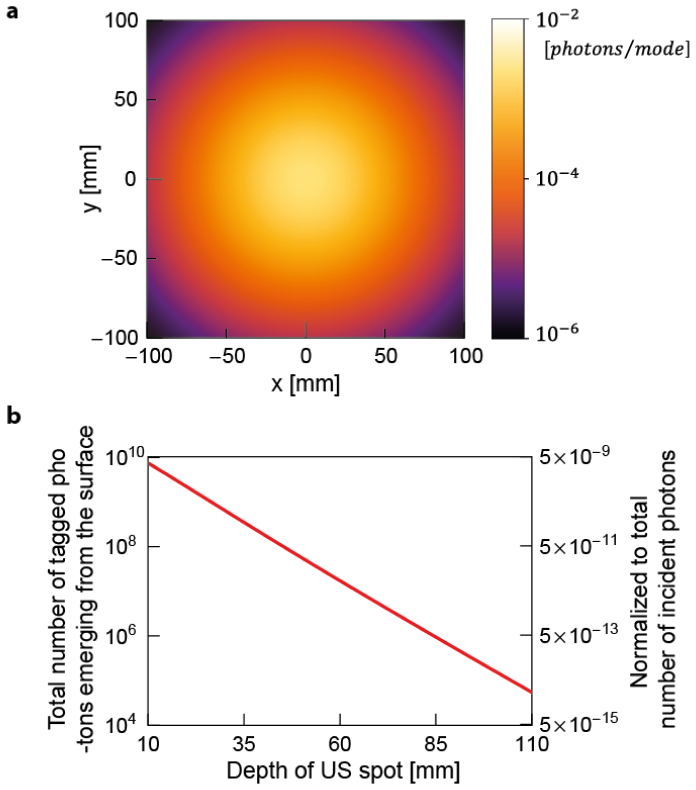
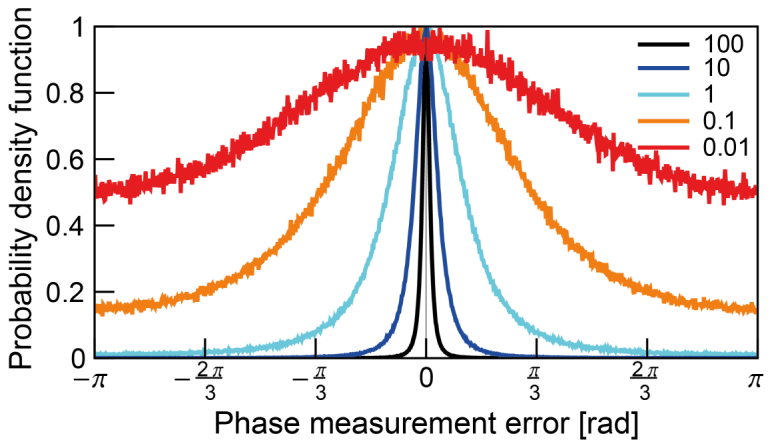
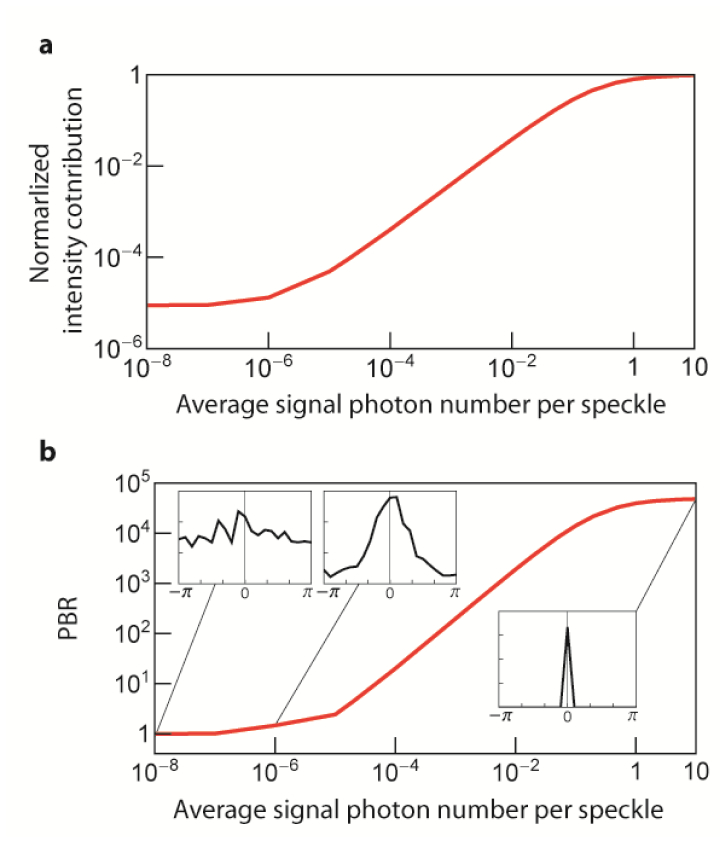
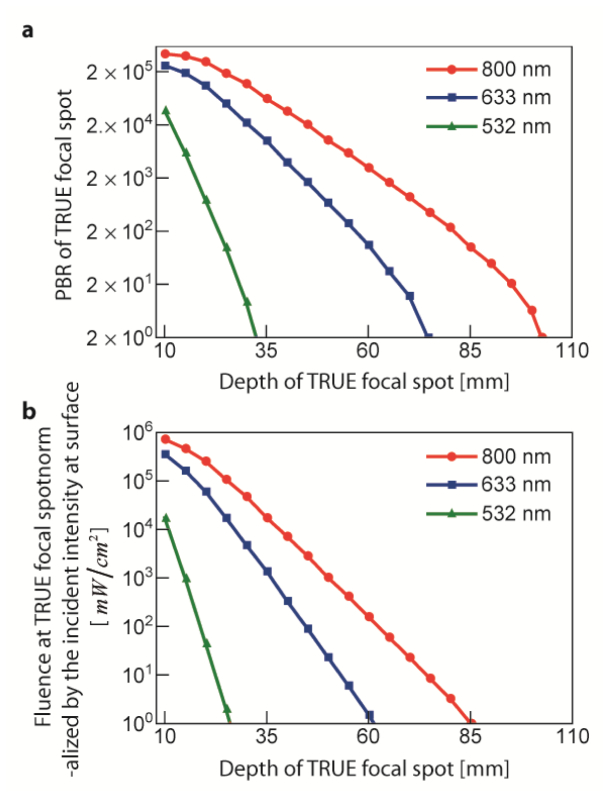
The time-reversed ultrasonically encoded (TRUE) optical focusing technique is a method that is capable of focusing light deep within a scattering medium. This theoretical study aims to explore the depth limits of the TRUE technique for biological tissues in the context of two primary constraints - the safety limit of the incident light fluence and a limited TRUE's recording time (assumed to be 1 ms), as dynamic scatterer movements in a living sample can break the time-reversal scattering symmetry. Our numerical simulation indicates that TRUE has the potential to render an optical focus with a peak-to-background ratio of ~2 at a depth of ~103 mm at wavelength of 800 nm in a phantom with tissue scattering characteristics. This study sheds light on the allocation of photon budget in each step of the TRUE technique, the impact of low signal on the phase measurement error, and the eventual impact of the phase measurement error on the strength of the TRUE optical focus.


Figures

Fig. 1
Fig. 1
Schematic of the TRUE focusing principle with digital optical phase conjugation system (DOPC). (a) Collimated incident beam propagates through scattering medium. Light component passing through the ultrasound focus is encoded with ultrasound frequency. (b) Ultrasound-modulated light propagates back to the tissue surface. The distorted wave front is measured by a sensor in the DOPC system. (c) Spatial light modulator (SLM) reproduces a phase-conjugated copy of the measured wave front. The OPC beam with time-reversal characteristic is focused back into the US spot.
Fig. 2
Fig. 2
Flow chart of simulation procedure. 2D photon flux map emerging from the tissue surface is calculated from the first three steps regarding light propagation and ultrasonic light modulation. Then, wavefront measurement error resulting from shot-noise is determined to calculate the field contribution from Mgrid number of modes to the TRUE focal spot (AOPC_LUTeiϕOPC_LUT). In the last step, PBR is calculated by summing up the field contributions from each simulation grid cell. Here, we use the lookup table approach (field contribution is interpolated from) that we will describe in detail at Section 2.3.2 and 2.3.3.
Fig. 3
Fig. 3
(a) Longitudinal sectional photon fluence map of the light beam propagating through the biological tissue corresponding to a single light pulse at the safety limit. The map is plotted in log scale. The wavelength is 800nm. We calculated the number of photons passing through the US spot (Φ(rUS)×pdur/(hc/λ)) by multiplying the photon flux at target depth with the longitudinal cross-sectional area of US spot. (b) Number of photons passing through the US spot is plotted along depth. The scale on the right axis represents the corresponding photon numbers normalized by the number of incident photons. The plot is in log scale.
Fig. 4
Fig. 4
Dependence of ultrasonic modulation efficiency (η(θ)) on the incident light angle as calculated by the Raman-Nath theory for an 800nmlight source and an ultrasonic pressure of 2.35MPa. As θmax(88) is around 90 and the light irradiance is nearly isotropic in the diffusing regime, we averaged out the modulation efficiency for incidence angles of [0,θmax]. This results in a value of ~0.0067(for 532nm and 633nm, ~0.013 and ~0.010, respectively). The number of modulated photon numbers (NUSM) is calculated by multiplying the averaged modulation efficiency with the number of photons passing through the US spot (NUSP). The plot is in log scale.
Fig. 5
Fig. 5
(a) 2D photon flux map of ultrasonically modulated light emerging from the tissue surface from a single incident light pulse. The map is plotted in log scale. The target depth is 5cmand the wavelength is 800nm. We calculated the average number of photons per mode (Nmode(xl,m,yl,m)) by dividing the photon flux at each grid cell (J(xl,m,yl,m)) by the number of modes inside each grid cell (Mgrid). (b) The total number of emerging photons at the surface is plotted for various depths. The scale on the right axis represents corresponding photon numbers normalized by the number of incident photons. The plot is in log scale.
Fig. 6
Fig. 6
Normalized probability density function of the phase measurement error at different average signal level (Isig/(hc/λ)=Asig2/(hc/λ)) – 100, 10, 1, 0.1, 0.01 photon(s). The PDF is built with the Monte-Carlo simulation of 4 step phase shifting method for 105 number of modes. The error is increased as the signal is decreased. Though it is wide, peak around 0 is observed even at signal photon number smaller than 1.
Fig. 7
Fig. 7
(a) Normalized intensity contribution from the single grid cell (0.1mm×0.1mm) to a single input mode (AOPC_LUT2)) when OPC is performed for Mgrid(=6.25×10⁴) number of modes. The plot is normalized with the ideal intensity contribution in the case without wavefront measurement error which has a linear dependence on the average signal photon number. As the average signal photon number decreases, the wavefront measurement error across Mgrid number of modes increases, resulting in a dramatic reduction in intensity contribution. (b) Dependence of PBR on the average signal photon number when OPC is performed on single grid cell for the single input mode. By assuming plane wave front, background intensity contribution is calculated. Then, PBR is calculated by dividing peak intensity contribution with the background intensity contribution. PBR drops to 1 at low signal photon limit and saturates to πMgrid/4(=4.9×104)when there is enough signal photon for an accurate phase measurement. The insets show the resultant phase distribution (PDF) of the phase-conjugated field (ϕOPC_LUT) at different signal photon level. The plots are in log-log scale.
Fig. 8
Fig. 8
(a) Dependence of PBR of TRUE focal spot on the target depth. Penetration depth limit is ~103mm(depthlocal where PBRTRUE=2) with 800nm (red line, circle marker). (b) Dependence of fluence at TRUE focal spot normalized by the incident playback light intensity at surface. Light power on the TRUE focal spot becomes weaker than the incident light power from ~85mm (depthfluence) for 800nm. Penetration depth limits for both standards are reduced to ~34mm and ~75mm (depthlocal), ~25mmand ~62mm(depthfluence), for 532nm(green line, triangle marker) and 633nm(blue line, square marker) light, respectively. The plots are in log scale.

References

    1. Ntziachristos V., “Going deeper than microscopy: the optical imaging frontier in biology,” Nat. Methods 7(8), 603–614 (2010).10.1038/nmeth.1483 - DOI - PubMed
    1. Xu X., Liu H., Wang L. V., “Time-reversed ultrasonically encoded optical focusing into scattering media,” Nat. Photonics 5(3), 154–157 (2011).10.1038/nphoton.2010.306 - DOI - PMC - PubMed
    1. Wang Y. M., Judkewitz B., Dimarzio C. A., Yang C., “Deep-tissue focal fluorescence imaging with digitally time-reversed ultrasound-encoded light,” Nat Commun 3, 928 (2012).10.1038/ncomms1925 - DOI - PMC - PubMed
    1. Si K., Fiolka R., Cui M., “Fluorescence imaging beyond the ballistic regime by ultrasound pulse guided digital phase conjugation,” Nat. Photonics 6(10), 657–661 (2012).10.1038/nphoton.2012.205 - DOI - PMC - PubMed
    1. Si K., Fiolka R., Cui M., “Breaking the spatial resolution barrier via iterative sound-light interaction in deep tissue microscopy,” Sci. Rep. 2, 748 (2012).10.1038/srep00748 - DOI - PMC - PubMed

Publication types