cuTauLeaping: a GPU-powered tau-leaping stochastic simulator for massive parallel analyses of biological systems
- PMID: 24663957
- PMCID: PMC3963881
- DOI: 10.1371/journal.pone.0091963
cuTauLeaping: a GPU-powered tau-leaping stochastic simulator for massive parallel analyses of biological systems
Abstract
Tau-leaping is a stochastic simulation algorithm that efficiently reconstructs the temporal evolution of biological systems, modeled according to the stochastic formulation of chemical kinetics. The analysis of dynamical properties of these systems in physiological and perturbed conditions usually requires the execution of a large number of simulations, leading to high computational costs. Since each simulation can be executed independently from the others, a massive parallelization of tau-leaping can bring to relevant reductions of the overall running time. The emerging field of General Purpose Graphic Processing Units (GPGPU) provides power-efficient high-performance computing at a relatively low cost. In this work we introduce cuTauLeaping, a stochastic simulator of biological systems that makes use of GPGPU computing to execute multiple parallel tau-leaping simulations, by fully exploiting the Nvidia's Fermi GPU architecture. We show how a considerable computational speedup is achieved on GPU by partitioning the execution of tau-leaping into multiple separated phases, and we describe how to avoid some implementation pitfalls related to the scarcity of memory resources on the GPU streaming multiprocessors. Our results show that cuTauLeaping largely outperforms the CPU-based tau-leaping implementation when the number of parallel simulations increases, with a break-even directly depending on the size of the biological system and on the complexity of its emergent dynamics. In particular, cuTauLeaping is exploited to investigate the probability distribution of bistable states in the Schlögl model, and to carry out a bidimensional parameter sweep analysis to study the oscillatory regimes in the Ras/cAMP/PKA pathway in S. cerevisiae.
Conflict of interest statement
Figures


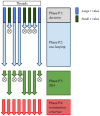
 for the simulation step; in phase P2, the threads whose
  is “large” perform a tau-leaping step (by executing a set of non-critical reactions and (possibly) one critical reaction); the remaining threads perform a fixed number of SSA steps (where one reaction is executed at each step) during phase P3. The phases are iterated until all threads have reached
  , a termination criterion verified during phase P4.

 in cuTauLeaping, implementing the subdivision of threads according to the
  value and the execution of a tau-leaping step. The kernel starts by loading the vectors
  and
and  – which correspond to the current state of the system and to the values of stochastic constants, respectively – from the global memory areas that contain these data for all threads. Since these information are frequently accessed, they are immediately copied into the faster shared memory as vectors x and c, respectively. The kernel continues by verifying that the
  value for the running thread
  is not equal to the signal of terminated execution (i.e.,
  ). Then, it calculates the propensity functions of all reactions and accumulates their values in
  ; if
; if  , the remaining time instants where the dynamics of the system is sampled are set to the current state and the simulation is terminated. The kernel concludes the phase P1 by calculating a putative
  value for the tau-leaping step: if
  is smaller than
  , then thread
  is halted and
  is set to 0, so that it will perform the SSA steps during the next phase. Otherwise, the tau-leaping algorithm is performed by executing a set of non-critical reactions and (possibly) one critical reaction and, if the simulation has overrun one of the sampling time instants, the state stored in
  is determined by linear interpolation.
 in cuTauLeaping, implementing the execution of the SSA steps. The kernel starts by loading the vectors
  and
and  – which correspond to the current state of the system and to the values of stochastic constants, respectively – from the global memory areas that contain these data for all threads. Since these information are frequently accessed, they are immediately copied into the faster shared memory as vectors x and c, respectively. The kernel continues by verifying that the
  value for the running thread
  is equal to the signal corresponding to SSA (i.e.,
  ). Then, it performs a fixed number of SSA steps (100 in our default setting), where a single reaction is executed at each step, storing the system state at the sampled time instants
  .
.
 in cuTauLeaping, implementing the verification of the termination of all simulations. The verification is performed by means of CUDA's hardware accelerated synchronization and counting features, which allow to count the threads of a block which satisfy a specific predicate. By exploiting CUDA's atomic functions, we accumulate the total number of threads which satisfy the predicate
  : if it is equal to the number of threads, the execution of all parallel simulations is completed.
 ), where
  is the row index,
  is the column index and
  is the non-zero value in
  . In our implementation, both
  and
and  indices are 0-based and triples are stored using vectors of CUDA's
  data types, that have the advantage of requiring a single instruction to fetch an entry. The top part of this figure shows the values appearing in the 3×4 stoichiometric matrix of reactant species of the Michaelis-Menten model (MM), which consists of 3 reactions over 4 molecular species (see Text S1). Note that only four cells of this matrix have non-zero values; the bottom part of the figure shows the corresponding
  vector.
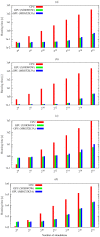
 parallel simulations are run, while for the Schlögl model and the Ras/cAMP/PKA pathway the break-even is around
  simulations. Considering the speedup, the best results achieved with cuTauLeaping – with respect to COPASI – are around 583× for the MM model, 961× for the PGN model, 90× for the Schlögl model, and 25× for the model of the Ras/cAMP/PKA pathway (see also Table 1).
 in the Schlögl model, calculated using a total of
  parallel simulations executed by cuTauLeaping. (a) Plot of the frequency distribution of
  considering
  a.u., to detect the bistable switching behavior that takes place in the first time instants of the dynamics; a slightly higher probability to reach the low steady state can be observed, starting from the initial state of the Schlögl system (described in Text S1). (b) Plot of the frequency distribution of
  considering
  a.u., to investigate the stability of the two steady states of the system; the heatmap highlights the two stable states (around 100 and 600 molecules of species
  ), and shows larger stochastic fluctuations around the high steady state.
 is varied in the interval
  (the set of reactions and the values of all other parameters are given in Tables 4 and 5 in Text S1). Each frequency distribution is calculated according to
  simulations executed by cuTauLeaping, measuring the amount of the molecular species
  at the time instant
  a.u., considering ten different values of the stochastic constant
  within the sweep interval. The figure shows that increasing values of
  induce a decrease (increment) in the frequency distribution of
  concerning the low (high) steady state, with intermediate values of
  characterized by an effective bistable behavior.
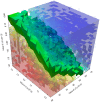
 ,
,  and
and  in the intervals
  ,
,  and
and  , respectively. The values of the stochastic constants were uniformly sampled in a
  three-dimensional lattice; for each sample, we executed 256 simulations with cuTauLeaping (for a total of
  simulations) and evaluated the frequency distribution of the amount of the molecular species
  at the time instant
  a.u.. This set of values was then partitioned according to the reached (low or high) stable steady state; in the plot, the red (blue) region corresponds to the parameterizations of the model which yield the high (low) steady state most frequently. The green region represents a set of conditions whereby both steady states are equally reached.
 molecules (ranging from a reduced nutrient availability to a normal growth condition), and the amount of Cdc25 in the interval
  molecules (ranging from the deletion to a 2-fold overexpression of this GEF proteins). The figure shows the amplitude of cAMP oscillations, evaluated as described in ; an amplitude value equal to zero corresponds to a non oscillating dynamics. (a) Plot of the results obtained by running
  parallel simulations with cuTauLeaping; (b) plot of the results obtained by running
  sequential simulations, performed on the CPU. The two batches of parallel and sequential simulations were executed with a comparable computational time.
 was varied in the interval
  and a total of
  simulations were executed. The plot shows how the computational cost of tau-leaping running on CPU rapidly increases; this behavior can become prohibitive if several independent simulations need to be executed. On the contrary, cuTauLeaping shows a very moderate increase in the running times and outperforms the CPU implementation of tau-leaping.
Similar articles
-
Massive exploration of perturbed conditions of the blood coagulation cascade through GPU parallelization.Biomed Res Int. 2014;2014:863298. doi: 10.1155/2014/863298. Epub 2014 Jun 16. Biomed Res Int. 2014. PMID: 25025072 Free PMC article.
-
Modeling and stochastic simulation of the Ras/cAMP/PKA pathway in the yeast Saccharomyces cerevisiae evidences a key regulatory function for intracellular guanine nucleotides pools.J Biotechnol. 2008 Feb 1;133(3):377-85. doi: 10.1016/j.jbiotec.2007.09.019. Epub 2007 Oct 11. J Biotechnol. 2008. PMID: 18023904
-
NMF-mGPU: non-negative matrix factorization on multi-GPU systems.BMC Bioinformatics. 2015 Feb 13;16:43. doi: 10.1186/s12859-015-0485-4. BMC Bioinformatics. 2015. PMID: 25887585 Free PMC article.
-
GPU computing for systems biology.Brief Bioinform. 2010 May;11(3):323-33. doi: 10.1093/bib/bbq006. Epub 2010 Mar 7. Brief Bioinform. 2010. PMID: 20211843 Review.
-
Stochastic simulation of chemical kinetics.Annu Rev Phys Chem. 2007;58:35-55. doi: 10.1146/annurev.physchem.58.032806.104637. Annu Rev Phys Chem. 2007. PMID: 17037977 Review.
Cited by
-
The feasibility of genome-scale biological network inference using Graphics Processing Units.Algorithms Mol Biol. 2017 Mar 20;12:8. doi: 10.1186/s13015-017-0100-5. eCollection 2017. Algorithms Mol Biol. 2017. PMID: 28344638 Free PMC article.
-
Massive exploration of perturbed conditions of the blood coagulation cascade through GPU parallelization.Biomed Res Int. 2014;2014:863298. doi: 10.1155/2014/863298. Epub 2014 Jun 16. Biomed Res Int. 2014. PMID: 25025072 Free PMC article.
-
Graphics processing units in bioinformatics, computational biology and systems biology.Brief Bioinform. 2017 Sep 1;18(5):870-885. doi: 10.1093/bib/bbw058. Brief Bioinform. 2017. PMID: 27402792 Free PMC article. Review.
-
LASSIE: simulating large-scale models of biochemical systems on GPUs.BMC Bioinformatics. 2017 May 10;18(1):246. doi: 10.1186/s12859-017-1666-0. BMC Bioinformatics. 2017. PMID: 28486952 Free PMC article.
-
Abstraction-based segmental simulation of reaction networks using adaptive memoization.BMC Bioinformatics. 2024 Nov 8;25(1):350. doi: 10.1186/s12859-024-05966-5. BMC Bioinformatics. 2024. PMID: 39516723 Free PMC article.
References
-
- Aldridge B, Burke J, Lauffenburger D, Sorger P (2006) Physicochemical modelling of cell signalling pathways. Nat Cell Biol 8: 1195–203. - PubMed
-
- Hyduke D, Palsson B (2010) Towards genome-scale signalling network reconstructions. Nat Rev Genet 11: 297–307. - PubMed
-
- Kitano H (2002) Computational systems biology. Nature 420: 206–210. - PubMed
-
- Papin J, Hunter T, Palsson B, Subramaniam S (2005) Reconstruction of cellular signalling networks and analysis of their properties. Nat Rev Mol Cell Biol 9: 99–111. - PubMed
Publication types
MeSH terms
Substances
LinkOut - more resources
Full Text Sources
Other Literature Sources
Molecular Biology Databases

