. 2014 Sep 15;210(6):899-903.
doi: 10.1093/infdis/jiu188. Epub 2014 Mar 23.

HIV-1 infection impairs regulatory T-cell suppressive capacity on a per-cell basis

Affiliations

HIV-1 infection impairs regulatory T-cell suppressive capacity on a per-cell basis

Mathieu Angin et al. J Infect Dis. .

Abstract

The impact of CD4+ regulatory T cells (Tregs) on human immunodeficiency virus type 1 (HIV-1) pathogenesis remains incompletely understood. Although it has been shown that Tregs can be infected with HIV-1, the consequences of infection on a per-cell basis are still unknown. In vitro HIV-GFP infected and noninfected Tregs were isolated by flow-based cell-sorting to investigate Treg suppressive capacity and gene expression profiles. Our data show that HIV-1-infected Tregs were significantly less suppressive than noninfected Tregs and demonstrated down-regulation of genes critical to Treg function. This impaired function may have detrimental consequences for the control of generalized immune activation and accelerate HIV disease progression.

Keywords: HIV; Tregs; gene expression; immune activation; regulatory T cells.


Figures

Figure 1.
Figure 1.
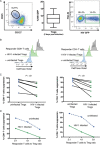
Impact of HIV-1 infection on Treg function. A, Example (left panel) of dot plots and gating strategy used to sort CD4+ CD25+ CD127low regulatory T cells. Frequency of HIV-GFP expression (middle panel) in regulatory T cells (n = 12) 2 days after infection with VSVg-pseudotyped HIV-GFP at a MOI of 1. The box and whiskers plot represents the median, 25 and 75 percentiles (box), min and max values (whiskers). Example (right panel) of dot plot and gating strategy used to sort GFPpos HIV-1-infected (solid gate) and GFPneg-HIV-1-uninfected (hatched gate) Tregs 2 days post-infection. B, Example of activated CD8+ (left panel) and CD4+ (right panel) T-cell proliferation followed by CellTrace Violet dilution after 4 days of culture alone (gray histogram), in the presence of matched HIV-1-infected Tregs (Solid histogram) or uninfected Tregs (blue histogram) at a ratio of 4:1 Responder T cells to Tregs. C, Frequency of suppression of activated CD8+ (left panel) and CD4+ (right panel) T cells when co-cultured in the presence of matched HIV-1-infected Tregs (green dots) or uninfected Tregs (blue dots) at a ratio of 4:1 responder T cells to Tregs. P value was calculated using the Wilcoxon matched-pairs signed rank test and considered significant when inferior to .05. D, Example of percent of suppression of activated CD8+ (left panel) and CD4+ (right panel) T cells when co-cultured in the presence of HIV-1-infected Tregs (green hatched line) or uninfected Tregs (blue hatched line) at different Responder T cell to Treg ratios. Abbreviations: GFP, green fluorescent protein; HIV-1, human immunodeficiency virus type 1; VSVg, vesicular stomatitis virus envelope glycoprotein.
Figure 2.
Figure 2.
Transcriptional changes induced in Tregs following HIV-1 infection. A, Unsupervised analysis of HIV-1-infected (green dots) and uninfected Treg (blue dots) gene expression performed on normalized data by Principal Component Analysis. Principal component analysis was performed on normalized data generated using a three step process including background correction using negative spike-in controls, signal correction based on positive spikes in controls and housekeeping genes to bring all chips to similar expression levels. B, Heat map of significantly differentially expressed genes following HIV-1 infection in Tregs. Columns represent the samples, with rows representing genes. Gene expression levels are shown as a pseudocolor scale (−3 to 3) with red denoting high expression level and green denoting low expression level. Genes with FDR ≤ 0.05 were considered differentially expressed. Abbreviations: FDR, false discovery rate; HIV-1, human immunodeficiency virus type 1.

References

    1. Angin M, Kwon DS, Streeck H, et al. Preserved function of regulatory T cells in chronic HIV-1 infection despite decreased numbers in blood and tissue. J Infect Dis. 2012;205:1495–500. - PMC - PubMed
    1. Moreno-Fernandez ME, Zapata W, Blackard JT, Franchini G, Chougnet CA. Human regulatory T cells are targets for human immunodeficiency Virus (HIV) infection, and their susceptibility differs depending on the HIV type 1 strain. J Virol. 2009;83:12925–33. - PMC - PubMed
    1. Pion M, Jaramillo-Ruiz D, Martinez A, Munoz-Fernandez MA, Correa-Rocha R. HIV infection of human regulatory T cells downregulates Foxp3 expression by increasing DNMT3b levels and DNA methylation in the FOXP3 gene. AIDS. 2013;27:2019–29. - PubMed
    1. Murooka TT, Deruaz M, Marangoni F, et al. HIV-infected T cells are migratory vehicles for viral dissemination. Nature. 2012;490:283–7. - PMC - PubMed
    1. Moreno-Fernandez ME, Presicce P, Chougnet CA. Homeostasis and function of regulatory T cells in HIV/SIV infection. J Virol. 2012;86:10262–9. - PMC - PubMed

Publication types