. 2014 May;165(1):290-308.
doi: 10.1104/pp.113.233742. Epub 2014 Mar 24.

Accumulation of N-acetylglucosamine oligomers in the plant cell wall affects plant architecture in a dose-dependent and conditional manner

Affiliations

Accumulation of N-acetylglucosamine oligomers in the plant cell wall affects plant architecture in a dose-dependent and conditional manner

Bartel Vanholme et al. Plant Physiol. 2014 May.

Abstract

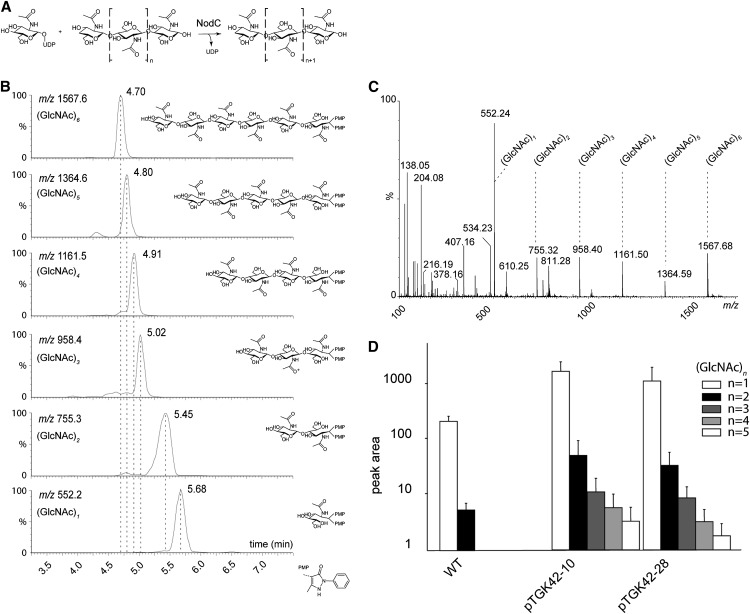
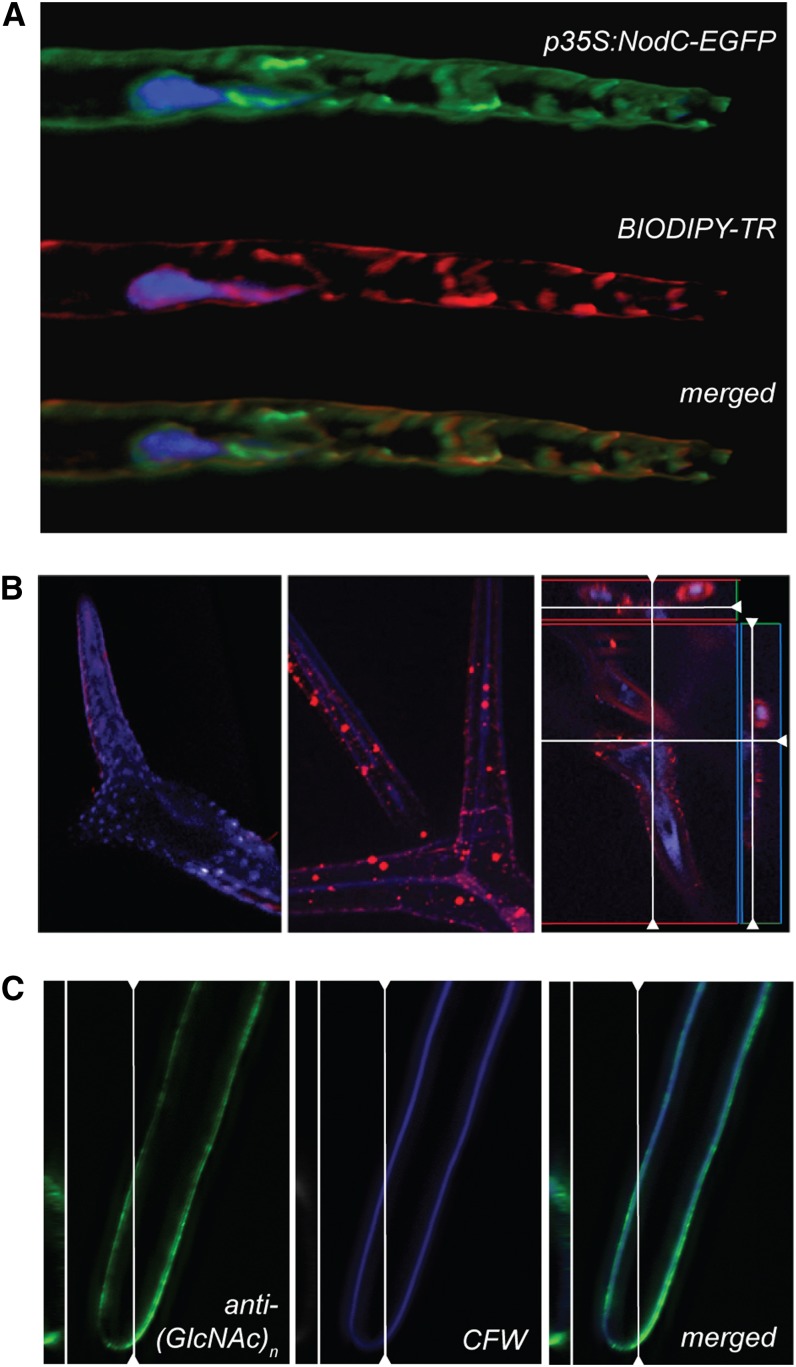
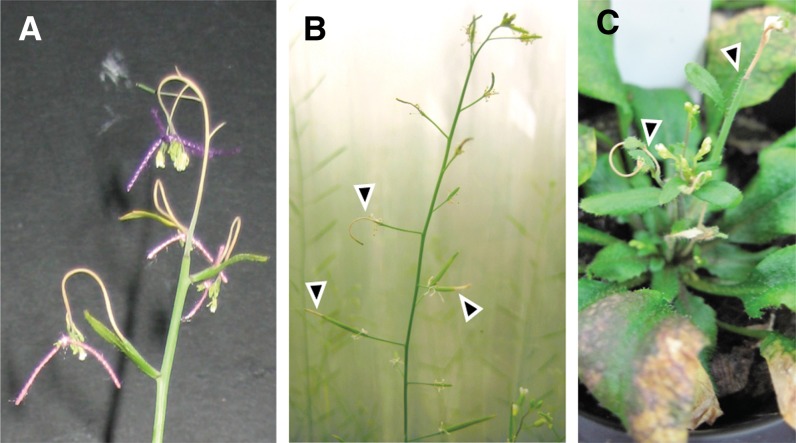
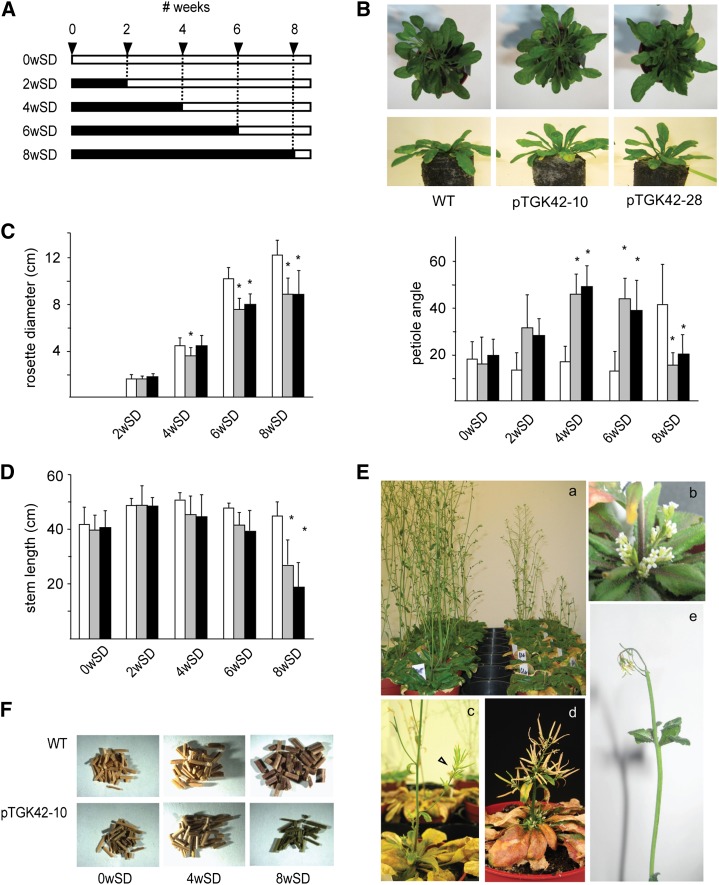
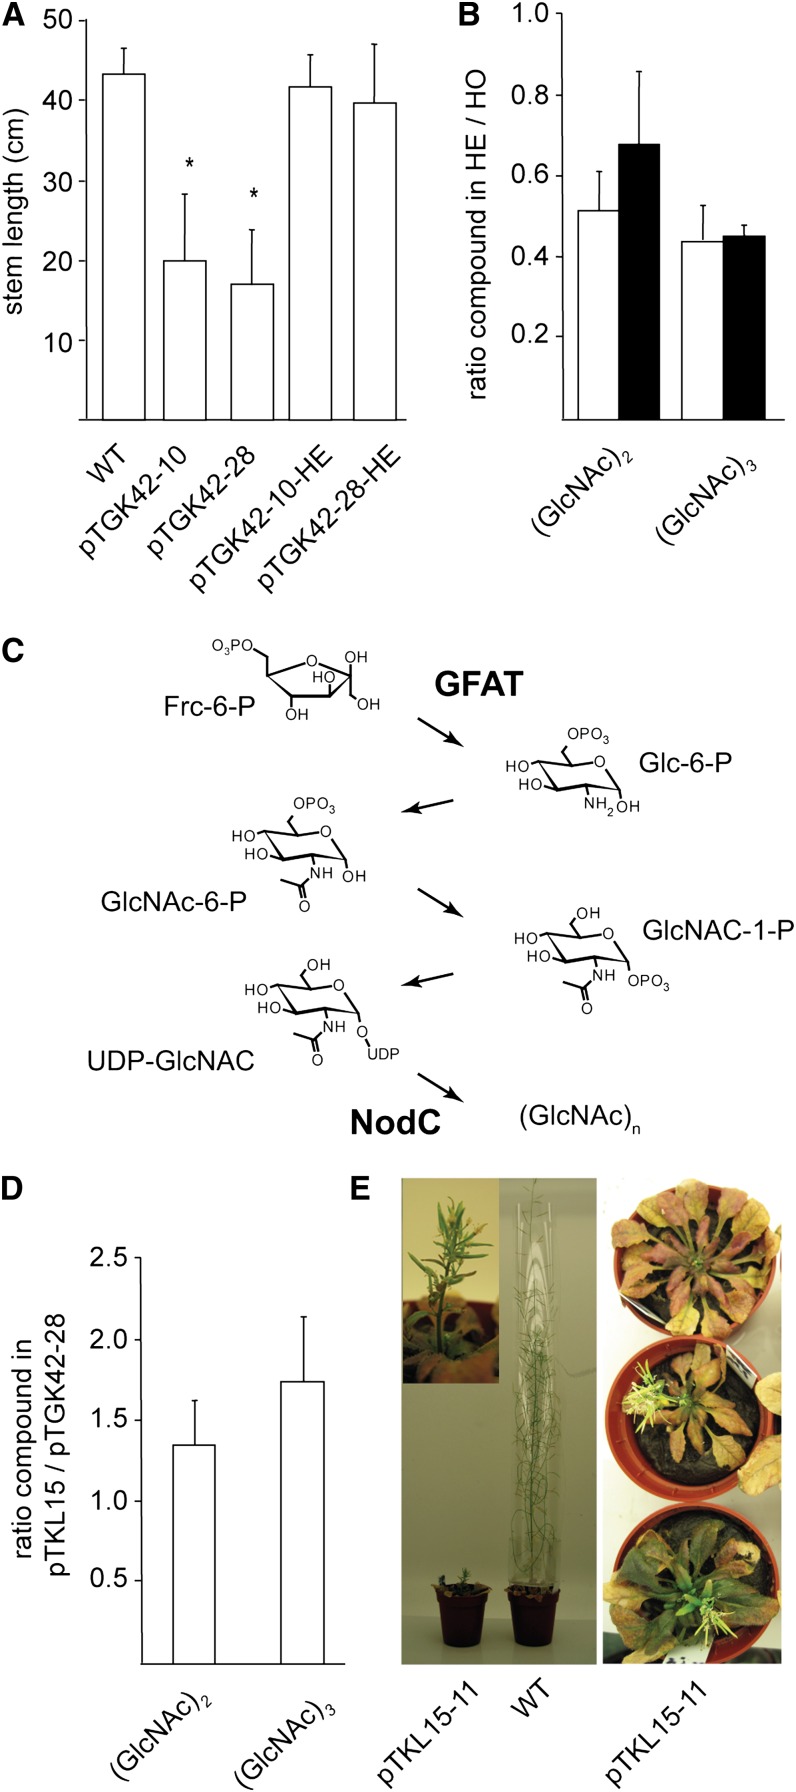
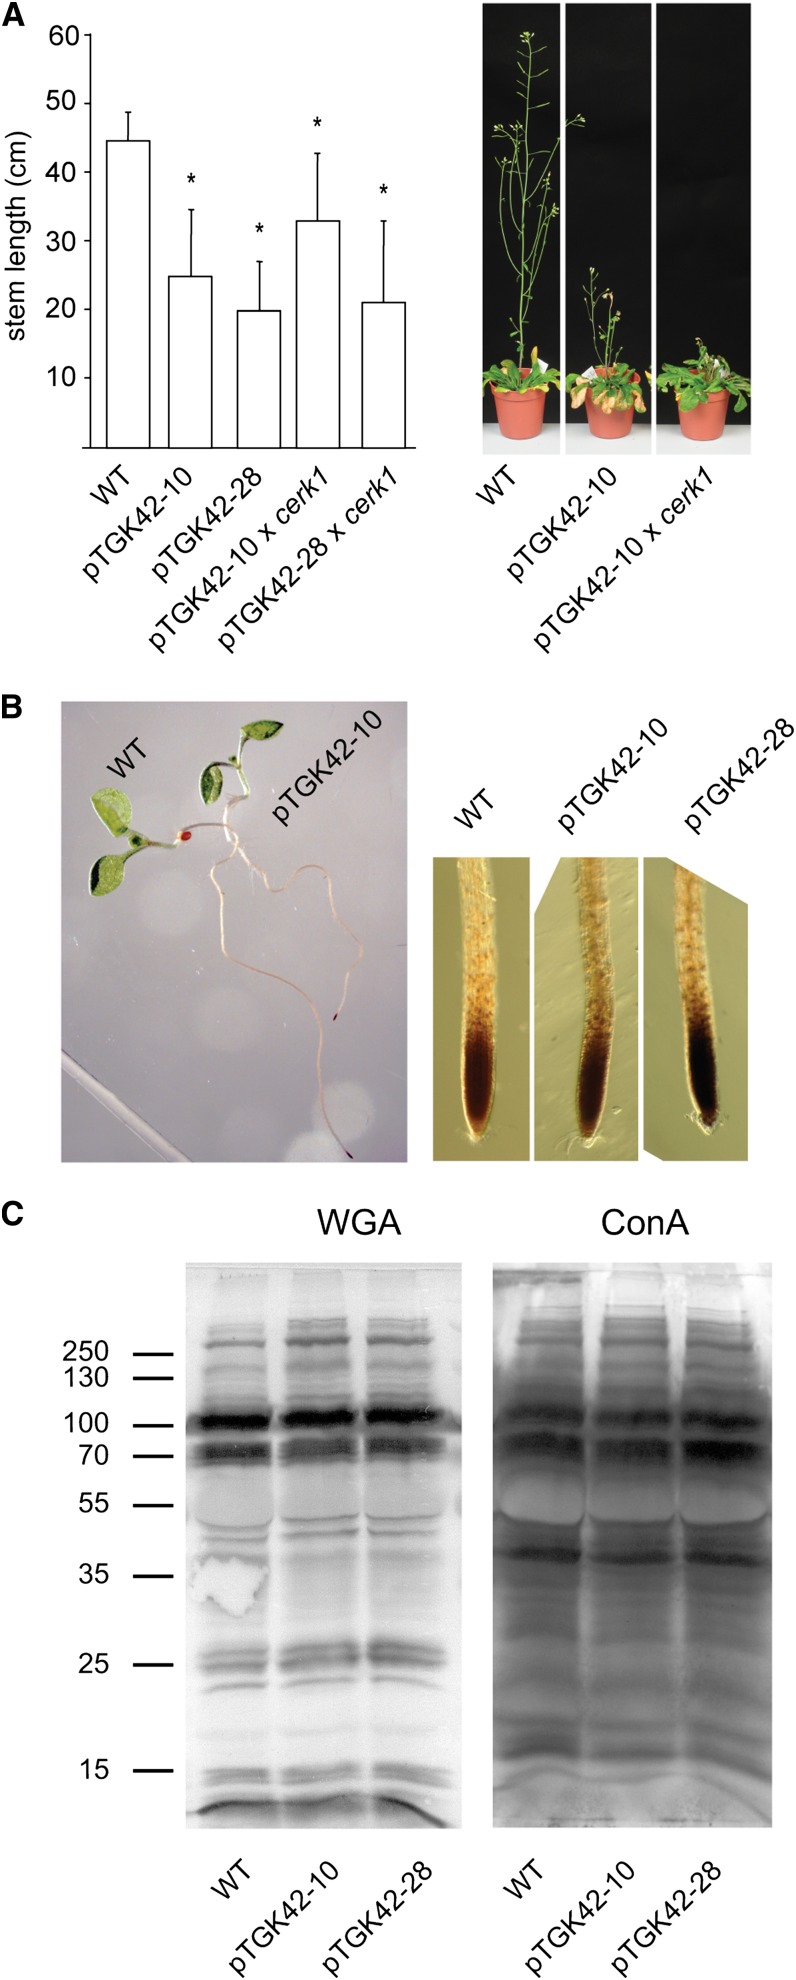
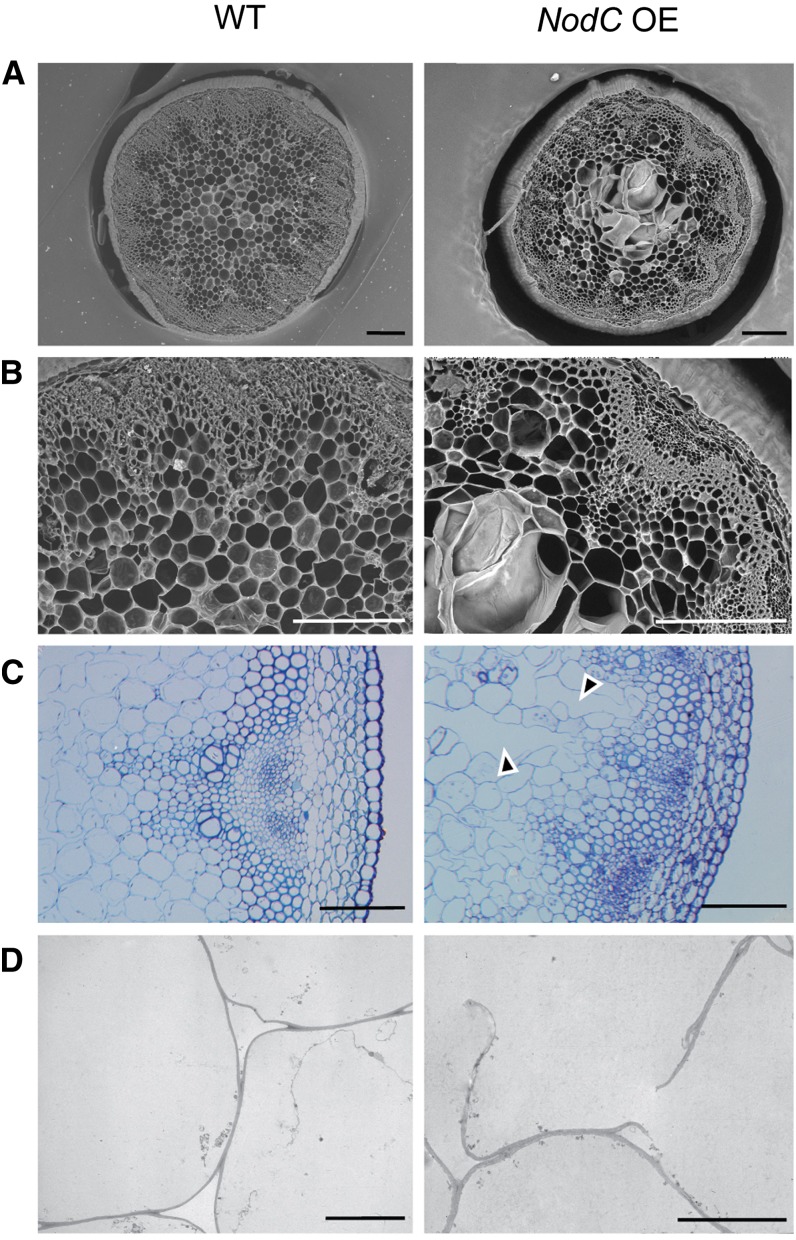
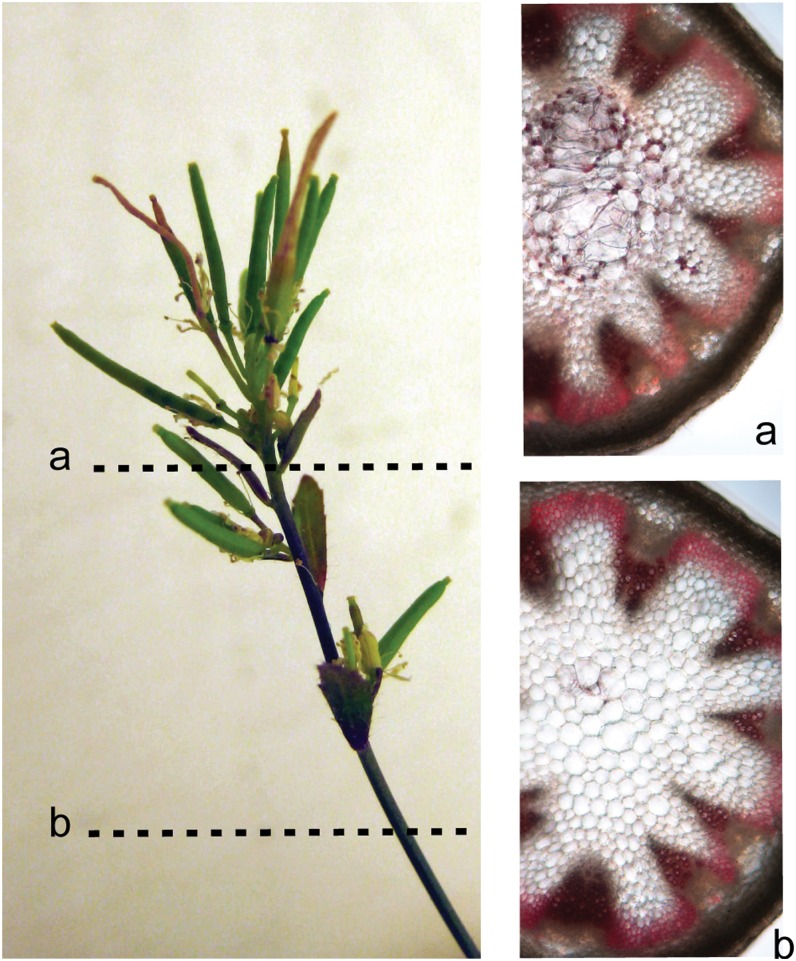
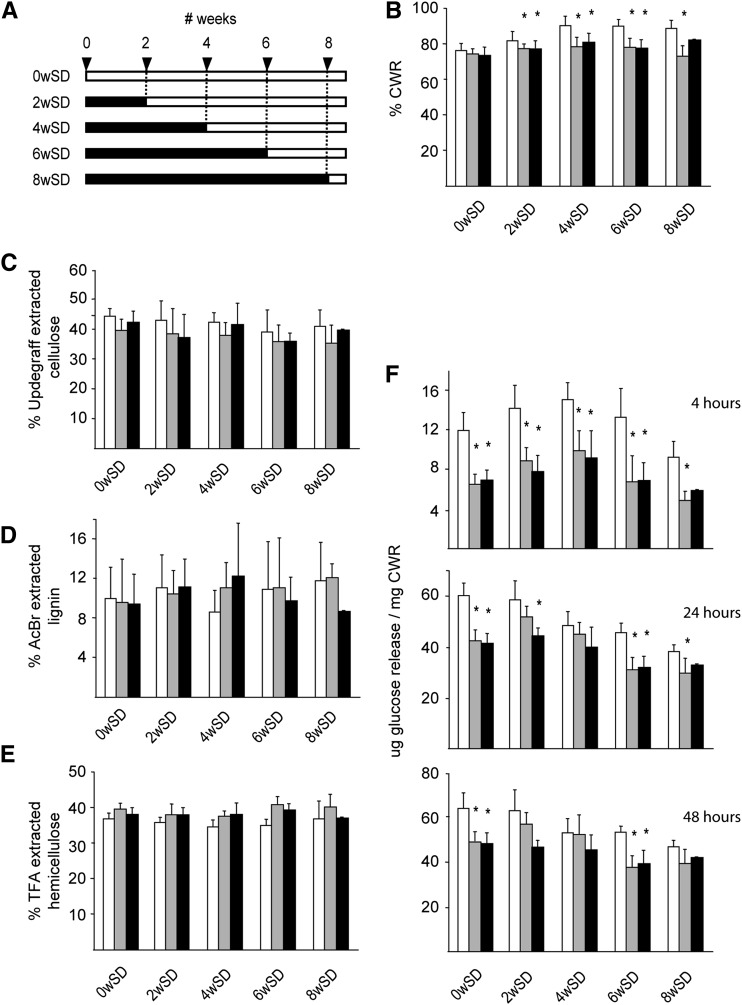
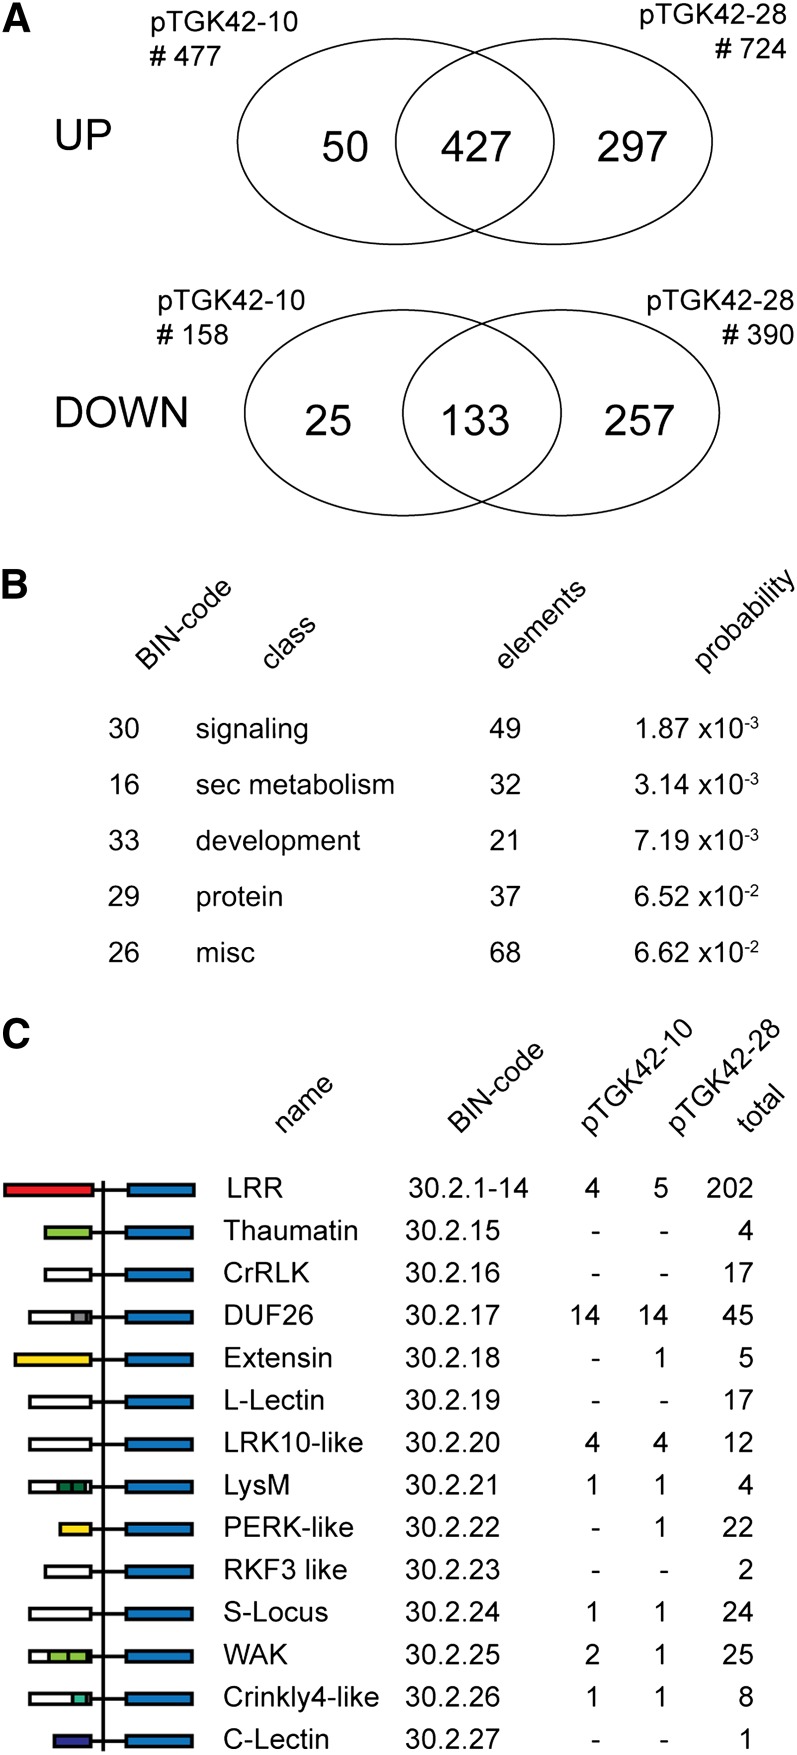
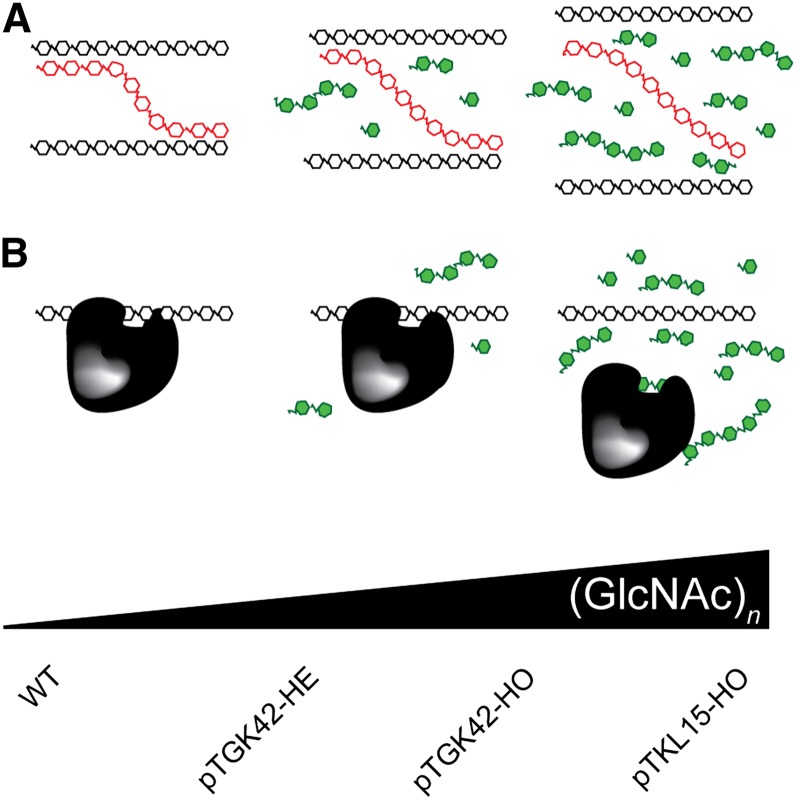
To study the effect of short N-acetylglucosamine (GlcNAc) oligosaccharides on the physiology of plants, N-ACETYLGLUCOSAMINYLTRANSFERASE (NodC) of Azorhizobium caulinodans was expressed in Arabidopsis (Arabidopsis thaliana). The corresponding enzyme catalyzes the polymerization of GlcNAc and, accordingly, β-1,4-GlcNAc oligomers accumulated in the plant. A phenotype characterized by difficulties in developing an inflorescence stem was visible when plants were grown for several weeks under short-day conditions before transfer to long-day conditions. In addition, a positive correlation between the oligomer concentration and the penetrance of the phenotype was demonstrated. Although NodC overexpression lines produced less cell wall compared with wild-type plants under nonpermissive conditions, no indications were found for changes in the amount of the major cell wall polymers. The effect on the cell wall was reflected at the transcriptome level. In addition to genes encoding cell wall-modifying enzymes, a whole set of genes encoding membrane-coupled receptor-like kinases were differentially expressed upon GlcNAc accumulation, many of which encoded proteins with an extracellular Domain of Unknown Function26. Although stress-related genes were also differentially expressed, the observed response differed from that of a classical chitin response. This is in line with the fact that the produced chitin oligomers were too small to activate the chitin receptor-mediated signal cascade. Based on our observations, we propose a model in which the oligosaccharides modify the architecture of the cell wall by acting as competitors in carbohydrate-carbohydrate or carbohydrate-protein interactions, thereby affecting noncovalent interactions in the cell wall or at the interface between the cell wall and the plasma membrane.


Figures

Figure 1.
Figure 1.
Synthesis and accumulation of GlcNAc monomers and oligomers in NodC OE lines. A, NodC catalyzes the transfer of GlcNAc from UDP-GlcNAc to the growing GlcNAc oligomer. B, Retention times of the GlcNAc monomer as well as the different GlcNAc oligomers (DP = 2–6) as determined by authentic reference compounds. During derivatization, each compound is labeled with two 1-phenyl-3-methyl-5-pyrazolone molecules, causing a shift of 331 in positive mode compared with its nominal mass. C, MS spectrum of (GlcNAc)6 as a representative example. The degradation products corresponding to (GlcNAc)n compounds with different DP (n = 1–5) are indicated. D, Quantification of (GlcNAc)n compounds (n = 1–5) by ultra-performance liquid chromatography-MS in NodC OE lines (pTGK42-10 and pTGK42-28) and the wild type (WT). Values are means ± sd.
Figure 2.
Figure 2.
GlcNAc oligomer accumulation in the apoplast. A, NodC-EGFP (green) colocalizes with the Golgi marker BODIPY-TR (red) in Arabidopsis root hairs. The nucleus was counterstained with Hoechst 3342. B, Subcellular localization of GlcNAc monomers and oligomers in leaf trichomes of the wild type (left) or NodC OE line pTGK42-10 (middle and right) using fluorescence-labeled WGA. Longitudinal and transversal sections revealed that the signal is mainly in the extracellular region (right). C, An anti-(GlcNAc)n antibody interacts with epitopes in the cell wall region and colocalizes with the cellulose stain calcofluor white (CFW).
Figure 3.
Figure 3.
NodC OE lines are hypersensitive to mechanical stress. A, pTGK42-10 used as the maternal parent in crossing experiments. Side branches have difficulties supporting the additional load of the threads used to mark the crosses. B, Necrosis of pTGK42-10 siliques and side branches due to mechanical friction against the Aracon tube (arrowheads). C, Young developing inflorescence stem and side branches of pTGK42-10 have died (arrowhead) after touching the inverted cone of the base of the Aracon tube.
Figure 4.
Figure 4.
The conditional phenotype of NodC OE lines. A, Scheme of the experimental setup to assess the conditional phenotype. SD and LD growth conditions are depicted as black and white bars, respectively. Numbers on top correspond to weeks. Each bar represents a set of plants subjected to a specific growth condition, characterized by a specific number of weeks in SD and LD conditions. B, Top, representative images of leaf hyponasty in NodC OE lines compared with the wild type (WT) grown for 6 weeks under SD growth conditions. Bottom, quantification of leaf hyponasty. The y axis gives the petiole angle of the longest leaf at that moment above the horizontal plane. C, Rosette diameter in cm at the moment of transfer from SD to LD growth conditions. D, Length of the inflorescence stems of fully senescent plants. E, Closeups of the different phenotypes observed during stem development. Ea, NodC OE lines (right) and wild-type plants (left) transferred after 8 weeks under SD to LD conditions to induce bolting. The photograph was taken after 20 d under LD conditions. Eb, A cluster of flowers at the base of the inflorescence of a NodC OE plant. Ec and Ed, Internodes are reduced (arrowhead in c), forming in severe cases broomheads (d). Ee, Necrosis of the inflorescence shoot apices. F, Two-millimeter stem sections obtained from 12-cm stem fragments of plants grown under different light conditions. The longer wild-type plants were grown under SD conditions, the more biomass was produced. NodC OE plants grown under similar conditions produced less biomass upon senescence. B to D, Asterisks indicate statistical significance at P < 0.01 as determined by Student’s t test. Values are means ± sd from at least 14 plants per genotype for each batch, with the exception of plants of the 8wSD batch in D, where only five and three plants were used for the lines pTGK42-10 and pTGK42-28, respectively. White bars, Wild type; gray bars, pTGK42-10; black bars, pTGK42-28.
Figure 5.
Figure 5.
Dose-response effect of GlcNAc oligomer concentration on the phenotype. A, Stem length of hemizygous (pTGK42-10-HE and pTGK42-28-HE) and homozygous (pTGK42-10 and pTGK42-28) NodC OE lines grown under similar conditions. B, Ratio of GlcNAc dimer and trimer concentrations in the hemizygote versus its corresponding homozygote. White bars, pTGK42-10; black bars, pTGK42-28. C, Metabolic pathway toward GlcNAc oligomers. The two enzymes expressed in the pTKL15-11 line are indicated: GFAT catalyzes the rate-limiting step toward UDP-GlcNAc and NodC catalyzes the polymerization of UDP-GlcNAc into GlcNAc oligomers. D, Ratio of GlcNAc dimer and trimer concentrations in pTKL15-11 versus pTGK42-28. E, Phenotype of Arabidopsis line pTKL15-11 in comparison with a wild-type plant of similar age grown under similar growth conditions (6 weeks under SD conditions and 3 weeks under LD conditions). The inset shows a detail of a representative broomhead phenotype. Asterisks indicate statistical significance from wild-type plants of the same batch at P < 0.01 as determined by Student’s t test. Values are means ± sd.
Figure 6.
Figure 6.
The phenotype upon (GlcNAc)n accumulation is independent of the chitin receptor CERK1 and is unrelated to oxidative or ER stress. A, Left, stem length of NodC OE lines pTGK42-10 and pTGK42-28 in the wild-type (WT) and cerk1 background. Right, extreme stem phenotype of NodC OE line pTGK42-10 and pTGK42-10 × cerk1 compared with the wild type. B, Left, visualization of H2O2 production in 10-d-old Arabidopsis seedlings by incubating roots in DAB. Right, detail of the root tip. C, Glycosylation pattern of proteins of the wild type and NodC OE lines. Proteins were extracted from fully developed leaves of rosette-stage plants. Blotting was performed using WGA-peroxidase (left) or ConA-peroxidase (right). Marker was the PageRuler Plus Prestained Protein Ladder. The molecular masses are indicated in kD. Asterisks indicate statistical significance compared with the wild type at P < 0.01 as determined by Student’s t test. Values are means ± sd.
Figure 7.
Figure 7.
Microscopic analyses of transverse stem sections of the NodC OE line pTGK42-28 (right) compared with the wild type (WT; left). A, Scanning electron microscopy images of a 250-µm vibroslice stem section revealing syncytium-like structures in the pith region of NodC OE lines. Bars = 200 µm. B, Detail of A. Bars = 200 µm. C, Toluidine blue-stained semithin stem sections illustrating that ruptured cell walls are at the base of the observed modifications in the pith region. Arrowheads point to modified pith cells. Bars = 100 µm. D, Transmission electron microscopy cross sections confirming the presence of ruptured cell wall in pith cells of NodC OE lines. Bars = 10 µm. Similar defects were observed in pTGK42-10 lines.
Figure 8.
Figure 8.
Ectopic lignification of the pith cells in NodC OE lines. A, Visualization by Wiesner staining of lignin in stem sections of the NodC OE line pTGK42-28 at two different positions along the stem. The apical region with reduced internode length is characterized by the accumulation of ectopic lignin in the pith region. The enlarged pith cells due to the sheared cell walls are clearly visible in this region. B, Sections within the internode with a normal phenotype have no ectopic lignification and no enlarged pith cells. Similar effects were observed in line pTGK42-10.
Figure 9.
Figure 9.
Chemical composition of the cell walls of the bottom 12-cm stem section of NodC OE lines. A, Scheme of the experimental setup to assess the conditional phenotype (for details, see Fig. 4A). B, Percentage of CWR in dry stem tissue of NodC OE and wild-type plants. C, Cellulose content in percentage of CWR as determined by Updegraff extraction. D, Lignin content in percentage of CWR as determined by acetyl bromide extraction. E, Percentage of TFA-extractable carbohydrates from CWR. F, Total Glc released during saccharification of purified CWR. The y axis denotes the Glc release. Three different hydrolysis times were used: 4 h (top), 24 h (middle), and 48 h (bottom). Day/night conditions for the different batches are explained in Figure 4A. Asterisks indicate statistical significance from wild-type plants of the same batch at P < 0.01 as determined by Student’s t test. Values are means ± sd from at least eight plants per genotype for each batch, with the exception of the 8wSD set, where only four (pTGK42-10) or one (pTGK42-28) stems were available. White bars, Wild type; gray bars, pTGK42-10; black bars, pTGK42-28.
Figure 10.
Figure 10.
Gene expression in stem tissue of Arabidopsis upon NodC expression. A, Venn diagrams showing the number of significantly differentially expressed genes upon NodC expression with an expression ratio of at least 2 (P < 0.05). The Venn diagrams indicate the degree of overlap between the different NodC OE lines. Data are derived from microarray analysis using two different NodC OE lines (pTGK42-10 and pTGK42-28). B, Top five overrepresented BIN classes. Only genes at least 2-fold up- or down-regulated in both NodC OE lines (pTGK42-10 and pTGK42-28) compared with the wild type were included. C, Differentially expressed RLKs upon NodC OE in Arabidopsis. For each of the RLK families, the MapMan BIN code is given as well as the total number of genes in this family and the number of significantly differentially expressed family members in pTGK42-10 and pTGK42-28. DUF26 RLKs are overrepresented in the data set where stem tissue of pTGK42-28 or pTGK42-10 is compared with the wild-type. At left, the domain structure of the different RLKs as defined by MapMan is given.
Figure 11.
Figure 11.
Suggested competition model. Different lines with different (GlcNAc)n concentrations were generated in this study (bottom), and the penetrance of the phenotype is positively correlated with the (GlcNAc)n concentration. The molecular interaction blocked by (GlcNAc)n can be either a carbohydrate-carbohydrate interaction (A) or a carbohydrate-protein interaction (B). WT, Wild type.

References

    1. Allen AK, Neuberger A, Sharon N. (1973) The purification, composition and specificity of wheat-germ agglutinin. Biochem J 131: 155–162 - PMC - PubMed
    1. Barker D, Bessou P, Jankowska E, Pages B, Stacey MJ. (1975) Distribution of static and dynamic gamma axons to cat intrafusal muscle-fibers. J Anat 119: 199–200
    1. Barny MA, Schoonejans E, Economou A, Johnston AWB, Downie JA. (1996) The C-terminal domain of the Rhizobium leguminosarum chitin synthase NodC is important for function and determines the orientation of the N-terminal region in the inner membrane. Mol Microbiol 19: 443–453 - PubMed
    1. Becker B, Holtgrefe S, Jung S, Wunrau C, Kandlbinder A, Baier M, Dietz KJ, Backhausen JE, Scheibe R. (2006) Influence of the photoperiod on redox regulation and stress responses in Arabidopsis thaliana L. (Heynh.) plants under long- and short-day conditions. Planta 224: 380–393 - PubMed
    1. Boerjan W, Ralph J, Baucher M. (2003) Lignin biosynthesis. Annu Rev Plant Biol 54: 519–546 - PubMed

Publication types

MeSH terms

Associated data