Clinical Trial
. 2014 Mar 24;9(3):e92815.
doi: 10.1371/journal.pone.0092815. eCollection 2014.

Association of DSC3 mRNA down-regulation in prostate cancer with promoter hypermethylation and poor prognosis

Affiliations
Clinical Trial

Association of DSC3 mRNA down-regulation in prostate cancer with promoter hypermethylation and poor prognosis

Jincheng Pan et al. PLoS One. .

Abstract

Background: Desmocollin 3 (DSC3), a member of the cadherin gene superfamily, is associated with pathogenesis of some cancers, but its role in prostate cancer (PCa) remains largely unknown.

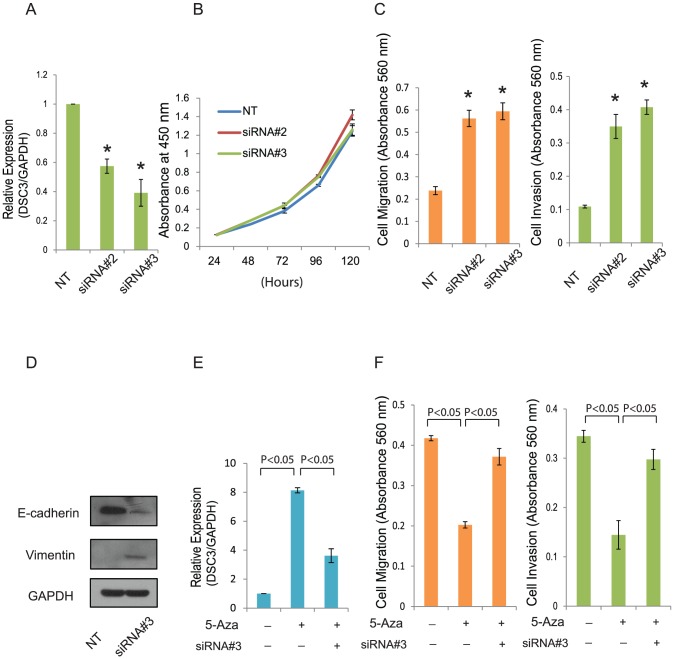
Methods: DSC3 gene expression level in available PCa microarray dataset was examined using the Oncomine database. DSC3 transcript expression in prostate cell line panel and an independent tissue cohort (n = 52) was estimated by quantitative PCR (Q-PCR). Epigenetic status of DSC3 gene promoter in PCa was investigated by uploading three dataset (ENCODE Infinium 450K array data and two methylation sequencing) in UCSC genome browser. While pyrosequencing analysis measured promoter DNA methylation, Q-PCR estimates were obtained for DSC3 transcript re-expression after 5-Aza-deoxycytidine (5-Aza) treatment. Clinical relevance of DSC3 expression was studied by Kaplan-Meier survival analysis. Finally, functional studies monitoring cell proliferation, migration and invasion were performed in prostate cell lines after siRNA mediated DSC3 knockdown or following 5-Aza induced re-expression. EMT markers Vimentin and E-cadherin expression was measured by Western Blot.

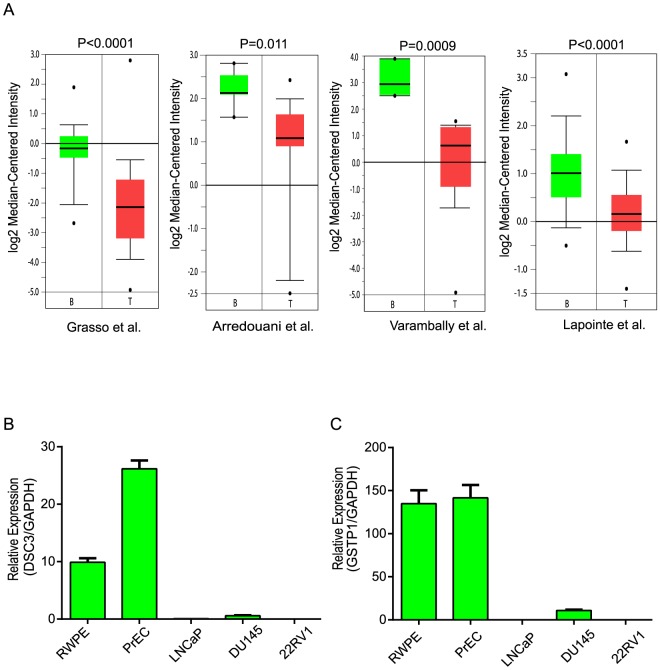
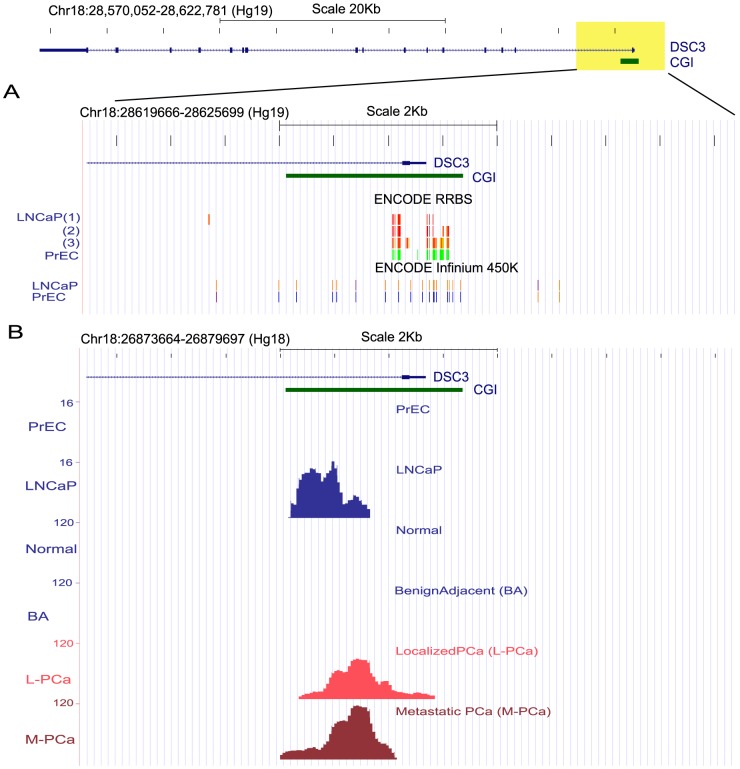
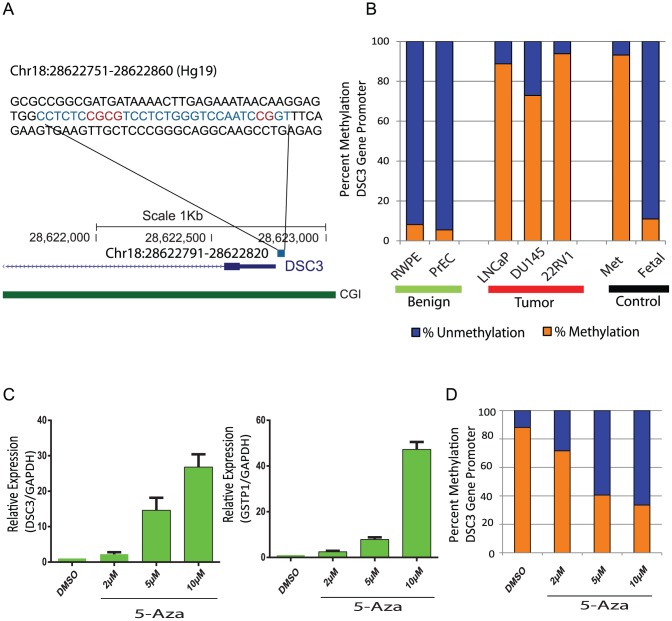
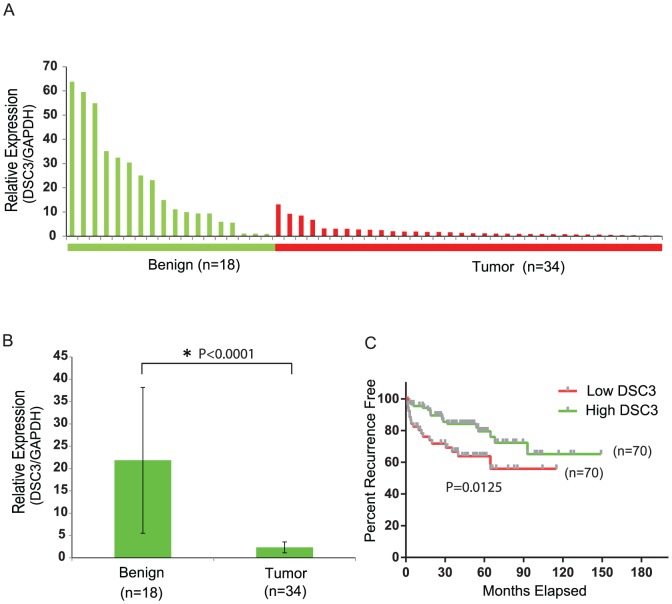
Results: Microarray data analyses revealed a significant decrease in DSC3 transcript expression in PCa, compared to benign samples. Q-PCR analysis of an independent cohort revealed DSC3 transcript down-regulation, both in PCa cell lines and tumor tissues but not in their benign counterpart. Examination of available NGS and Infinium data identified a role for epigenetic regulation DSC3 mRNA reduction in PCa. Pyrosequencing confirmed the increased DSC3 promoter methylation in cancer cell lines and restoration of transcript expression upon 5-Aza treatment further corroborated this epigenetic silencing mechanism. Importantly Kaplan-Meier analysis of an outcome cohort showed an association between loss of DSC3 expression and significantly increased risk of biochemical recurrence. Functional studies indicate a role for epithelial-mesenchymal transition in DSC3 regulated cell migration/invasion.

Conclusion: Taken together, our data suggests that DNA methylation contributes to down-regulation of DSC3 in prostate cancer, and loss of DSC3 predicts poor clinical outcome.


Conflict of interest statement

Competing Interests: The authors have declared that no competing interests exist.

Figures

Figure 1
Figure 1. DSC3 Expression is Downregulated in Prostate Cancer.
(A) Boxplots representation of DSC3 mRNA expression in four independent prostate cancer microarray datasets, B = Benign, T = Tumor. First author and statistical significance are indicated. (B) Q-PCR analysis of DSC3 and (C) GSTP1 expression in a panel of prostate cell lines; PrEC-prostate normal epithelial cells, RWPE-benign prostate cell line, LNCaP, Du145, 22RV1 are metastatic prostate cancer cell lines.
Figure 2
Figure 2. DSC3 Promoter is Hypermethylated in Prostate Cancer.
(A) Top panel depicts the UCSC genome browser representation of the genomic organization of DSC3 gene present in human chromosome 18 (28570052-28622781), where exons are indicated by solid boxes and introns by the blue line. The CpG island (CGI) associated with the DSC3 gene promoter is represented as horizontal green solid bar. DNA methylation status of the regions shaded in yellow (+/−3 kb from transcription start site) is presented below. ENCODE Infinium 450K Bead Arrays and Reduced Representation Bisulfite Sequencing datasets (RRBS) showed that DSC3 gene promoter is hypermethylated in LNCaP as compared to the benign cell line PrEC. The CG positions assayed by these methods are represented as vertical bars colored according to their methylation status. ENCODE RRBS, red (100%), yellow (50%), green (0%) are methylated; ENCODE Infinium 450K, orange  =  methylated (score ≥600), bright blue  =  unmethylated (0< score ≤200). LNCaP(1):LNCaP cells treated with androgen; LNCaP(2):LNCaP data from Duke University; LNCaP(3):LNCaP data from University of Washington. (B) Representation of MethylPlex NGS sequencing data (PrEC, LNCaP, prostate normal, benign adjacent, localized PCa and metastatic PCa tissues) for DSC3. Methylated regions observed in the corresponding sample groups are depicted as peaks and numbers in the y-axis denote the peak heights.
Figure 3
Figure 3. Hypermethylation of DSC3 Promoter in PCa Cell Lines.
(A) Sequence of the DSC3 promoter (Chr18:28622751-28622860) and the region analyzed by pyrosequencing are given in blue (Chr18:28622791-28622820) and the CG positions monitored within are indicated in red. CGI, CpG island. (B) Bar plot depicts the average of the percent methylation in the three CG positions in prostate cell lines. Blue-percent unmethylation; Orange-percent methylation; Bi-sulfite converted universally methylated gDNA and fetal DNA were used as positive and negative controls respectively. (C) DSC3 expression as assessed by Q-PCR in LNCaP cells treated with 5-Aza-deoxycytidine (5-Aza), GSTP1 was included as a positive control. (D) Bar plot depicts the average of the percent methylation in the three CG positions in LNCaP treated with 5-Aza.
Figure 4
Figure 4. DSC3 is mRNA is Down-regulated in an Independent PCa Cohort and its Expression Correlates with Biochemical Recurrence.
(A) Q-PCR for DSC3 transcript in a cohort of benign prostate (n = 18) and prostate cancer (n = 34) tissues. (B) A summary histogram of the expression values of DSC3 in prostate benign and tumor samples. (C) Kaplan-Meier analysis showed that low DSC3 group patients had a significantly increased risk of recurrence than the high DSC3 group patients (P = 0.0125).
Figure 5
Figure 5. Effect of DSC3 on the Migration/Invasion Potential of Prostate Cells.
(A) DSC3 knockdown by siRNA in benign prostate cell line RWPE as detected by Q-PCR.*indicates values that are significantly different than the Non-Target group (NT). siRNA#2 and siRNA#3 are two individual DSC3 siRNA. (B) Effect of DSC3 knockdown on proliferation in RWPE cells by WST-1. (C) Effect of DSC3 knockdown on migration through Transwell and invasion through Matrigel in RWPE cells. Migrated and invaded cells were stained with crystal violet, solubilized and quantitated by measuring absorbance at 560 nm.*indicates values that are significantly different than the Non-Target group (NT). (D) E-cadherin and Vimentin expression assessed by Western blot analysis in RWPE cell treated with Non-Target siRNA or DSC3 siRNA. (E) Q-PCR for DSC3 using total RNA extracted from PCa cell line Du145 treated with 5-Aza or DSC3 siRNA. (F) The migration and invasion potential of the untreated and 5-Aza treated Du145 were assessed by Transwell or Matrigel assay. Migrated and invaded cells were stained with crystal violet, solubilized and quantitated by measuring absorbance at 560 nm.

References

    1. Siegel R, Naishadham D, Jemal A (2013) Cancer statistics, 2013. CA Cancer J Clin 63: 11–30. - PubMed
    1. Tomlins SA, Aubin SM, Siddiqui J, Lonigro RJ, Sefton-Miller L, et al. (2011) Urine TMPRSS2:ERG fusion transcript stratifies prostate cancer risk in men with elevated serum PSA. Sci Transl Med 3: 94ra72. - PMC - PubMed
    1. Choudhury AD, Eeles R, Freedland SJ, Isaacs WB, Pomerantz MM, et al. (2012) The role of genetic markers in the management of prostate cancer. Eur Urol 62: 577–587. - PubMed
    1. Salagierski M, Schalken JA (2012) Molecular diagnosis of prostate cancer: PCA3 and TMPRSS2:ERG gene fusion. J Urol 187: 795–801. - PubMed
    1. Borno ST, Fischer A, Kerick M, Falth M, Laible M, et al. (2012) Genome-wide DNA methylation events in TMPRSS2-ERG fusion-negative prostate cancers implicate an EZH2-dependent mechanism with miR-26a hypermethylation. Cancer Discov 2: 1024–1035. - PubMed

Publication types