. 2014 May;34(4):619-30.
doi: 10.1007/s10571-014-0049-6. Epub 2014 Mar 25.

Vinyl chloride monomer (VCM) induces high occurrence of neural tube defects in embryonic mouse brain during neurulation

Affiliations

Vinyl chloride monomer (VCM) induces high occurrence of neural tube defects in embryonic mouse brain during neurulation

Hongyu Quan et al. Cell Mol Neurobiol. 2014 May.

Abstract

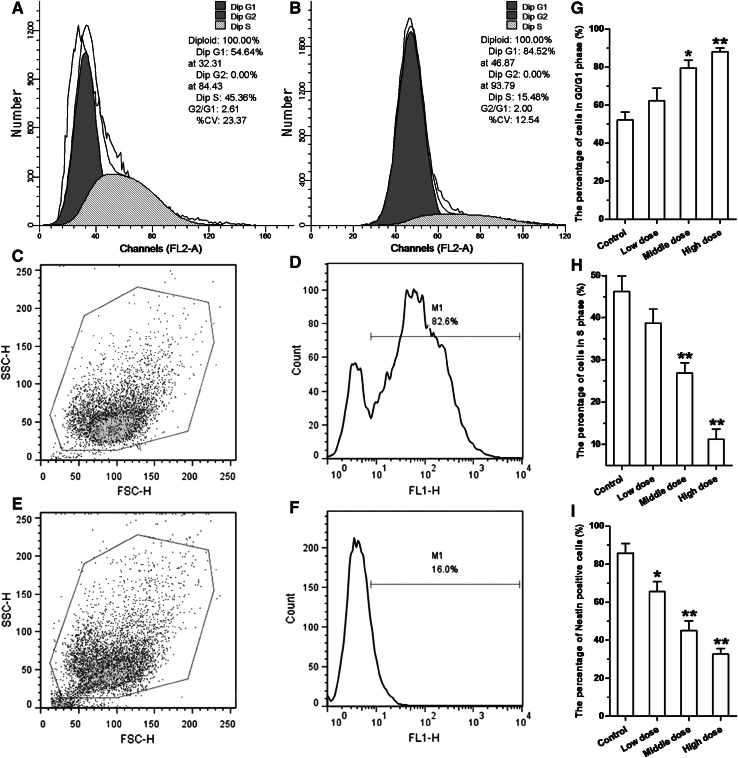
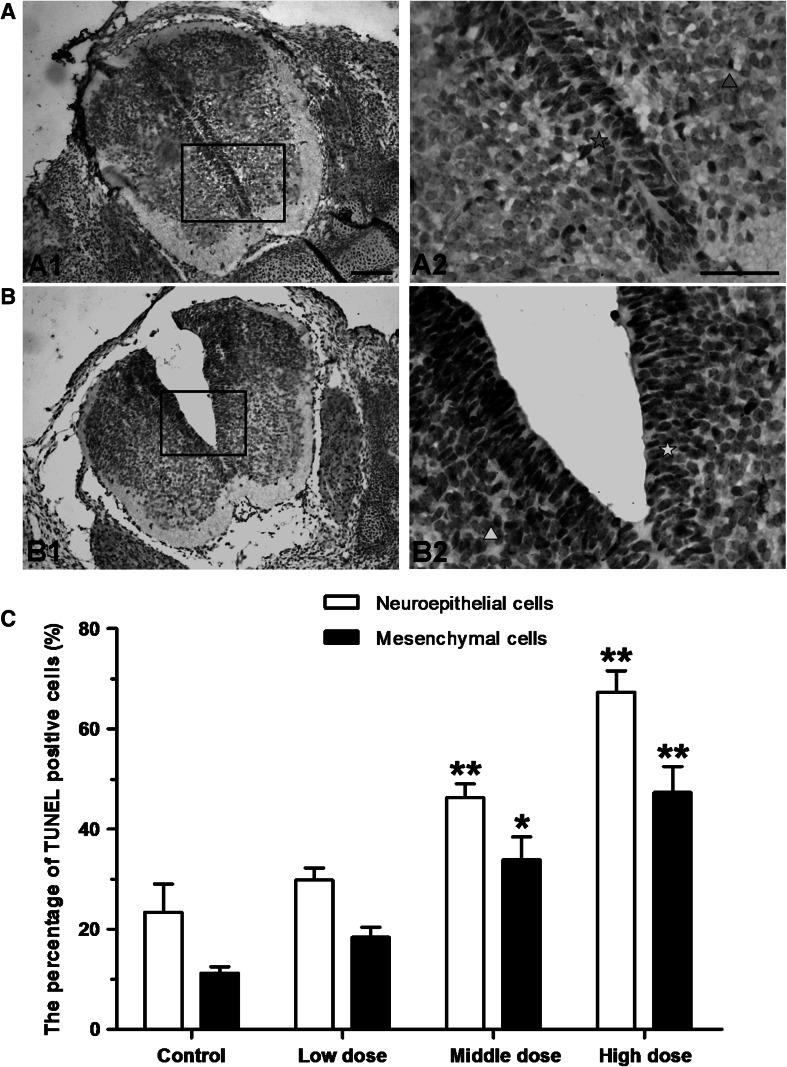
The aim of this study was to explore the direct embryonic teratogenicity of vinyl chloride monomer (VCM), especially the toxic effects on the early development of the nervous system and its underlying mechanisms. Pregnant mice at embryonic day 6.5 (E6.5) were injected with different doses of VCM (200, 400 and 600 mg/kg) and embryos were harvested at E10.5. Our results showed that doses higher than 400 mg/kg of VCM increased the incidence of malformed embryos, especially the neural tube defects (NTDs). In addition, high-dose of VCM decreased mitotic figure counts in the neuroepithelium and enhanced the percentage of cells in G0/G1 phase, while they were reduced in S phase. The more VCM was injected into mice, the fewer positive PCNA cells were seen and the more positive TUNEL cells were observed in the neuroepithelium. Moreover, significant increases in the levels of caspase-3 protein were observed in NTD embryos. Our results demonstrate that during early pregnancy, exposure to doses higher than 400 mg/kg of VCM increases the incidence of malformations and particularly the rate of NTDs. High-dose of VCM inhibits the proliferation of neural cells and induces cell apoptosis, leading to an imbalance in the ratio of proliferation and apoptosis. Meanwhile, the apoptosis of neuroepithelial cells might be accelerated by the activation of the caspase-3 pathway, and it might be a reason for NTDs.


Conflict of interest statement

We declare that we have no conflict of interest.

Figures

Fig. 1
Fig. 1
General observation images of morphological changes in mouse embryos treated with VCM. a The normal embryo at E10.5 in the control group with a well-stacked head (red arrow), complete, smooth face (red star), and a long, thin, curved tail (red arrowhead). b Dead embryo induced by high-dose of VCM. c Non-closure at the whole brain (blue arrow) in the embryo treated with high-dose of VCM. d Short tail (blue triangle) in embryos exposed to middle-dose of VCM. e The embryo treated with middle-dose of VCM exhibited non-closure at the top of the cranium (blue arrow). f The embryo with a bulge in the face (blue star) in the middle-dose group. Bar 50 μm (in a, b, c, d, e and f) (Color figure online)
Fig. 2
Fig. 2
High-dose of VCM leads to changes of pathology and mitosis in the neuroepithelium. a) HE stained image of normal embryonic brain at E10.5. b The embryonic brain image of HE staining exposed to middle-dose of VCM. c The semi-thin section image in normal neuroepithelium showed the nuclei with mitoses mainly stained red (red arrow). d Few mitoses were seen in the neuroepithelium (blue arrow) in the high VCM treated group. e The mitotic figure counts of all groups are depicted in the bar graphs. The values represent the mean ± SEM (n = 5). *P < 0.05; **P < 0.01. Bar 200 μm (in a and b); 50 μm (in c and d) (Color figure online)
Fig. 3
Fig. 3
High-dose of VCM affects the cell cycle dynamics and the number of nestin-positive cells. a, b Flow cytometry cell cycle profiles of the prepared cell suspension in the normal control group and the VCM-induced NTD group, respectively. c, d The dot plot of forward scatter (FSC) versus side scatter (SSC) and the histogram representation of the nestin-positive cells of the nestin-labeled cell suspension in the normal control group, respectively. e, f The dot plot of FSC versus SSC and the histogram representation of the nestin-positive cells of the nestin-labeled cell suspension in the VCM-induced NTD group, respectively. g The percentage of cells in G0/G1 phase is depicted in the bar graphs. The values represent the mean ± SEM (n = 5). *P < 0.05; **P < 0.01. h The percentage of cells in S phase is depicted in the bar graphs. The values represent the mean ± SEM (n = 5). *P < 0.05; **P < 0.01. i The percentage of nestin-positive cells is depicted in the bar graphs. The values represent the mean ± SEM (n = 5). *P < 0.05; **P < 0.01 (Color figure online)
Fig. 4
Fig. 4
Doses higher than 400 mg/kg of VCM affect the proliferation of neuroepithelial cells. a Immunohistochemical staining image of the normal embryonic neuroepithelium at E10.5 showed that the PCNA-positive cells were widely distributed (red star), around which they appeared diffusely (red triangle). b The PCNA-positive cells were significantly decreased in the neuroepithelium (blue star) as well as in adjacent tethered tissues (blue triangle) in the embryos treated with high-dose of VCM. c Relative quantification of PCNA-positive cells is depicted in the bar graphs. The values represent the mean ± SEM (n = 5). *P < 0.05; **P < 0.01. Bar 50 μm (in a and b) (Color figure online)
Fig. 5
Fig. 5
High-dose of VCM affects the apoptosis of neuroepithelial cells. a TUNEL-positive cells appeared diffusely in the neuroepithelium (red star) with the cell nucleus stained brown in normal embryos at E10.5, but with only a few in the adjacent tethered tissues (red triangle). A 2 was the high magnification image of the black rectangle in A 1. b The TUNEL-positive cells had an observable increase in the neuroepithelium (blue star) in the high VCM induced group, around which they resembled with that in the control group (blue triangle). c Relative quantification of TUNEL assay analysis is depicted in the bar graphs. The values represent the mean ± SEM (n = 5). *P < 0.05; **P < 0.01. Bar 50 μm (in a and b) (Color figure online)
Fig. 6
Fig. 6
Doses higher than 400 mg/kg of VCM change the expression of apoptosis-related protein caspase-3. a Western blot analysis showed that caspase-3 protein levels increased in the middle- and high-dose groups compared with normal control and low-dose groups. b Relative quantification of western blot analysis is depicted in the bar graphs. The values represent the mean ± SEM (n = 5). *P < 0.05; **P < 0.01

Similar articles

Cited by

References

    1. Bergman K (1982) Reactions of vinyl chloride with RNA and DNA of various mouse tissues in vivo. Arch Toxicol 49(2):117–129 - PubMed
    1. Bergman K (1983) Interactions of trichloroethylene with DNA in vitro and with RNA and DNA of various mouse tissues in vivo. Arch Toxicol 54(3):181–193 - PubMed
    1. Cao Y, Zhao Z, Eckert RL, Reece EA (2011) Protein kinase Cbeta2 inhibition reduces hyperglycemia-induced neural tube defects through suppression of a caspase 8-triggered apoptotic pathway. Am J Obst Gynecol 204(3):226, e221–e225. doi:10.1016/j.ajog.2011.01.013 - PMC - PubMed
    1. Chappell JH Jr, Wang XD, Loeken MR (2009) Diabetes and apoptosis: neural crest cells and neural tube. Apoptosis Int J Program Cell Death 14(12):1472–1483. doi:10.1007/s10495-009-0338-6 - PMC - PubMed
    1. Copp AJ, Greene ND (2010) Genetics and development of neural tube defects. J Pathol 220(2):217–230. doi:10.1002/path.2643 - PMC - PubMed

Publication types

LinkOut - more resources