

Quantifying iron-oxide nanoparticles at high concentration based on longitudinal relaxation using a three-dimensional SWIFT Look-Locker sequence
- PMID: 24664527
- PMCID: PMC4024088
- DOI: 10.1002/mrm.25181
Quantifying iron-oxide nanoparticles at high concentration based on longitudinal relaxation using a three-dimensional SWIFT Look-Locker sequence
Abstract
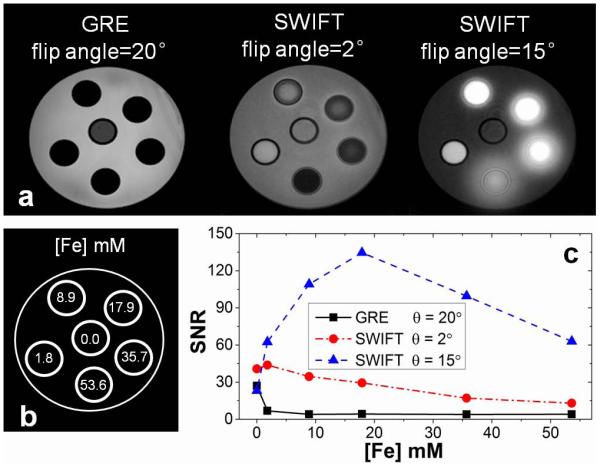
Purpose: Iron-oxide nanoparticles (IONPs) have proven utility as contrast agents in many MRI applications. Previous quantitative IONP mapping has been performed using mainly T2 * mapping methods. However, in applications requiring high IONP concentrations, such as magnetic nanoparticles based thermal therapies, conventional pulse sequences are unable to map T2 * because the signal decays too rapidly. In this article, sweep imaging with Fourier transformation (SWIFT) sequence is combined with the Look-Locker method to map T1 of IONPs in high concentrations.
Methods: T1 values of agar containing IONPs in different concentrations were measured with the SWIFT Look-Locker method and with inversion recovery spectroscopy. Precisions of Look-Locker and variable flip angle (VFA) methods were compared in simulations.
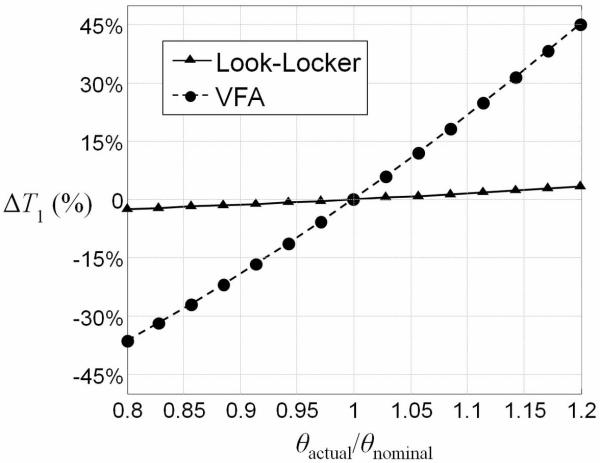
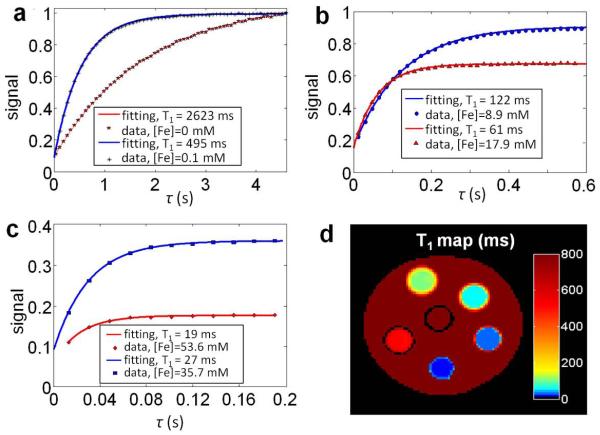
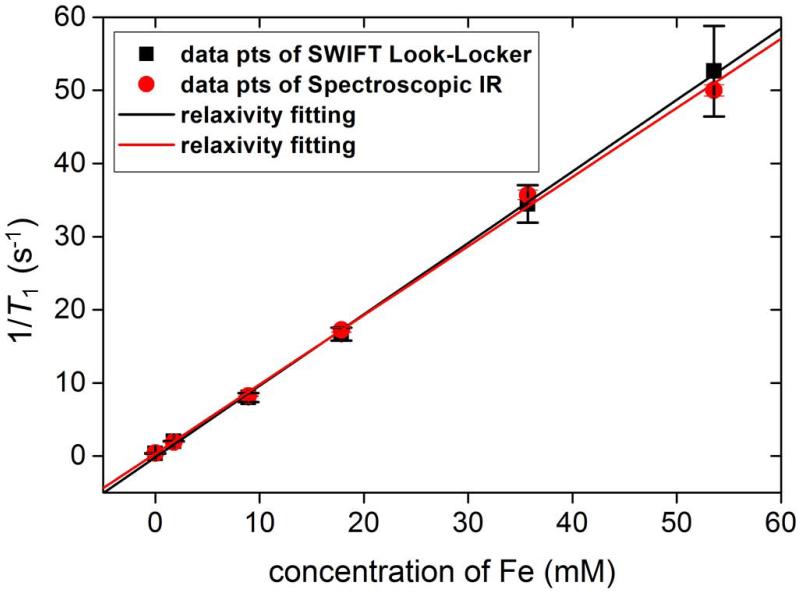
Results: The measured R1 (=1/T1 ) has a linear relationship with IONP concentration up to 53.6 mM of Fe. This concentration exceeds concentrations measured in previous work by almost an order of magnitude. Simulations show SWIFT Look-Locker method is also much less sensitive to B1 inhomogeneity than the VFA method.
Conclusion: SWIFT Look-Locker can accurately measure T1 of IONP concentrations ≤53.6 mM. By mapping T1 as a function of IONP concentration, IONP distribution maps might be used in the future to plan effective magnetic nanoparticle hyperthermia therapy.
Keywords: Look-Locker; SWIFT; T1 mapping; iron-oxide nanoparticles; magnetic hyperthermia; positive contrast.
Copyright © 2014 Wiley Periodicals, Inc.
Figures
Similar articles
-
T₁ estimation for aqueous iron oxide nanoparticle suspensions using a variable flip angle SWIFT sequence.Magn Reson Med. 2013 Aug;70(2):341-7. doi: 10.1002/mrm.24831. Epub 2013 Jun 28. Magn Reson Med. 2013. PMID: 23813886 Free PMC article.
-
The Black Book of Psychotropic Dosing and Monitoring.Psychopharmacol Bull. 2024 Jul 8;54(3):8-59. Psychopharmacol Bull. 2024. PMID: 38993656 Free PMC article. Review.
-
A rapid and systematic review of the clinical effectiveness and cost-effectiveness of paclitaxel, docetaxel, gemcitabine and vinorelbine in non-small-cell lung cancer.Health Technol Assess. 2001;5(32):1-195. doi: 10.3310/hta5320. Health Technol Assess. 2001. PMID: 12065068
-
Segmented Look-Locker With Inversion Efficiency Correction (SELLIE) for Accurate and Precise Cardiac T1 Mapping in Rat Hearts at 9.4-T MRI.NMR Biomed. 2025 Aug;38(8):e70095. doi: 10.1002/nbm.70095. NMR Biomed. 2025. PMID: 40611595
-
Contrast-enhanced ultrasound using SonoVue® (sulphur hexafluoride microbubbles) compared with contrast-enhanced computed tomography and contrast-enhanced magnetic resonance imaging for the characterisation of focal liver lesions and detection of liver metastases: a systematic review and cost-effectiveness analysis.Health Technol Assess. 2013 Apr;17(16):1-243. doi: 10.3310/hta17160. Health Technol Assess. 2013. PMID: 23611316 Free PMC article.
Cited by
-
Preparation of Scalable Silica-Coated Iron Oxide Nanoparticles for Nanowarming.Adv Sci (Weinh). 2020 Jan 7;7(4):1901624. doi: 10.1002/advs.201901624. eCollection 2020 Feb. Adv Sci (Weinh). 2020. PMID: 32099753 Free PMC article.
-
Simultaneous quantitative susceptibility mapping (QSM) and R2* for high iron concentration quantification with 3D ultrashort echo time sequences: An echo dependence study.Magn Reson Med. 2018 Apr;79(4):2315-2322. doi: 10.1002/mrm.27062. Epub 2018 Jan 4. Magn Reson Med. 2018. PMID: 29314215 Free PMC article.
-
Analysis Protocols for MRI Mapping of Renal T1.Methods Mol Biol. 2021;2216:577-590. doi: 10.1007/978-1-0716-0978-1_35. Methods Mol Biol. 2021. PMID: 33476025 Free PMC article.
-
Capturing fast relaxing spins with SWIFT adiabatic rotating frame spin-lattice relaxation (T1ρ) mapping.NMR Biomed. 2016 Apr;29(4):420-30. doi: 10.1002/nbm.3474. Epub 2016 Jan 26. NMR Biomed. 2016. PMID: 26811973 Free PMC article.
-
Ex vivo imaging of subacute myocardial infarction with ultra-short echo time 3D quantitative T1- and T1ρ -mapping magnetic resonance imaging in mice.Eur Heart J Imaging Methods Pract. 2024 Dec 30;3(1):qyae131. doi: 10.1093/ehjimp/qyae131. eCollection 2025 Jan. Eur Heart J Imaging Methods Pract. 2024. PMID: 39811012 Free PMC article.
References
-
- Corot C, Robert P, Idee JM, Port M. Recent advances in iron oxide nanocrystal technology for medical imaging. Adv Drug Deliver Rev. 2006;58:1471–1504. - PubMed
-
- Kuhlpeter R, Dahnke H, Matuszewski L, Persigehl T, von Wallbrunn A, Allkemper T, Heindel WL, Schaeffter T, Bremer C. R2 and R2*mapping for sensing cell-bound superparamagnetic nanoparticles: In vitro and murine in vivo testing. Radiology. 2007;245:449–457. - PubMed
-
- Bergin CJ, Pauly JM, Macovski A. Lung Parenchyma - Projection Reconstruction MR Imaging. Radiology. 1991;179:777–781. - PubMed
-
- Robson MD, Gatehouse PD, Bydder M, Bydder GM. Magnetic resonance: an introduction to ultrashort TE (UTE) imaging. J Comput Assist Tomo. 2003;27:825–846. - PubMed
Publication types
MeSH terms
Substances
Grants and funding
LinkOut - more resources
Full Text Sources
Other Literature Sources
Medical
