. 2014 Jun;85(6):556-65.
doi: 10.1002/cyto.a.22463. Epub 2014 Mar 24.

Optimized flow cytometry isolation of murine spermatocytes

Affiliations

Optimized flow cytometry isolation of murine spermatocytes

Valeriya Gaysinskaya et al. Cytometry A. 2014 Jun.

Abstract

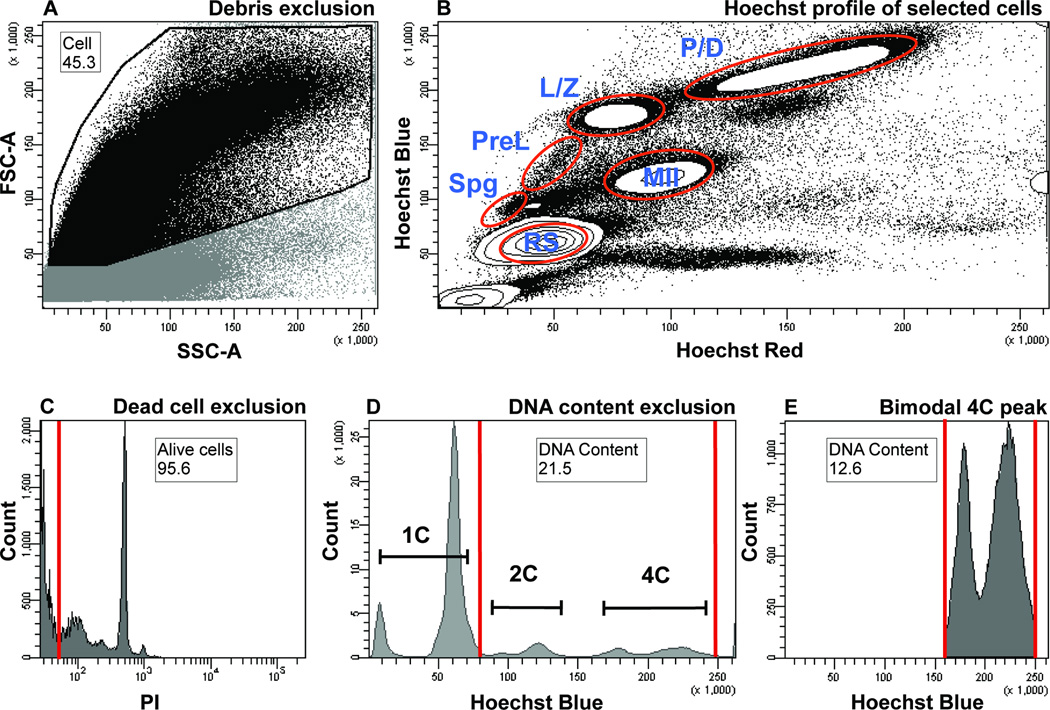
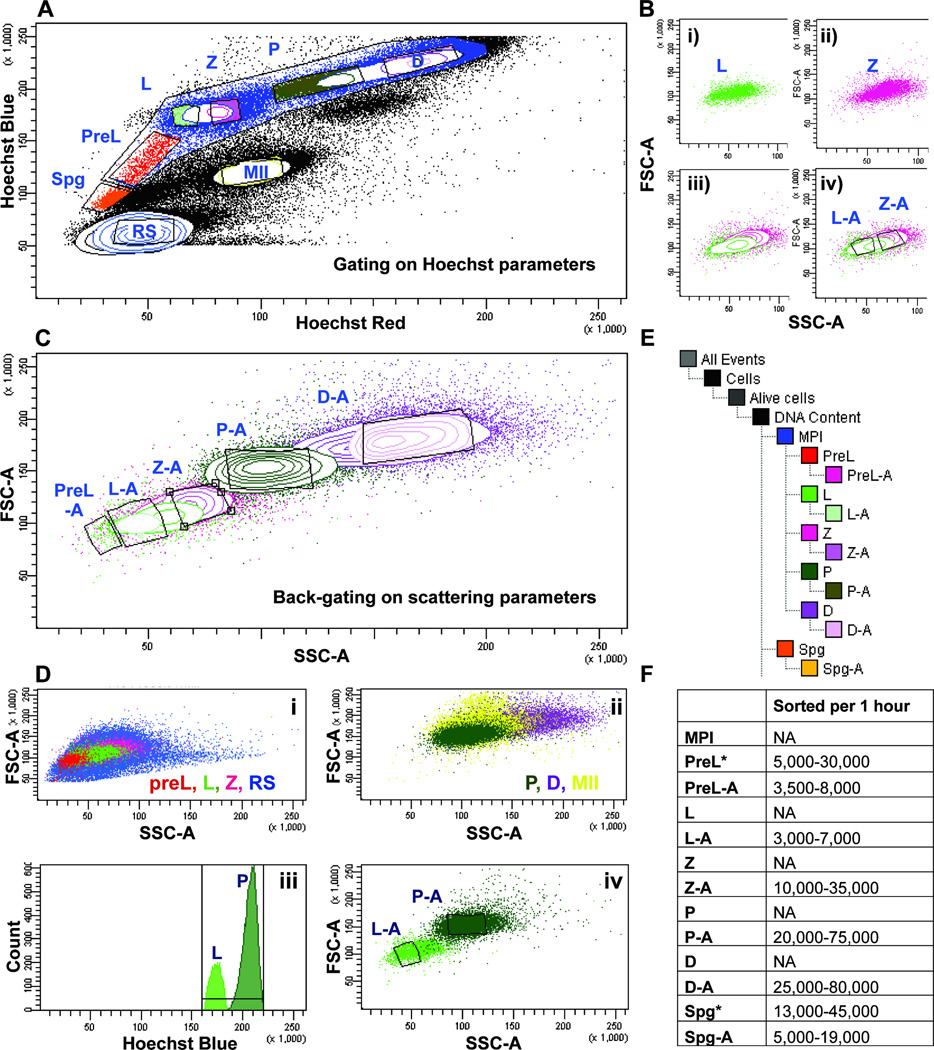
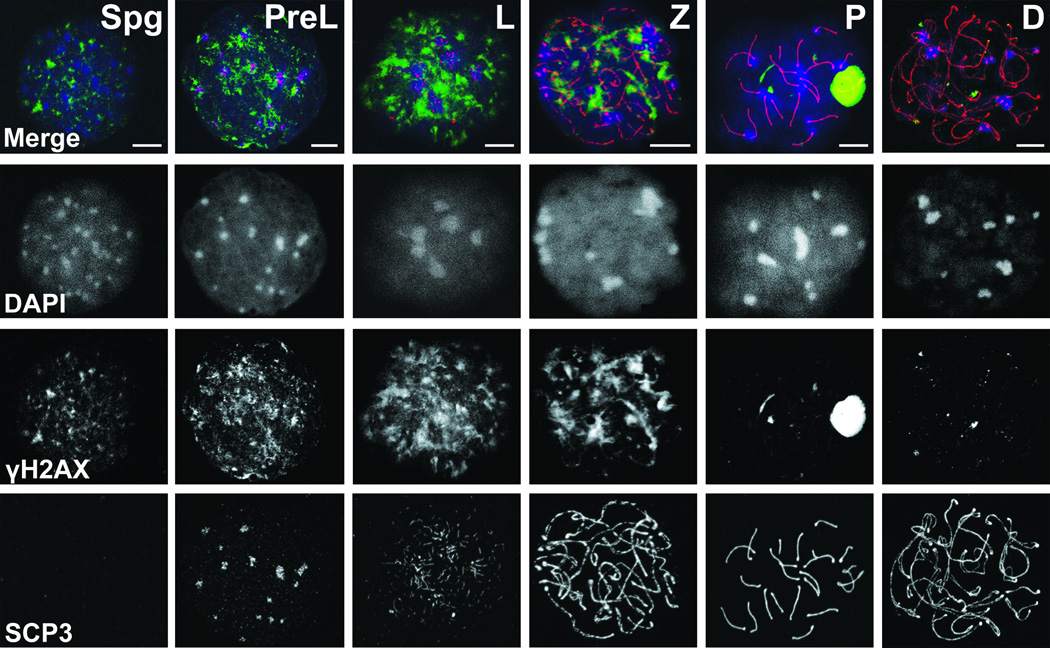
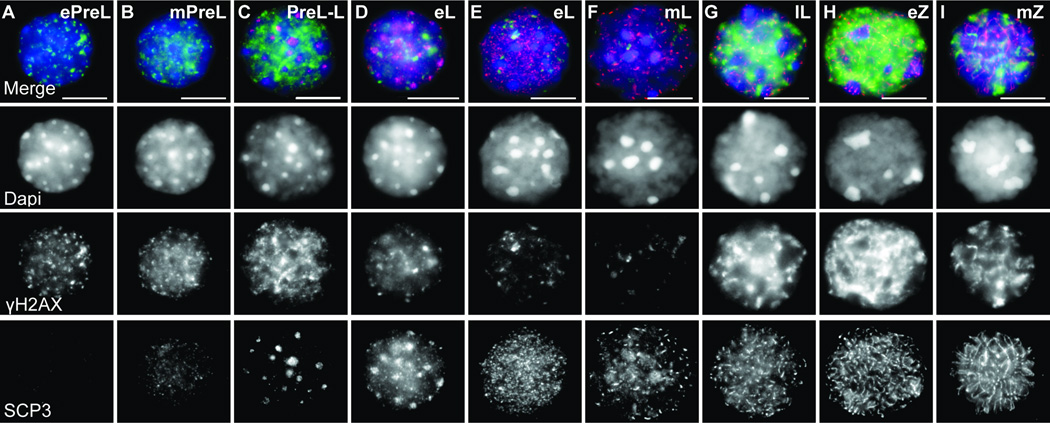
Meiotic prophase I (MPI), is an initial stage of meiosis characterized by intricate homologous chromosome interactions, synapsis, and DNA recombination. These processes depend on the complex, but poorly understood early MPI events of homologous chromosome search, alignment, and pairing. Detailed molecular investigation of these early events requires isolation of individual MPI substages. Enrichment for Pachytene (P) and Diplotene (D) substages of late MPI was previously accomplished using flow cytometry. However, separation of early MPI spermatocytes, specifically, of Leptotene (L) and Zygotene (Z) substages, has been a challenge due to these cells' similar characteristics. In this report, we describe an optimized Hoechst-33342 (Hoechst)-based flow cytometry approach for isolating individual MPI populations from adult mouse testis. We get significant enrichment for individual L and Z spermatocytes, previously inseparable from each other, and optimize the isolation of other MPI substages. Our flow cytometry approach is a combination of three optimized strategies. The first is optimization of testis dissociation protocol that yields more consistent and reproducible testicular single cell suspension. The second involves optimization of flow cytometric gating protocol where a critical addition to the standard protocol for cell discrimination based on Hoechst fluorescence, involves a back-gating technique based on light scattering parameters. This step specifies selection of individual MPI substages. The third, is an addition of DNA content restriction to the gating protocol to minimize contamination from non-meiotic cells. Finally, we confirm significant enrichment of high-purity Preleptotene (PreL), L, Z, P, and D MPI spermatocytes using stage-specific marker distribution. The technique will facilitate understanding of the molecular events underlying MPI.

Keywords: Hoechst 33342; adult mouse testis; cell sorting; flow cytometry; meiotic prophase I.


Conflict of interest statement

The authors declare no conflict of interest.

Figures

Figure 1
Figure 1
Flow cytometric analysis of adult murine testicular cells based on Hoechst and PI fluorescence and light scattering parameters. Numbers on plots represent percent of parent population, the latter identified within a figure legend below. Gate name is found above the number. Both, the number and the gate name are encased by black box. A) Debris exclusion based on low light scattering parameters. Cells are distinguished from debris based on the FSC and SSC, proportional to the cell size and cell granularity, respectively. A dot plot shows debris exclusion gate (“Cell” gate, black outline) that includes the cells (black dots) and excludes the debris (grey dots), which exhibit low FSC intensity. The excluded region also contains some elongated spermatozoa, whose small size is a major contributor to the low FSC signal. The parent of the “Cell” gate includes all the cells. B) Hoechst profile of testicular cells. Cells selected in Figure 2A are visualized in a “Hoechst Blue”/“Hoechst Red” contour plot, in which the density of the cells is displayed as contour lines that form circular contours upon high cell density. The main subpopulations visualized are contained within the white densities outlined in red. Spg, spermatogonia; PreL, preleptotene spermatocytes; L/Z, leptotene/zygotene spermatocytes; P/D, pachytene/diplotene spermatocytes; MII, meiosis II spermatocytes; RS, round spermatids. C) Dead cell exclusion based on PI fluorescence. Alive, PI-negative cells are found within an “Alive cells” gate to the left of the red line and include over 94% of all cells (most are pushed off the x-axis). Cells positive for PI (to the right of the red gate) are excluded from the analysis. The parent of the “Alive cells” gate is the “Cell” gate from Figures 1A and 1B. D) DNA content exclusion based on “Hoechst Blue” fluorescence. Populations that fall within the red gate called “DNA Content” are included in the analysis (2C and 4C DNA contents are labeled). Haploid cells with 1C DNA content are outside of the gate and are excluded from the analysis. The parent of the “DNA Content” gate is the “Alive cells” gate from figure 1C. In this example, the “DNA Content” gate represents 43.3 percent of all cells. E) Bimodal distribution of cells with 4C DNA content shows L/Z and P/D populations. The left and right peaks encompassed by the red gate (a restricted “DNA Content” gate) correspond to L/Z and P/D populations, respectively. The parent of the “DNA Content” gate is the “Alive cells” gate from figure 1C. In this example, the restricted “DNA Content” gate represents 5.4 percent of all cells.
Figure 2
Figure 2
Gating and back-gating strategies for isolating individual MPI populations. A) Gating on individual spermatogenic populations based on Hoechst fluorescence. A large meiotic gate encompasses smaller gates containing cells of individual MPI substages, including preleptotene- (PreL, red), leptotene- (L, green), zygotene- (Z, pink), pachytene- (P, dark green) and diplotene- (D, magenta) spermatocytes. Gates enriched in pre-meiotic spermatogonia (Spg, orange), round spermatids (rSP, blue) and meiosis II spermatocytes (MII, yellow) are also outlined. B) Back-gating approach. A particular gate on the Hoechst fluorescence plot (Figure 3A) can be viewed on the FSC vs. SSC plot. Here, L spermatocytes (panel i) and Z spermatocytes (panel ii) defined by a fluorescence gate in Figure 3A, display particular characteristics on the “FSC”/“SSC” plot (green and pink dots, respectively). iii) When viewed on the same plot, L and Z share similar light scattering parameters and partly overlap. iv) Based on regions of minimal overlap on the “FSC”/“SSC” plot, “L-A” gate is created to restrict contamination from the Z gate, and “Z-A” gate is made to restrict contamination from the L gate. C) Back-gating approach applied to all MPI substages. Individual spermatogenic populations defined by gates on Hoechst fluorescence plot (“Hoechst Blue”/“Hoechst Red”, Figure 3A) are used to set gates on the light scattering plot (“FSC”/“SSC”). A gate set on “FSC”/“SSC” plot and appended with “-A” (e.g., P-A) marks a “back-gate” of a gate (e.g. “P”) set on the “Hoechst Blue”/“Hoechst Red” plot. D) DNA content-restricting gate helps eliminate contamination from non-MPI cell types. The light scattering profile of MPI spermatocytes overlaps with that of other spermatogenic cells in the testis. (i) Abundant and morphologically diverse haploid rSP cells (blue) overlap with PreL, L and Z cells. (ii) MII spermatocytes (yellow) overlap with P and D cells. (iii) A gate specifying DNA content on “Hoechst Blue” histogram can be restricted to include only the 4C content where L and P cells are found, and to exclude haploid and diploid cells that fall outside of this gate. Thus, for example, a two-way sort for L and P involves exclusion based on “Hoechst Blue” parameters and on (iv) specification of back-gates “L-A” (light green, outlined subset) and “P-A” (dark green, outlined subset). E) Gating tree. The tree indicates the sequential gating and back-gating procedure applied to Hoechst-labeled testicular single cell suspension before sorting. Gates that have “-A” appended to them were the final sorting gates, such that sorting of L spermatocytes involved collecting cells from the “L-A” gate. F) The range of numbers of cells collected from ten different sorts. The wide range largely reflects the difference in the ages of mice used (2–5 months old) and the adjustment, from experiment to experiment, in the size of gates and back-gates set. Populations that can be sorted without back-gating are indicated by “*”.
Figure 3
Figure 3
Immunofluorescence analysis of MPI progression. Spread nuclei were double labeled with γH2AX (green) and SYCP3 (red) and counterstained with DAPI (blue). Staging was deduced from changing, stage-specific labeling patterns of these markers. Fluorescence images generated by confocal microscopy show representative MPI substages including the preleptotene- (PreL), leptotene- (L), zygotene- (Z), pachytene- (P), diplotene- (D) spermatocytes, and an example of pre-meiotic Spermatogonia (Spg). Bar - 10 µm.
Figure 4
Figure 4
Detailed immunofluorescence characterization of early MPI sorted cells. Images show examples of sorted PreL- (A–C, preleptotene), L- (D–G, leptotene) and Z- (H–I, zygotene) spermatocytes. Staging was deduced from DAPI, SYCP3 and γH2AX patterns. Early to mid PreL cells exhibit numerous peripheral DAPI chromocenters corresponding to satellite DNA (A–C). (A) Early PreL (ePreL) nucleus shows punctate γH2AX foci and absence of SYCP3, (B) mid PreL (mPreL) nucleus showing foci and patches of γH2AX and weak and diffuse SCP3 staining and (C) a nucleus with late PreL and L characteristics (PreL-L) exhibits numerous SYCP3 aggregates and a decrease in DAPI foci along the rim of the nuclear periphery. PreL-L cells often exhibit intense γH2AX signal. (D–G) From early L (eL) to late L (lL) nuclei exhibit a progression from short to longer stretches of SYCP3 and from sparse foci to large intense and partly homogenous γH2AX. At least two types of eL cells can be observed, one PreL-like (D) but with lower γH2AX signal, and a more typical one (E). (H,I) In early Z (eZ), long, interrupted SYCP3 fibers are observed throughout the cell. Polarized concentration of thickening SYCP3 fiber ends marks telomere bouquet base. Mid Z (mZ) exhibits long and thin SYCP3 stretches. By late Z, chromosome axes are fully formed and appear as long thing fibers, and levels of γH2AX decrease. Bar - 10 µm.

Comment in

  • Sorting out meiosis.
    Stuart D. Stuart D. Cytometry A. 2014 Jun;85(6):474-6. doi: 10.1002/cyto.a.22468. Epub 2014 Mar 24. Cytometry A. 2014. PMID: 24664871 No abstract available.
  • Revisiting testicular cell suspensions and meiocytes sorting.
    Geisinger A, Rodríguez-Casuriaga R, Santiñaque FF, Folle GA. Geisinger A, et al. Cytometry A. 2014 Dec;85(12):989-90. doi: 10.1002/cyto.a.22525. Epub 2014 Oct 31. Cytometry A. 2014. PMID: 25363876 No abstract available.

References

    1. Lassalle B, Bastos H, Louis JP, Riou L, Testart J, Dutrillaux B, Fouchet P, Allemand I. 'Side Population' cells in adult mouse testis express Bcrp1 gene and are enriched in spermatogonia and germinal stem cells. Development. 2004;131:479–487. - PubMed
    1. Bastos H, Lassalle B, Chicheportiche A, Riou L, Testart J, Allemand I, Fouchet P. Flow cytometric characterization of viable meiotic and postmeiotic cells by Hoechst 33342 in mouse spermatogenesis. Cytometry A. 2005;65:40–49. - PubMed
    1. Barroca V, Lassalle B, Coureuil M, Louis JP, Le Page F, Testart J, Allemand I, Riou L, Fouchet P. Mouse differentiating spermatogonia can generate germinal stem cells in vivo. Nat Cell Biol. 2009;11:190–196. - PubMed
    1. Getun IV, Wu ZK, Khalil AM, Bois PR. Nucleosome occupancy landscape and dynamics at mouse recombination hotspots. EMBO Rep. 2010;11:555–560. - PMC - PubMed
    1. Getun IV, Torres B, Bois PR. Flow cytometry purification of mouse meiotic cells. J Vis Exp. 2011 - PMC - PubMed

Publication types