

Parametric transfer function analysis and modeling of blood flow autoregulation in the optic nerve head
- PMID: 24665355
- PMCID: PMC3961098
Parametric transfer function analysis and modeling of blood flow autoregulation in the optic nerve head
Abstract
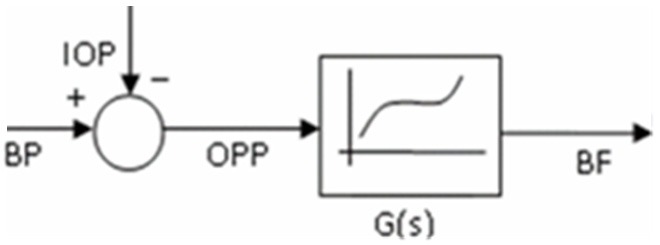
The aim of the study was to establish a parametric transfer function to describe the relationship between ocular perfusion pressure (OPP) and blood flow (BF) in the optic nerve head (ONH). A third-order parametric theoretical model was proposed to describe the ONH OPP-BF relationship within the lower OPP range of the autoregulation curve (< 80 mmHg) based on experimentally induced BF response to a rapid intraocular pressure (IOP) increase in 6 rhesus monkeys. The theoretical and actual data fitted well and suggest that this parametric third-order transfer function can effectively describe both the linear and nonlinear feature in dynamic and static autoregulation in the ONH within the OPP range studied. It shows that the BF autoregulation fully functions when the OPP was > 40 mmHg and becomes incomplete when the OPP was < 40 mmHg. This model may be used to help investigating the features of autoregulation in the ONH under different experimental conditions.
Keywords: Optic nerve head; autoregulation; intraocular pressure; transfer function.
Figures


Similar articles
-
Static blood flow autoregulation in the optic nerve head in normal and experimental glaucoma.Invest Ophthalmol Vis Sci. 2014 Feb 10;55(2):873-80. doi: 10.1167/iovs.13-13716. Invest Ophthalmol Vis Sci. 2014. PMID: 24436190 Free PMC article.
-
Quantification of dynamic blood flow autoregulation in optic nerve head of rhesus monkeys.Exp Eye Res. 2010 Feb;90(2):203-9. doi: 10.1016/j.exer.2009.10.009. Epub 2009 Oct 22. Exp Eye Res. 2010. PMID: 19853603
-
Role of nitric oxide in optic nerve head blood flow regulation during an experimental increase in intraocular pressure in healthy humans.Exp Eye Res. 2013 Nov;116:247-53. doi: 10.1016/j.exer.2013.09.008. Epub 2013 Sep 20. Exp Eye Res. 2013. PMID: 24060346 Clinical Trial.
-
[In vivo measurement of ocular circulation with the laser speckle method--development of apparatus and application in ophthalmological research].Nippon Ganka Gakkai Zasshi. 1999 Dec;103(12):871-909. Nippon Ganka Gakkai Zasshi. 1999. PMID: 10643292 Review. Japanese.
-
A novel noninvasive videographic method for quantifying changes in the chromaticity of the optic nerve head with changes in the intraocular pressure, pulsatile choroidal blood flow and visual neural function in humans.Surv Ophthalmol. 1994 May;38 Suppl:S35-51. doi: 10.1016/0039-6257(94)90045-0. Surv Ophthalmol. 1994. PMID: 7940147 Review.
Cited by
-
Impact of Elevated Intraocular Pressure on Lamina Cribrosa Oxygenation: A Combined Experimental-Computational Study on Monkeys.Ophthalmol Sci. 2025 Jan 31;5(3):100725. doi: 10.1016/j.xops.2025.100725. eCollection 2025 May-Jun. Ophthalmol Sci. 2025. PMID: 40161464 Free PMC article.
-
Impact of elevated IOP on lamina cribrosa oxygenation; A combined experimental-computational study on monkeys.bioRxiv [Preprint]. 2024 Sep 10:2024.09.05.609208. doi: 10.1101/2024.09.05.609208. bioRxiv. 2024. Update in: Ophthalmol Sci. 2025 Jan 31;5(3):100725. doi: 10.1016/j.xops.2025.100725. PMID: 39314421 Free PMC article. Updated. Preprint.
-
Impact of anatomic variability and other vascular factors on lamina cribrosa hypoxia.bioRxiv [Preprint]. 2024 Sep 13:2024.09.12.610282. doi: 10.1101/2024.09.12.610282. bioRxiv. 2024. PMID: 39314360 Free PMC article. Preprint.
-
The Robust Lamina Cribrosa Vasculature: Perfusion and Oxygenation Under Elevated Intraocular Pressure.Invest Ophthalmol Vis Sci. 2024 May 1;65(5):1. doi: 10.1167/iovs.65.5.1. Invest Ophthalmol Vis Sci. 2024. PMID: 38691092 Free PMC article.
References
-
- Bill A, Sperber GO. Aspects of oxygen and glucose consumption in the retina: effects of high intraocular pressure and light. Graefes Arch Clin Exp Ophthalmol. 1990;228:124–127. - PubMed
-
- Anderson DR. Introductory comments on blood flow autoregulation in the optic nerve head and vascular risk factors in glaucoma. Surv Ophthalmol. 1999;43(Suppl 1):S5–9. - PubMed
-
- Harris A, Kagemann L, Cioffi GA. Assessment of human ocular hemodynamics. Surv Ophthalmol. 1998;42:509–533. - PubMed
Grants and funding
LinkOut - more resources
Full Text Sources
Miscellaneous