. 2014 Jun;44(6):867-81.
doi: 10.1111/cea.12312.

The regulatory T cells induction by epicutaneous immunotherapy is sustained and mediates long-term protection from eosinophilic disorders in peanut-sensitized mice

Affiliations

The regulatory T cells induction by epicutaneous immunotherapy is sustained and mediates long-term protection from eosinophilic disorders in peanut-sensitized mice

V Dioszeghy et al. Clin Exp Allergy. 2014 Jun.

Abstract

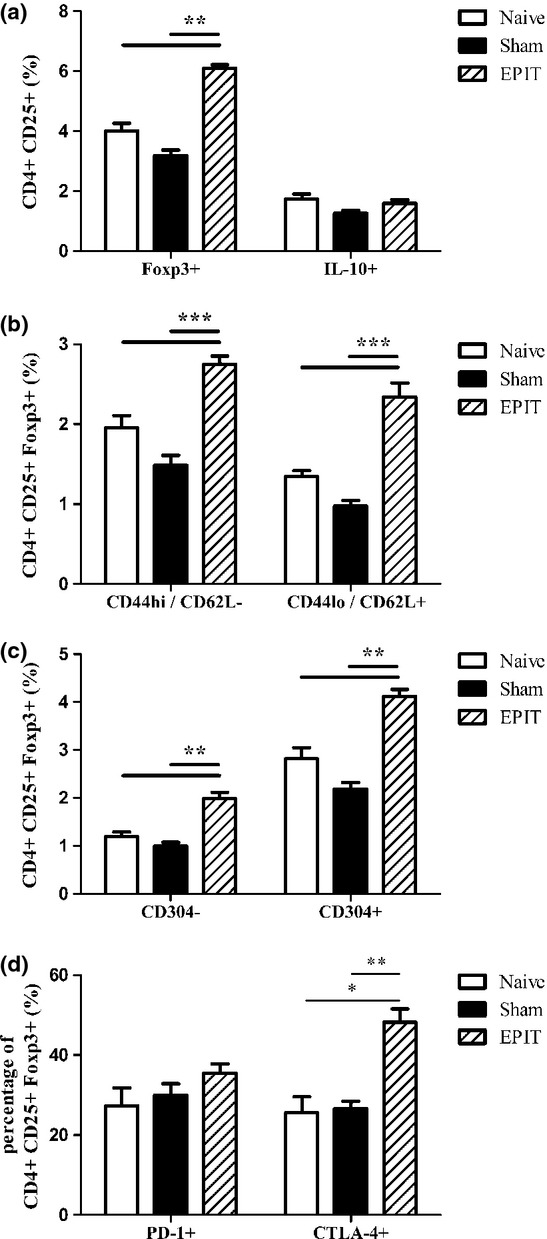
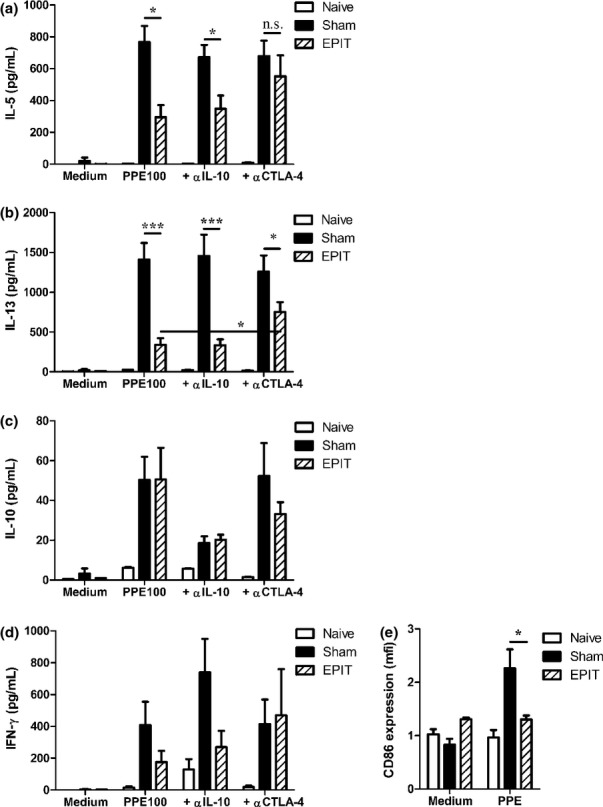
Background: Allergen-specific immunotherapy favours immune deviation from a Th2 to a Th1 response and increases the number of regulatory T cells (Tregs). Epicutaneous immunotherapy (EPIT) of sensitized mice decreases the clinical and the allergen-specific Th2 responses and increases local and peripheral Foxp3(+) Tregs.

Objective: To investigate the role of Tregs in EPIT and characterize their phenotype and maintenance following EPIT.

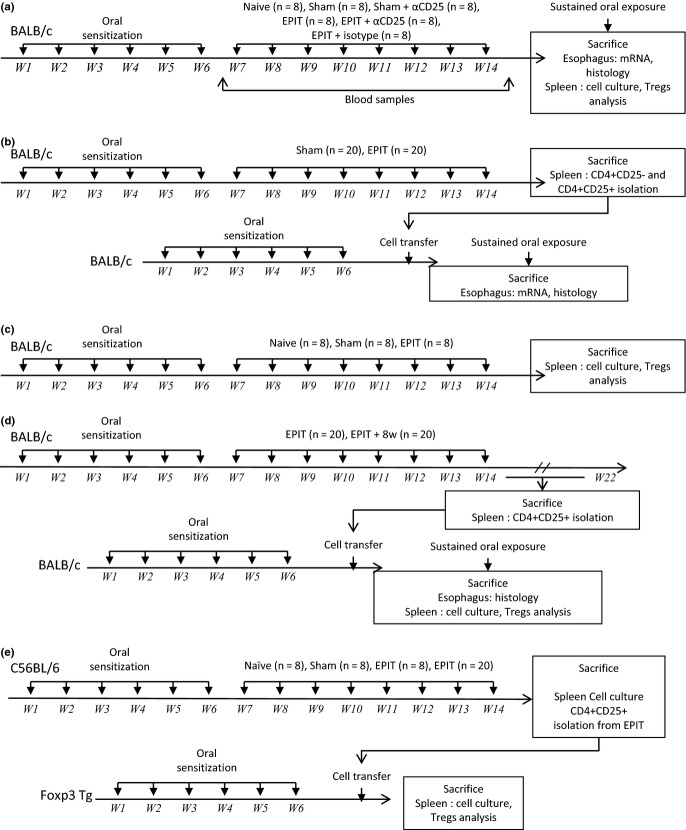
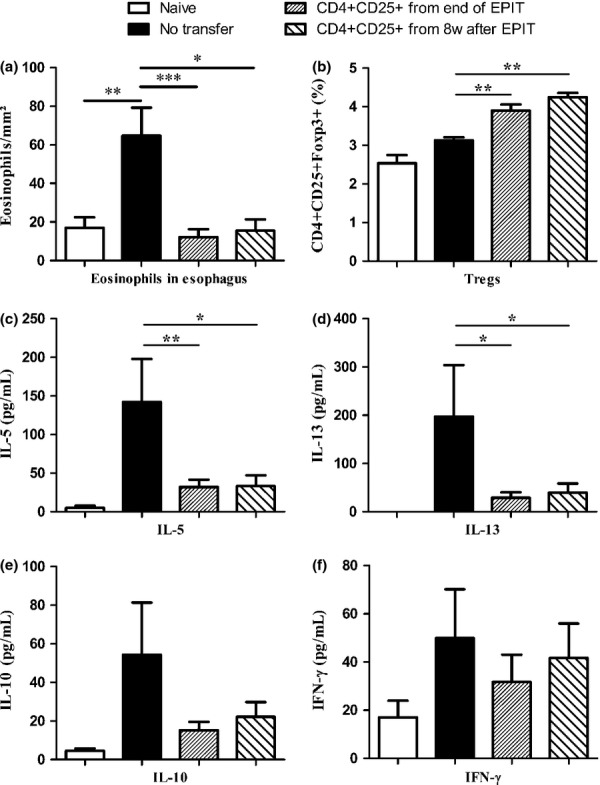
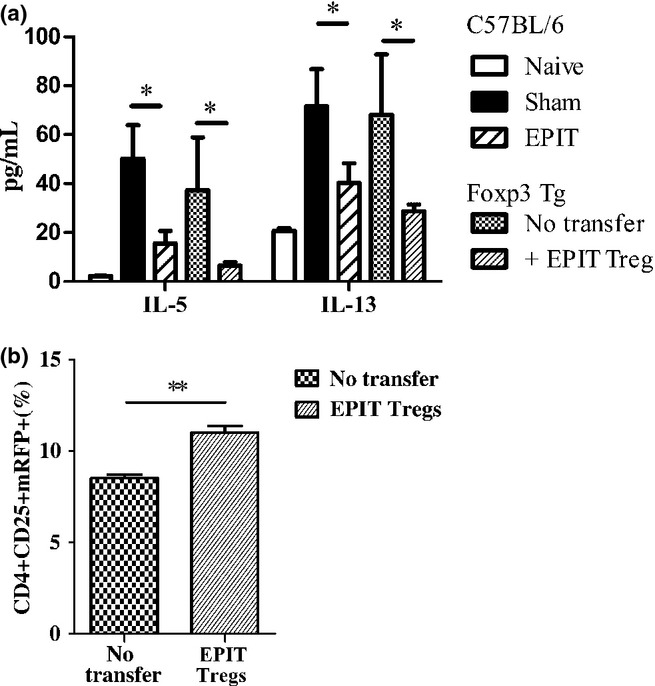
Methods: Tregs were investigated using in vivo depletion or adoptive transfer into BALB/c mice. Tregs were depleted using anti-CD25 antibody injection during EPIT, and allergen-specific responses were compared with Sham, EPIT alone and naïve mice. To demonstrate that Tregs can mediate protection by their own, and to study their maintenance following the end of EPIT, CD25(+) CD4(+) Tregs isolated from mice just after or 8 weeks after EPIT were transferred into peanut-sensitized mice. Foxp3-IRES-mRFP mice were transferred with EPIT-induced Tregs to analyse the induction of host Tregs.

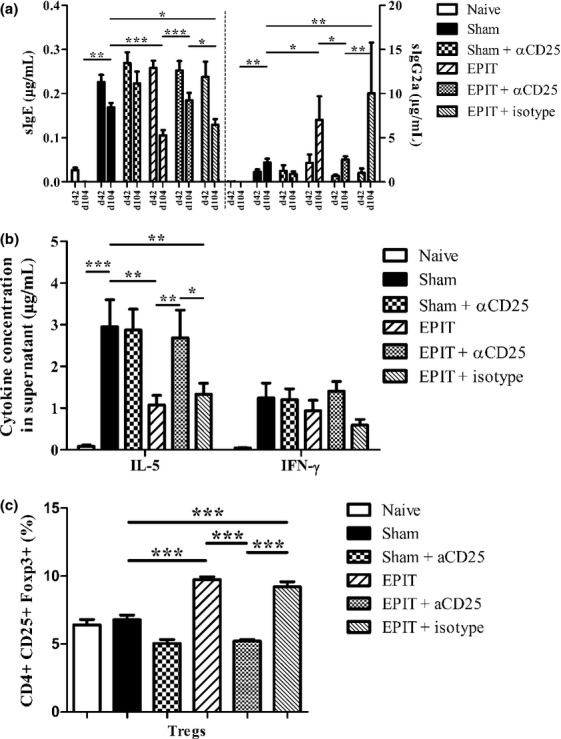
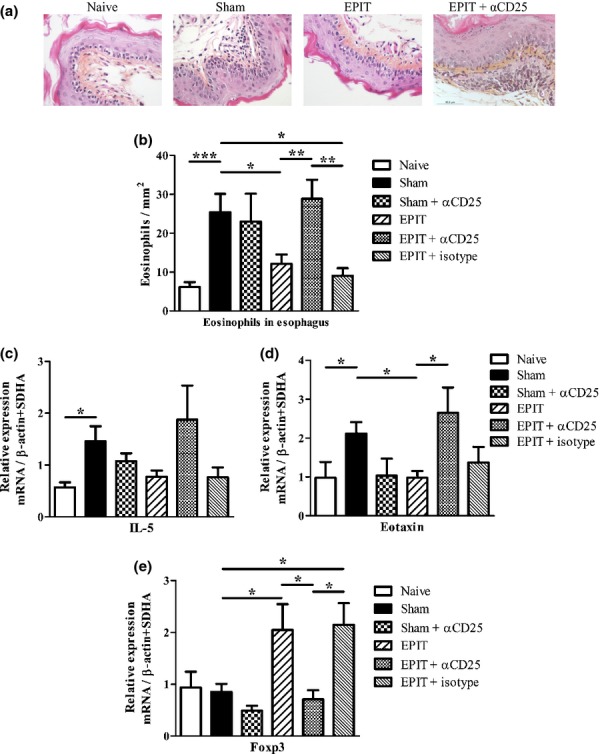
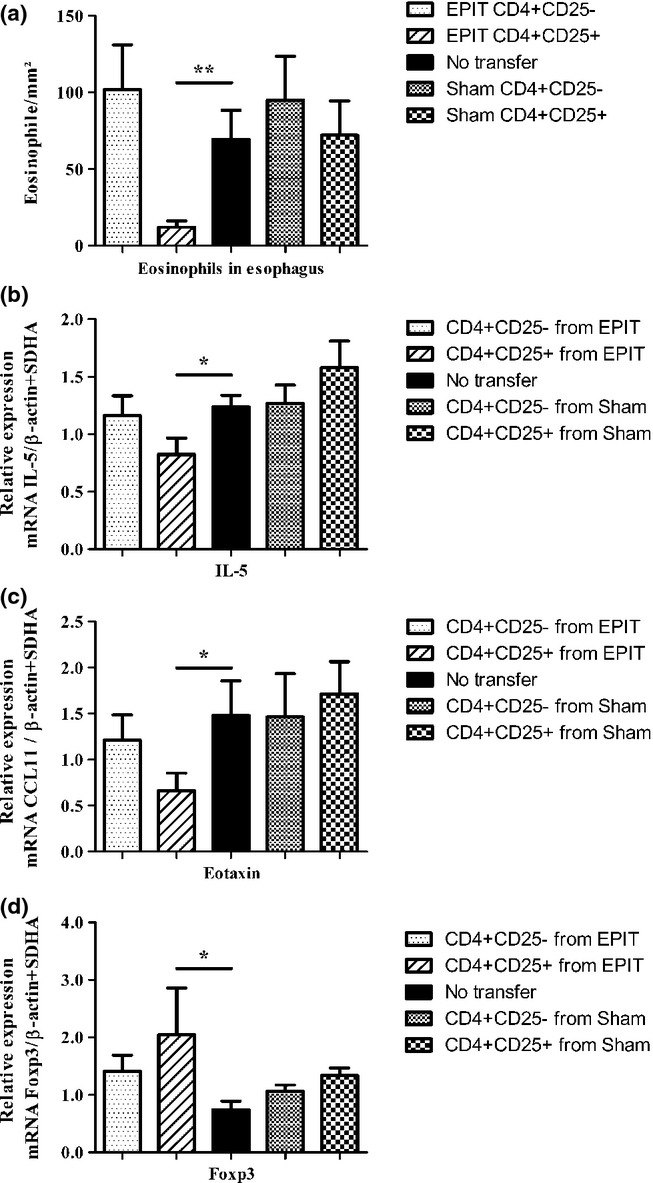
Results: The anti-CD25 antibody injection to EPIT mice abrogated the induction of Tregs in spleen and the expression of Foxp3 in oesophagus. This resulted in levels of peanut-induced eosinophilic infiltration in oesophagus similar to Sham and significantly higher than EPIT. Whereas the transfer of Tregs from Sham-treated mice demonstrated no effect, the transfer of Tregs isolated just after EPIT prevented peanut-induced eosinophil infiltration and eotaxin expression and induced Foxp3 in oesophagus. The transfer of Tregs isolated 8 weeks after EPIT suppressed allergen-specific responses as efficiently as did Tregs isolated just after EPIT and increased spleen Foxp3(+) CD25(+) CD4(+) cells similarly. The use of reporter mice demonstrated an increase in host Tregs.

Conclusions: These results confirm the Tregs-mediated mechanism of EPIT and demonstrate the persistence of efficient Tregs during a long period of time after treatment cessation. This suggests that EPIT induces long-term tolerance in peanut-sensitized mice.

Keywords: epicutaneous immunotherapy; peanut allergy; regulatory T cells.


Figures

Figure 1
Figure 1
Study design of experiments. (a) BALB/c mice were sensitized to peanut proteins. Then, mice were treated by active EPIT, EPIT + αCD25, EPIT + isotype control antibody, αCD25 alone (Sham + αCD25) or placebo (Sham) during 8 weeks. Naïve mice remained unsensitized and untreated. Following treatment, animals were submitted to a 10-day sustained oral exposure to peanuts. The day after the last challenge, mice were killed for organ recovery. (b) BALB/c mice were sensitized and treated as described above (donor mice). After 8 weeks of treatment, donor mice were killed, and the CD4+CD25+ or CD4+CD25 T cells were sorted from spleen cells of each group and transferred into peanut-sensitized non-treated mice. Three days after the transfer, mice were submitted to a 10-day sustained oral exposure to peanuts using the same protocol. (c) BALB/c mice were sensitized and treated as described above (EPIT, Sham, naïve). After treatment, the PPE-specific cytokine response of splenocytes in the presence of blocking antibodies and the Tregs phenotype in spleen were analysed. (d) BALB/c mice were sensitized and treated as described above (donor mice: EPIT n = 40). After treatment (n = 20) or 8 weeks after the end of treatment (n = 20), donor mice were killed, and the CD4+CD25+ T cells were sorted from spleen cells and transferred into peanut-sensitized non-treated mice. Three days after the transfer, mice were submitted to a 10-day sustained oral exposure to peanuts using the same protocol. (e) C57BL/6 mice were sensitized and treated as described above (donor mice: EPIT n = 20). After 8 weeks of treatment, donor mice were killed, and the CD4+CD25+ T cells were sorted from spleen cells and transferred into peanut-sensitized non-treated Foxp3-IRES-mRFP mice (n = 8). Two weeks after the transfer, the PPE-specific cytokine response of splenocytes and expression of mRFP were compared to that of non-transferred mice (n = 8). EPIT or Sham-treated C57BL/6 mice, as well as naïve mice, were used as a control of EPIT efficacy in WT mice.
Figure 2
Figure 2
EPIT-induced desensitization was blocked by anti-CD25 antibodies. (a) Quantity of peanut-specific IgE (left panel) and IgG2a for each group after sensitization, before EPIT (d42) and after the treatment period (d104). (b) Measurement of IL-5 and IFN-γ secretion by splenocytes collected from each group of mice immediately after killing. Splenocytes were stimulated with peanut for 72 h. Cytokines were measured using Bioplex. (c) Proportion of Tregs in the spleen of mice from each group. Sham: peanut-sensitized untreated mice; EPIT: peanut-sensitized mice treated by EPIT; EPIT + αCD25: peanut-sensitized mice treated by EPIT and anti-CD25 antibody. Data are shown as means ± SEM of three independent experiments for each group of mice (n = 8 in each group). *P < 0.05, **P < 0.01, ***P < 0.001.
Figure 3
Figure 3
EPIT modulated oesophagus immunity in mice orally exposed to peanut. (a) Mice were exposed to oral peanut for 10 days, and oesophagi were harvested. Formalin-fixed, paraffin-embedded tissue sections were stained with haematoxylin–eosin–safranine. Representative histology picture of oesophagus for naïve, Sham, EPIT and EPIT + αCD25 mice are shown. (b) Measurements of eosinophils infiltration in oesophagus were realized by double-blind reading at a 40-high-powered field. Results are expressed as mean number of eosinophils per mm± SEM for each group of mice. (c–e) mRNAs were quantified by real-time PCR in oesophagus segments collected 24 h after the end of oral challenge. Results are presented as mean mRNA expression ± SEM of three independent experiments for each group of mice. The relative levels of IL-5 (c), eotaxin (d) and Foxp3 (e) expression were calculated by reference to the SDHA and the β-actin in each sample. Sham: peanut-sensitized untreated mice; EPIT: peanut-sensitized mice treated by EPIT; EPIT + αCD25: peanut-sensitized mice treated by EPIT and anti-CD25 antibody. *P < 0.05, **P < 0.01.
Figure 4
Figure 4
Modulation of the oesophagus immunity by cell transfer into mice orally exposed to peanut. (a) Mice were sensitized and transferred with either CD4+CD25+ or CD4+CD25 T cells from either EPIT- or Sham-treated mice and were compared with non-transferred sensitized mice. Three days after transfer, mice were exposed to oral peanut for 10 days and oesophagi were harvested. Formalin-fixed, paraffin-embedded tissue sections were stained with haematoxylin–eosin–safranine, and measurements of eosinophils infiltration in oesophagus were realized by double-blind reading at a 40-high-powered field. Results are expressed as mean number of eosinophils per mm± SEM for each group of mice (n = 8 in each group). (b–d) mRNAs were quantified by real-time PCR in oesophagus segments collected 24 h after the end of oral challenge. Results are demonstrated as mean mRNA expression ± SEM of two independent experiments for each group of mice. The relative levels of IL-5 (b), eotaxin (c) and Foxp3 (d) expression were calculated by reference to the SDHA and the β-actin in each sample. *P < 0.05, **P < 0.01.
Figure 5
Figure 5
Phenotypic characterization of Tregs. Sensitized mice were EPIT- or Sham-treated for 8 weeks. At the end of treatment, spleen cells were harvested for flow cytometry analysis. (a and b) Cells were gated on CD4+ among the lymphocyte identified by FSC/SSC, the percentages of CD25+Foxp3+ or CD25+IL10+ (a), and percentages of CD25+Foxp3+CD44hiCD62L or CD25+Foxp3+CD44loCD62L+ (b), and of CD25+Foxp3+CD304+ or CD25+Foxp3+CD304 (c) were analysed. (d) Among the lymphocyte identified by FSC/SSC, cells were gated on CD4+CD25+Foxp3+, and the percentage of cells expressing CTLA-4 and PD-1 was analysed. Data are shown as means ± SEM of three independent experiments for each group of mice (n = 8 in each group). *P < 0.05, **P < 0.01, ***P < 0.001
Figure 6
Figure 6
Mechanism of allergen-specific suppression by EPIT. Sensitized mice were EPIT- or Sham-treated for 8 weeks. At the end of the treatment, spleen cells were harvested and stimulated with peanut in the presence or absence of anti-IL-10 or anti-CTLA-4 blocking antibodies for 72 h. IL-5 (a), IL-13 (b), IL-10 (c) and IFN-γ (d) in supernatant were measured using Bioplex. (e) Cells were collected after culture and stained with anti-CD11c and CD86 antibody for flow cytometry analysis. mfi: mean intensity of fluorescence. Data are shown as means ± SEM of two independent experiments for each group of mice (n = 8 in each group). *P < 0.05, ***P < 0.001
Figure 7
Figure 7
Long-term maintenance of Tregs after discontinuation of EPIT. Mice were sensitized and transferred with CD4+CD25+ T cells isolated just after or 8 weeks after the end of EPIT and were compared with non-transferred sensitized mice. Mice were exposed to oral peanut for 10 days, and oesophagi were harvested. (a) Formalin-fixed, paraffin-embedded tissue sections were stained with haematoxylin–eosin–safranine, and measurement of eosinophils infiltration in oesophagus was realized by double-blind reading at a 40-high-powered field. Results are expressed as mean number of eosinophils per mm± SEM for each group of mice. (b) Proportions of Tregs were analysed in the spleen of naïve mice (white bar), peanut-sensitized non-transferred mice, peanut-sensitized mice transferred with CD4+CD25+ T cells isolated just after the end of EPIT and peanut-sensitized mice transferred with CD4+CD25+ T cells isolated 8 weeks after the end of EPIT. (c–f) Splenocytes were stimulated with peanut for 72 h. Concentrations of IL-5 (c), IL-13 (d), IL-10 (e) and IFN-γ (f) were measured in supernatants using Bioplex. Data are shown as means ± SEM of three independent experiments for each group of mice (n = 8 in each group). *P < 0.05, **P < 0.01, ***P < 0.001.
Figure 8
Figure 8
Transfer of EPIT-induced Tregs increase host Tregs. C57BL/6 mice were sensitized and treated by EPIT (n = 20). After 8 weeks of treatment, donor mice were killed, and the CD4+CD25+ T cells were sorted from spleen cells and transferred into peanut-sensitized non-treated Foxp3-IRES-mRFP mice (n = 8). Two weeks after transfer, the PPE-specific cytokine response of splenocytes and expression of mRFP were compared to that of non-transferred mice (n = 8). EPIT- or Sham-treated C57BL/6 mice as well as naïve mice were used as control of EPIT efficacy in C57BL/6 WT mice. (a) Splenocytes were stimulated with peanut for 72 h. IL-5 and IL-13 concentrations were measured in supernatants using Bioplex. (b) The proportions of CD4+CD25+mRFP+ Tregs were analysed in spleen of peanut-sensitized non-transferred Foxp3-IRES-mRFP mice and peanut-sensitized mice transferred with CD4+CD25+ T cells isolated from EPIT-treated C57BL/6 mice. Data are shown as means ± SEM for each group of mice (n = 8 in each group). *P < 0.05, **P < 0.01.

Similar articles

Cited by

References

    1. Shamji MH, Durham SR. Mechanisms of immunotherapy to aeroallergens. Clin Exp Allergy. 2011;41:1235–46. - PubMed
    1. Ebner C, Siemann U, Bohle B, et al. Immunological changes during specific immunotherapy of grass pollen allergy: reduced lymphoproliferative responses to allergen and shift from TH2 to TH1 in T-cell clones specific for Phl p 1, a major grass pollen allergen. Clin Exp Allergy. 1997;27:1007–15. - PubMed
    1. O'Brien RM, Byron KA, Varigos GA, Thomas WR. House dust mite immunotherapy results in a decrease in Der p 2-specific IFN-gamma and IL-4 expression by circulating T lymphocytes. Clin Exp Allergy. 1997;27:46–51. - PubMed
    1. Bohle B, Kinaciyan T, Gerstmayr M, Radakovics A, Jahn-Schmid B, Ebner C. Sublingual immunotherapy induces IL-10-producing T regulatory cells, allergen-specific T-cell tolerance, and immune deviation. J Allergy Clin Immunol. 2007;120:707–13. - PubMed
    1. Jutel M, Akdis M, Budak F, et al. IL-10 and TGF-beta cooperate in the regulatory T cell response to mucosal allergens in normal immunity and specific immunotherapy. Eur J Immunol. 2003;33:1205–14. - PubMed

Publication types

MeSH terms