. 2014 Mar 26:14:110.
doi: 10.1186/1472-6882-14-110.

Ruscogenin ameliorates diabetic nephropathy by its anti-inflammatory and anti-fibrotic effects in streptozotocin-induced diabetic rat

Affiliations

Ruscogenin ameliorates diabetic nephropathy by its anti-inflammatory and anti-fibrotic effects in streptozotocin-induced diabetic rat

Hung-Jen Lu et al. BMC Complement Altern Med. .

Abstract

Background: Ruscogenin is a major steroid sapogenin in the traditional Chinese herb Ophiopogon japonicus that have multiple bioactivities. Recent studies have demonstrated that ruscogenin is involved in down-regulation of intercellular adhesion molecule-1 (ICAM-1) and nuclear factor-κB (NF-κB) activation in anti-inflammatory pathways. We hypothesized that ruscogenin protects against diabetic nephropathy (DN) by inhibiting NF-κB-mediated inflammatory pathway. To test this hypothesis, the present study was to examine the effects of ruscogenin in rats with streptozotocin (STZ)-induced DN.

Methods: Diabetes was induced with STZ (60 mg/kg) by intraperitoneal injection in rats. Two weeks after STZ injection, rats in the treatment group were orally dosed with 0.3, 1.0 or 3.0 mg/kg ruscogenin for 8 weeks. The normal rats were chosen as nondiabetic control group. The rats were sacrificed 10 weeks after induction of diabetes. Changes in renal function-related parameters in plasma and urine were analyzed at the end of the study. Kidneys were isolated for pathology histology, immunohistochemistry, and Western blot analyses.

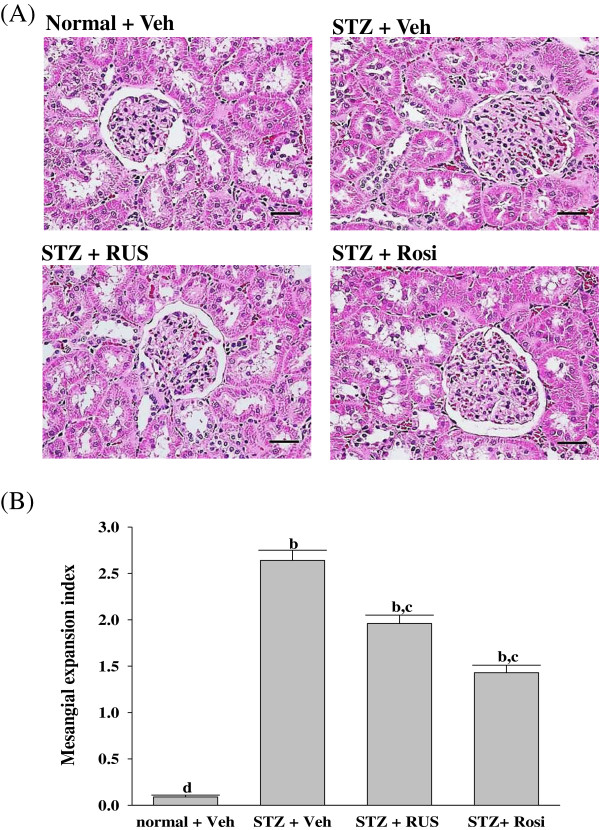
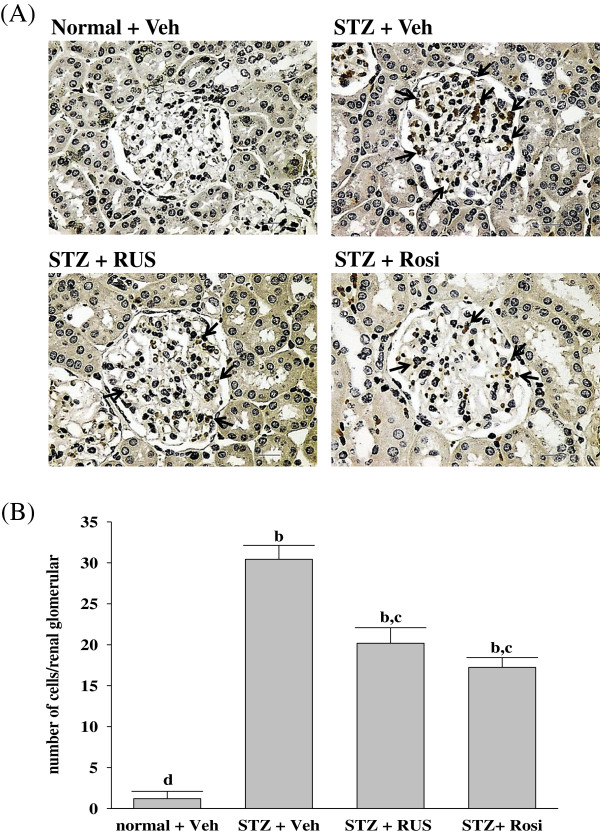
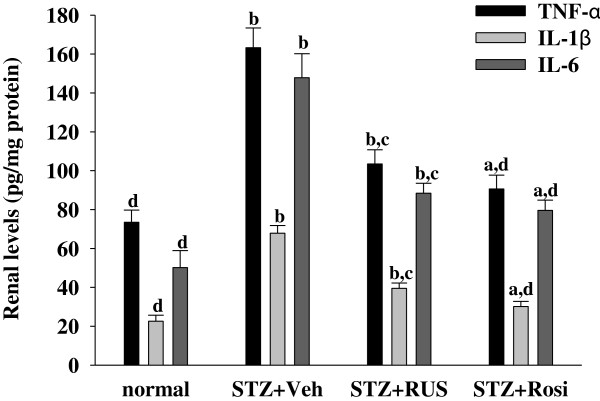
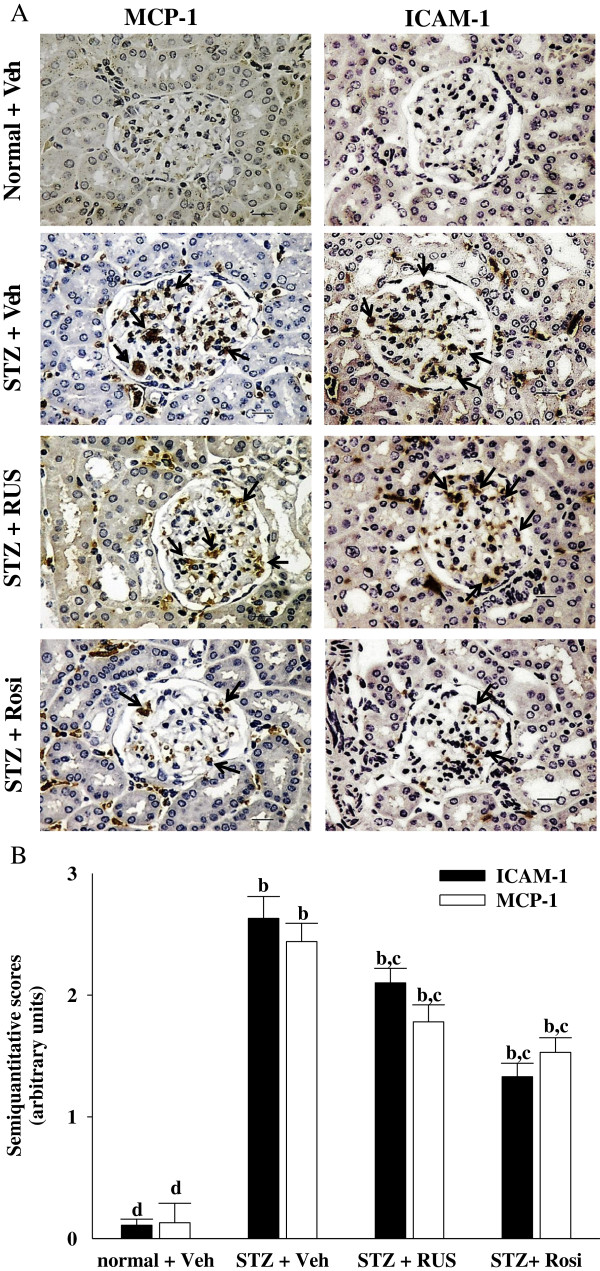
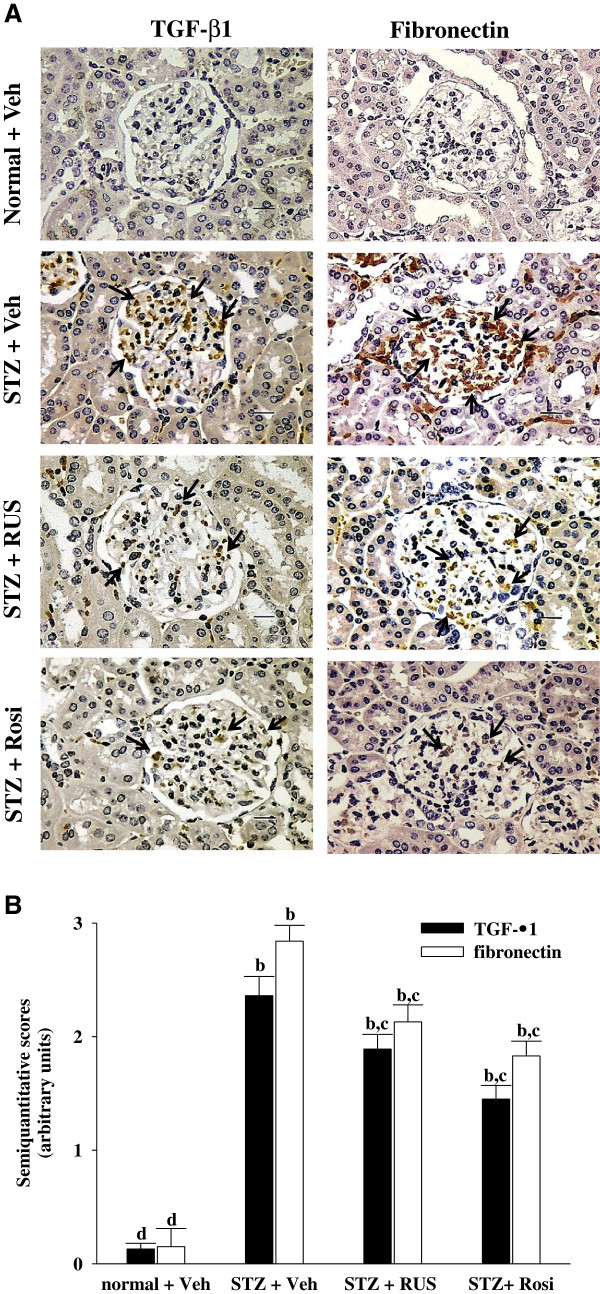
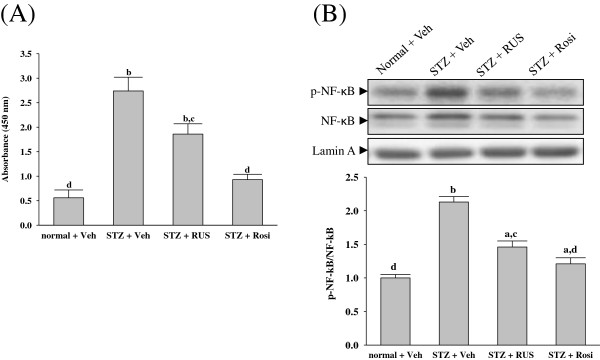
Results: Ruscogenin administration did not lower the levels of plasma glucose and glycosylated hemoglobin in STZ-diabetic rats. Diabetic rats exhibited renal dysfunction, as evidenced by reduced creatinine clearance, blood urea nitrogen and proteinuria, along with marked elevation in the ratio of kidney weight to body weight, that were reversed by ruscogenin. Ruscogenin treatment was found to markedly improve histological architecture in the diabetic kidney. Renal NF-κB activity, as wells as protein expression and infiltration of macrophages were increased in diabetic kidneys, accompanied by an increase in protein content of intercellular adhesion molecule-1 and monocyte chemoattractant protein-1 in kidney tissues. All of the above abnormalities were reversed by ruscogenin treatment, which also decreased the expression of transforming growth factor-β1 and fibronectin in the diabetic kidneys.

Conclusions: Our data demonstrated that ruscogenin suppressed the inflammation and ameliorated the structural and functional abnormalities of the diabetic kidney in rats might be associated with inhibition of NF-κB mediated inflammatory genes expression.


Figures

Figure 1
Figure 1
Effects of treatments on the renal histology. (A) Representative photomicrographs of H&E-stained kidney sections from STZ-diabetic rats treated for eight weeks with ruscogenin (RUS) or rosiglitazone (Rosi). STZ-diabetic rats were dosed by oral gavage once daily for eight weeks with 3 mg/kg RUS (STZ + RUS) or 5 mg/kg RGZ (STZ + Rosi). Normal (normal + Veh) or STZ-diabetic rats receiving vehicle treatment (STZ + Veh) were administered the same volume of vehicle (Veh) used to prepare test medications. Magnification bars = 100 μm (B) Results of quantification of the mesangial expansion index for each group. Values (mean ± SD) were obtained for each group of 5 animals. bP < 0.01 compared to vehicle-treated normal rats (normal + Veh). cP < 0.05 and dP < 0.01 compared to vehicle-treated STZ-diabetic rats (STZ + Veh), respectively.
Figure 2
Figure 2
Effects of treatments on macrophage infiltration. (A) Immunohistochemical staining for macrophage (ED-1-positive) cells in the renal tissues of STZ-diabetic rats treated for eight weeks with ruscogenin (RUS) or rosiglitazone (Rosi). STZ-diabetic rats were dosed by oral gavage once daily for eight weeks with 3 mg/kg RUS (STZ + RUS) or 5 mg/kg RGZ (STZ + Rosi). Normal (normal + Veh) or STZ-diabetic rats receiving vehicle treatment (STZ + Veh) were administered the same volume of vehicle (Veh) used to prepare test medications. Arrows indicate positive areas. Magnification bars = 50 μm. (B) Quantified results are shown for number of macrophages (ED-1-positive cells). Values (mean ± SD) were obtained for each group of 5 animals. bP < 0.01 compared to vehicle-treated normal rats (normal + Veh). cP < 0.05 and dP < 0.01 compared to vehicle-treated STZ-diabetic rats (STZ + Veh), respectively.
Figure 3
Figure 3
Effects of treatments on cytokines levels in renal tissues of rats. STZ-diabetic rats treated for eight weeks with ruscogenin (RUS) or rosiglitazone (Rosi). STZ-diabetic rats were dosed by oral gavage once daily for eight weeks with 3 mg/kg RUS (STZ + RUS) or 5 mg/kg RGZ (STZ + Rosi). Normal (normal + Veh) or STZ-diabetic rats receiving vehicle treatment (STZ + Veh) were administered the same volume of vehicle (Veh) used to prepare test medications. Values (mean ± SD) were obtained for each group of 8 animals. aP < 0.05 and bP < 0.01 compared to the values of vehicle-treated normal rats, respectively. cP < 0.05 and dP < 0.01 compared to the values of vehicle-treated STZ-diabetic rats, respectively.
Figure 4
Figure 4
Effects of treatments on protein expressions of MCP-1 and ICAM-1 in the renal tissues of rats. (A) Immunohistochemical staining for MCP-1 and ICAM-1 in renal tissues of STZ-diabetic rats treated for eight weeks with ruscogenin (RUS) or rosiglitazone (Rosi). STZ-diabetic rats were dosed by oral gavage once daily for eight weeks with 3 mg/kg RUS (STZ + RUS) or 5 mg/kg RGZ (STZ + Rosi). Normal (normal + Veh) or STZ-diabetic rats receiving vehicle treatment (STZ + Veh) were administered the same volume of vehicle (Veh) used to prepare test medications. Arrows indicate positive areas. Magnification bars = 50 μm. (B) Semi-quantitative assessments of the immunostaining were scored using 4 levels, and an average value was obtained from analyses of more than 30 glomeruli per rat. Values (mean ± SD) were obtained for each group of 5 animals. bP < 0.01 compared to vehicle-treated normal rats (normal + Veh). cP < 0.05 and dP < 0.01 compared to vehicle-treated STZ-diabetic rats (STZ + Veh), respectively.
Figure 5
Figure 5
Effects of treatments on protein expressions of TGF-β1 and fibronectin in renal tissues of rats. (A) Immunohistochemical staining for TGF-β1 and fibronectin in renal tissues of STZ-diabetic rats treated for eight weeks with ruscogenin (RUS) or rosiglitazone (Rosi). STZ-diabetic rats were dosed by oral gavage once daily for eight weeks with 3 mg/kg RUS (STZ + RUS) or 5 mg/kg RGZ (STZ + Rosi). Normal (normal + Veh) or STZ-diabetic rats receiving vehicle treatment (STZ + Veh) were administered the same volume of vehicle (Veh) used to prepare test medications. Arrows indicate positive areas. Magnification bars = 50 μm. (B) Semi-quantitative assessments of the immunostaining were scored using 4 levels, and an average value was obtained from analyses of more than 30 glomeruli per rat. Values (mean ± SD) were obtained for each group of 5 animals. bP < 0.01 compared to vehicle-treated normal rats (normal + Veh). cP < 0.05 and dP < 0.01 compared to vehicle-treated STZ-diabetic rats (STZ + Veh), respectively.
Figure 6
Figure 6
Effects of treatments on NF-κB activity (A) and phosphorylated NF-κB (B) in renal tissues of rats. STZ-diabetic rats treated for eight weeks with ruscogenin (RUS) or rosiglitazone (Rosi). STZ-diabetic rats were dosed by oral gavage once daily for eight weeks with 3 mg/kg RUS (STZ + RUS) or 5 mg/kg RGZ (STZ + Rosi). Normal (normal + Veh) or STZ-diabetic rats receiving vehicle treatment (STZ + Veh) were administered the same volume of vehicle (Veh) used to prepare test medications. The mean density values of p-NF-κB were expressed as ratios relative to that of NF-κB. The level of lamin A was estimated for equal loading of nuclear sample. Values (mean ± SD) were obtained for each group of 5 animals. aP < 0.05 and bP < 0.01 compared with vehicle-treated normal rats (normal + Veh), respectively. cP < 0.05 and dP < 0.01 compared to vehicle-treated STZ-diabetic rats (STZ + Veh), respectively.

References

    1. Forbes JM, Cooper ME. Mechanisms of diabetic complications. Physiol Rev. 2013;93:137–188. doi: 10.1152/physrev.00045.2011. - DOI - PubMed
    1. Kolset SO, Reinholt FP, Jenssen T. Diabetic nephropathy and extracellular matrix. J Histochem Cytochem. 2012;60:976–986. doi: 10.1369/0022155412465073. - DOI - PMC - PubMed
    1. Lim AK, Tesch GH. Inflammation in diabetic nephropathy. Mediators Inflamm. 2012;2012:146154. - PMC - PubMed
    1. Wada J, Makino H. Inflammation and the pathogenesis of diabetic nephropathy. Clin Sci (Lond) 2013;124:139–152. doi: 10.1042/CS20120198. - DOI - PubMed
    1. Nguyen D, Ping F, Mu W, Hill P, Atkins RC, Chadban SJ. Macrophage accumulation in human progressive diabetic nephropathy. Nephrology. 2006;11:226–231. doi: 10.1111/j.1440-1797.2006.00576.x. - DOI - PubMed

MeSH terms