. 2014 Mar 25:11:13.
doi: 10.1186/1743-8977-11-13.

Titanium dioxide nanoparticle impact and translocation through ex vivo, in vivo and in vitro gut epithelia

Affiliations

Titanium dioxide nanoparticle impact and translocation through ex vivo, in vivo and in vitro gut epithelia

Emilie Brun et al. Part Fibre Toxicol. .

Abstract

Background: TiO2 particles are commonly used as dietary supplements and may contain up to 36% of nano-sized particles (TiO2-NPs). Still impact and translocation of NPs through the gut epithelium is poorly documented.

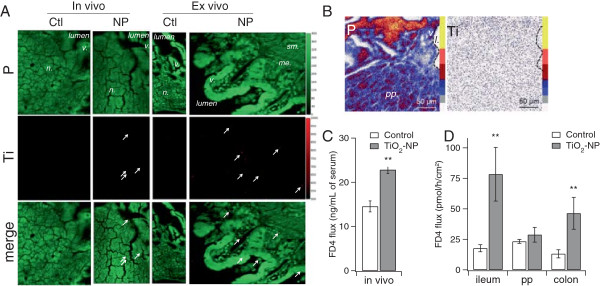
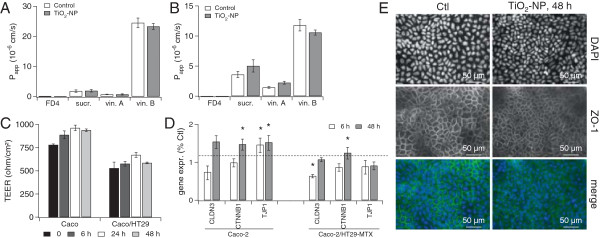
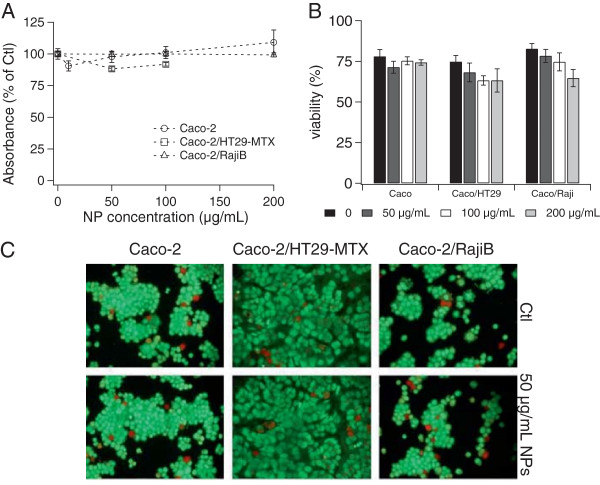
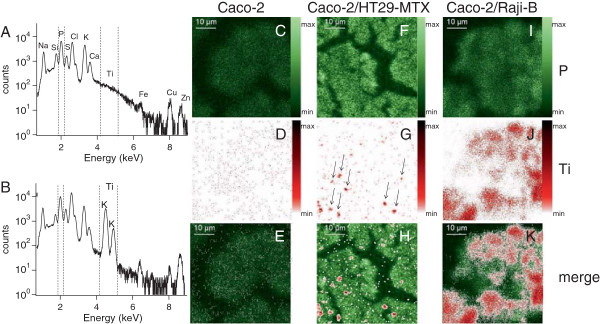
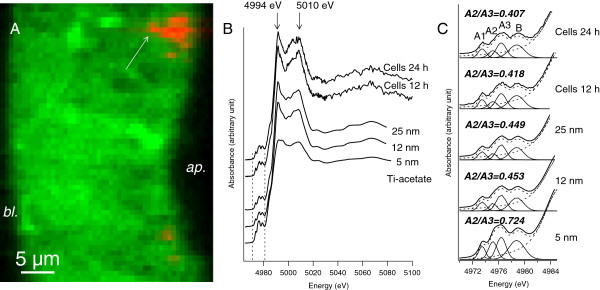
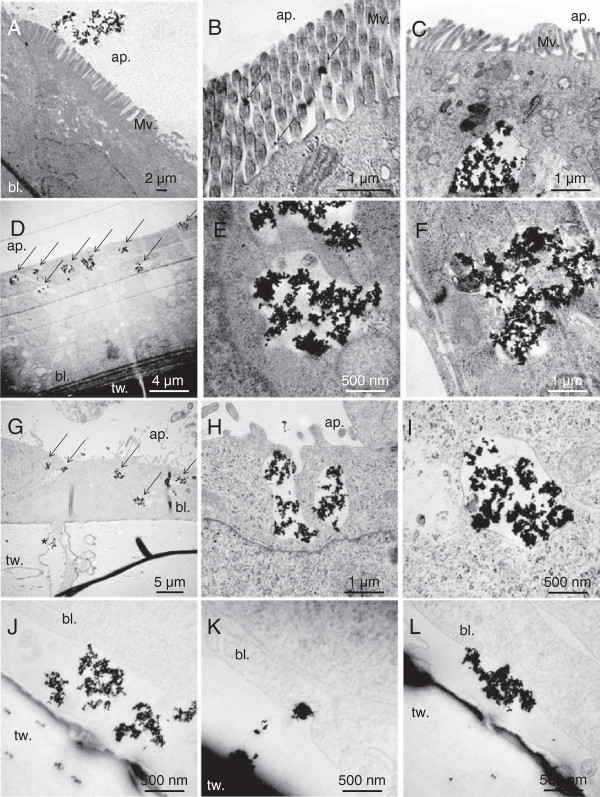
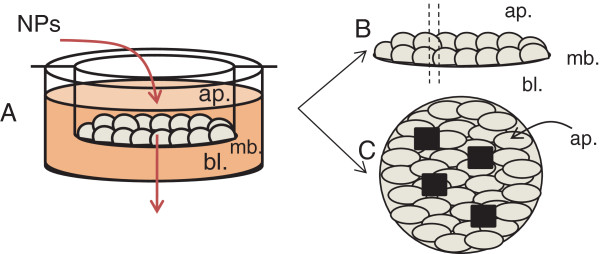
Results: We show that, in vivo and ex vivo, agglomerates of TiO2-NPs cross both the regular ileum epithelium and the follicle-associated epithelium (FAE) and alter the paracellular permeability of the ileum and colon epithelia. In vitro, they accumulate in M-cells and mucus-secreting cells, much less in enterocytes. They do not cause overt cytotoxicity or apoptosis. They translocate through a model of FAE only, but induce tight junctions remodeling in the regular ileum epithelium, which is a sign of integrity alteration and suggests paracellular passage of NPs. Finally we prove that TiO2-NPs do not dissolve when sequestered up to 24 h in gut cells.

Conclusions: Taken together these data prove that TiO2-NPs would possibly translocate through both the regular epithelium lining the ileum and through Peyer's patches, would induce epithelium impairment, and would persist in gut cells where they would possibly induce chronic damage.


Figures

Figure 1
Figure 1
Micro-XRF observation of TiO2-NP accumulation and impact ex vivo and in vivo. In the in vivo experiment, mice were exposed to a single gavage of 12.5 mg/kg TiO2-NPs and sacrified 6 h after the gavage (in vivo); ex vivo explants were exposed for 2 h to 50 μg/mL of TiO2-NPs. Micro-XRF images of cross sections of the gut from the in vivo (A, in vivo) and the ex vivo (A, ex vivo) experiments. Green: phosphorous (P) distribution map and red: titanium (Ti) distribution map. Ti-rich zones are pointed out with arrows. PIXE images of a cross section of the gut from the in vivo experiment (B). Phosphorous (P) and titanium (Ti) distribution maps, with their colour scale. Lymphoid nodule (n.), villi (v.), submucosa (sm.), muscularis externa (me.), lumen (l.). Paracellular permability probed by measurement of FITC-Dextran 4 kDa flux through mouse gut in vivo (C) and through ex vivo explants of the ileum, Peyer’s patches (pp.) and colon (D). Average of eight replicates ± standard error of the mean. Results were considered statistically significant (**) when p < 0.01.
Figure 2
Figure 2
Impact of TiO2-NPs on in vitro gut epithelia transport function and integrity. Transport functions of Caco-2 cells (A) or Caco-2/HT29-MTX coculture (B) exposed to 50 μg/mL TiO2-NPs for 48 h (TiO2-NP) or not exposed (Control). Paracellular transport is probed by FITC-Dextran 4 kDa (FD4) and 14C-sucrose (sucr.) fluxes; the activity of the P-gP is probed by 14C-vinblastin apical to basolateral (vin. A) or basolateral to apical (vin. B) fluxes. Papp is the permeability coefficient, calculated as Papp = dQ/(dt × A × C0) where dQ/dt is the amount of labelled compound transported per time unit; A is the surface of the transwell and C0 is the initial concentration in the donor compartment. Transepithelial resistance (TEER) of Caco-2 cells and Caco-2/HT29-MTX coculture exposed for 0 h, 6 h, 24 h or 48 h to 50 μg/mL of TiO2-NPs (C). Relative expression of genes encoding proteins involved in cell junction maintenance, measured in cells exposed to 50 μg/mL of TiO2-NPs for 6 h or 48 h (D). Immunstaining of the nucleus (DAPI) and ZO-1 (TJP1) protein distribution in Caco-2 cells either non exposed (Ctl) or exposed to 50 μg/mL TiO2-NPs for 48 h (E). Results are the average of three replicates ± standard deviation; they were considered statistically significant (*) when p < 0.05 (A-C). Statistical significance of qPCR data (D) was examined by randomization tests using REST2009 [37].
Figure 3
Figure 3
NP impact on cell viability and epithelial integrity. Cell viability probed with the MTT assay (A) or trypan blue exclusion assay (B) after 48 h of exposure to TiO2-NP concentrations ranging from 0 to 200 μg/mL. Results are expressed as average of eight replicates (MTT) or three replicates (trypan blue) ± standard deviation; they were considered statistically significant (*) when p < 0.05. Caco: Caco-2, HT29: HT29-MTX. Assessment of apoptosis and necrosis in control epithelia or epithelia exposed for 48 h to 50 μg/mL of TiO2-NPs (C): cells were stained with acridin orange/ethidium bromide; viable cells stain green, apoptotic cells stain orange and necrotic cells stain red.
Figure 4
Figure 4
Particle-induced X-ray emission (PIXE) spectra and maps of P and Ti distribution. PIXE spectra displaying the regions of interest (between dashed lines) selected for mapping and quantification of P and Ti content, on Caco-2 monoculture (A) and Caco-2/HT29-MTX co-culture (B). Chemical element distribution in the Caco-2 monoculture (C-E), Caco-2/HT29-MTX co-culture (F-H) and the Caco-2/RajiB co-culture (I-K), exposed to 50 μg/mL TiO2-NPs for 24 h: distribution of phosphorous (P) (C, F, I) and of titanium (Ti) (D, G, J), merge of P and Ti distribution maps (E, H, K).
Figure 5
Figure 5
In situ XAS analysis of intracellular Ti-rich regions. Micro-XRF image of a cross-section of Caco-2 cells exposed for 24 h, on their apical pole, to 50 μg/mL of TiO2-NPs (A). Ap.: apical pole; bl.: basolateral pole. Phosphorous (P) distribution map is depicted in green and titanium (Ti) distribution map is depicted in red. The area pointed out with an arrow was further analysed by XAS. XAS spectra of reference Ti-acetate and TiO2 anatase nanopowders (5, 12 and 25 nm) and of Ti-rich regions in Caco-2 cells exposed for 12 h (Cells 12 h) or 24 h (Cells 24 h) to 50 μg/mL of 12 nm-diameter anatase TiO2-NPs (B). Focus on the pre-edge region (4972-4985 eV) and its deconvolution using an arctangent function and 4 Gaussian peaks (A1, A2, A3, B) (C). Solid line: recorded data, dashed line: fit. Panels indicate A2/A3, which is the ration of intensity of A2 to intensity of A3.
Figure 6
Figure 6
TEM observation of TiO2-NP accumulation, in vitro. TiO2-NP distribution in a Caco-2 monoculture (A-C), a Caco-2/HT29-MTX co-culture (D-F), and a Caco-2/RajiB co-culture (G-L) exposed on their apical pole to 50 μg/mL of TiO2-NPs for 48 h. tw.: transwell insert on which cells are grown, making possible the identification of the basolateral pole (bl.), on the opposite side of the apical pole (ap.). Ti-rich zones are pointed out with arrows.
Figure 7
Figure 7
Exposure protocol. Gut cells were grown on semi-permeable transwell inserts then exposed to 50 μg/mL of TiO2-NPs on their apical pole (A). Cells were chemically fixed, embedded in Epon resin and cross sectioned for TEM observation and SR-μXRF imaging (B); or transwell membranes were dissected and deposited on an appropriate sample holder, taking care of preserving epithelial polarity, cryofixed, freeze-dried and analysed for their NP accumulation through global μPIXE/μRBS analysis of the cell monolayer (4 areas of 50 μm×50 μm) (C).

Similar articles

Cited by

References

    1. Chaudhry Q, Scotter M, Blackburn J, Ross B, Boxall A, Castle L, Aitken R, Watkins R. Applications and implications of nanotechnologies for the food sector. Food Addit Contam A. 2008;25:241–258. doi: 10.1080/02652030701744538. - DOI - PubMed
    1. US-EPA. Book Nanomaterial case study: nanoscale titanium dioxide in water treatment and in topical sunscreen. Research Triangle Park, NC: City: National Center for Environmental Assessment-RTP division, Office of Research and Development, U.S. Environmental Protection Agency; 2010. Nanomaterial case study: nanoscale titanium dioxide in water treatment and in topical sunscreen; p. 222.
    1. Weir A, Westerhoff P, Fabricius L, Hristovski K, von Goetz N. Titanium dioxide nanoparticles in food and personal care products. Environ Sci Technol. 2012;46:2242–2250. doi: 10.1021/es204168d. - DOI - PMC - PubMed
    1. Chen XX, Cheng B, Yang YX, Cao A, Liu JH, Du LJ, Liu Y, Zhao Y, Wang H. Characterization and preliminary toxicity assay of nano-titanium dioxide additive in sugar-coated chewing gum. Small. 2012;2012:201201506. - PubMed
    1. Bergin IL, Witzmann FA. Nanoparticle toxicity by the gastrointestinal route: evidence and knowledge gaps. Int J Biomed Nanosci Nanotechnol. 2013;3:054515. - PMC - PubMed

Publication types

MeSH terms

LinkOut - more resources