. 2014 Mar 25;7(318):ra29.
doi: 10.1126/scisignal.2005125.

Antagonism of EGFR and HER3 enhances the response to inhibitors of the PI3K-Akt pathway in triple-negative breast cancer

Affiliations

Antagonism of EGFR and HER3 enhances the response to inhibitors of the PI3K-Akt pathway in triple-negative breast cancer

Jessica J Tao et al. Sci Signal. .

Abstract

Both abundant epidermal growth factor receptor (EGFR or ErbB1) and high activity of the phosphatidylinositol 3-kinase (PI3K)-Akt pathway are common and therapeutically targeted in triple-negative breast cancer (TNBC). However, activation of another EGFR family member [human epidermal growth factor receptor 3 (HER3) (or ErbB3)] may limit the antitumor effects of these drugs. We found that TNBC cell lines cultured with the EGFR or HER3 ligand EGF or heregulin, respectively, and treated with either an Akt inhibitor (GDC-0068) or a PI3K inhibitor (GDC-0941) had increased abundance and phosphorylation of HER3. The phosphorylation of HER3 and EGFR in response to these treatments was reduced by the addition of a dual EGFR and HER3 inhibitor (MEHD7945A). MEHD7945A also decreased the phosphorylation (and activation) of EGFR and HER3 and the phosphorylation of downstream targets that occurred in response to the combination of EGFR ligands and PI3K-Akt pathway inhibitors. In culture, inhibition of the PI3K-Akt pathway combined with either MEHD7945A or knockdown of HER3 decreased cell proliferation compared with inhibition of the PI3K-Akt pathway alone. Combining either GDC-0068 or GDC-0941 with MEHD7945A inhibited the growth of xenografts derived from TNBC cell lines or from TNBC patient tumors, and this combination treatment was also more effective than combining either GDC-0068 or GDC-0941 with cetuximab, an EGFR-targeted antibody. After therapy with EGFR-targeted antibodies, some patients had residual tumors with increased HER3 abundance and EGFR/HER3 dimerization (an activating interaction). Thus, we propose that concomitant blockade of EGFR, HER3, and the PI3K-Akt pathway in TNBC should be investigated in the clinical setting.


Conflict of interest statement

Competing interests: S.H., S.S., and P.K. are employees of Prometheus Therapeutics & Diagnostics. M.S. is a consultant for Prometheus Therapeutics & Diagnostics. J.B. had consultant and advisory roles at Genentech. CM.P. is an equity stock holder and a member of the Board of Directors of BioClassifier LLC and University Genomics.

Figures

Fig. 1
Fig. 1. Therapeutic activity of combined inhibition of EGFR, HER3, and the PI3K-Akt pathway in TNBC preclinical models
(A) Western blot for total and phosphorylated EGFR, HER3, and downstream proteins HCC70 and MDA-MB-468 (MDA468) cells after the indicated treatments for 24 hours: EGF or NRG1, 4 ng/ml; MEHD7945A, 10 nM; GDC-0068 and GDC-0941, 1 μM. (B) Analysis of the proliferation of HCC70 (left) and MDA-MB-468 cells (right) treated for 5 days as indicated; concentrations as in (A). (C) Tumor growth curves of TNBC PDX treated as indicated: MEHD7945A (MEHD), 10 mg/kg twice weekly; GDC-0941, 75 mg/kg daily; GDC-0068, 40 mg/kg daily. (D) CEER analysis of total and phosphorylated EGFR and HER3 in PDXs treated as indicated. Blots in (A) are representative of and data in (B) are means ± SEM from two experiments. n ≥ 8 and n ≥ 3 for each treatment arms in (B) and (D), respectively; *P = 0.048 in (C), GDC-0941 + MEHD versus GDC-0941, and *P = 0.007, GDC-0068 + MEHD versus GDC-0068. (D) **P = 0.054, GDC-0941 + MEHD versus GDC-0941, two-sided Student's t test.
Fig. 2
Fig. 2. Efficacy of MEHD7945A or cetuximab in combination with PI3K inhibition
(A) Left: Proliferation analysis of HCC70 cells treated for 5 days as indicated in the presence of EGF (top) or NRG1 (bottom). MEHD7945A (MEHD) and cetuximab (Cetux), 10 nM; GDC-0068 and GDC-0941, 1 μM. Right: Western blot for phosphorylated and total EGFR and HER3 in HCC70 cells treated as indicated. Blots are representative of two experiments. (B) Tumor growth curves of HCC70 xenografts treated as indicated, doses as in Fig. 1A. (C) CEER analysis of active and total EGFR and HER3 in HCC70 xenografts treated as indicated. Data are means ± SEM. n≥8 and n≥3 for each treatment arms in (B) and (D), respectively, at least three tumors per condition; (B) *P = 0.020, GDC-0941 + MEHD versus GDC-0941, and P= 0.0054, GDC-0941 + MEHD versus GDC-0941 + Cetux. (C) **P = 0.0004, GDC-0941 + MEHD versus control, and P < 0.0001, GDC-0941 + Cetux versus control. (C) ***P = 0.054, GDC-0941 + MEHD versus GDC-0941, Student's t test.
Fig. 3
Fig. 3. EGFR expression and response to anti-EGFR therapy in TNBC patients
(A) Correlation between the abundance of EGFR (table S2) and pCR in 47 TNBC patients treated with panitumumab combination therapy (receiver operating characteristic curve, P = 0.08). (B) EGFR abundance in tumors before and after treatment with either panitumumab or cetuximab combination therapy in patients who did not achieve pCR (P = 0.0048). (C) Representative IHC images (×25 magnification) of EGFR abundance in residual tumors (posttreatment) versus baseline specimens (pre-treatment). Scale bars, 80 μm.
Fig. 4
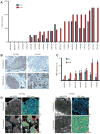
Fig. 4. HER3 expression and response to anti-EGFR therapy in TNBC patients
(A) HER3 abundance by IHC in tumors before and after panitumumab-based treatment in patients who did not achieve pCR (P = 0.0028). (B) Representative IHC (×25 magnification) from two patient tumors analyzed in (A). Scale bars, 80 μm. (C) FRET analysis of HER3-EGFR dimerization in residual tumors from a subset of patients who did not achieve pCR after treatment with panitumumab/cetuximab-based therapy. (D) Representative time-resolved immunofluorescence images (×20 magnification) from two tumors analyzed in (A) to (C). Grayscale image shows intensity of the donor fluorophore, and pseudocolor image shows the pixel-by-pixel FRET efficiency values. Scale bar, 50 μm.

References

    1. Shah SP, Roth A, Goya R, Oloumi A, Ha G, Zhao Y, Turashvili G, Ding J, Tse K, Haffari G, Bashashati A, Prentice LM, Khattra J, Burleigh A, Yap D, Bernard V, McPherson A, Shumansky K, Crisan A, Giuliany R, Heravi-Moussavi A, Rosner J, Lai D, Birol I, Varhol R, Tam A, Dhalla N, Zeng T, Ma K, Chan SK, Griffith M, Moradian A, Cheng SW, Morin GB, Watson P, Gelmon K, Chia S, Chin SF, Curtis C, Rueda OM, Pharoah PD, Damaraju S, Mackey J, Hoon K, Harkins T, Tadigotla V, Sigaroudinia M, Gascard P, Tlsty T, Costello JF, Meyer IM, Eaves CJ, Wasserman WW, Jones S, Huntsman D, Hirst M, Caldas C, Marra MA, Aparicio S. The clonal and mutational evolution spectrum of primary triple-negative breast cancers. Nature. 2012;486:395–399. - PMC - PubMed
    1. Foulkes WD, Smith IE, Reis-Filho JS. Triple-negative breast cancer. N Engl J Med. 2010;363:1938–1948. - PubMed
    1. Dent R, Hanna WM, Trudeau M, Rawlinson E, Sun P, Narod SA. Pattern of metastatic spread in triple-negative breast cancer. Breast Cancer Res Treat. 2009;115:423–428. - PubMed
    1. André F, Zielinski CC. Optimal strategies for the treatment of metastatic triple-negative breast cancer with currently approved agents. Ann Oncol. 2012;23(Suppl. 6):vi46–vi51. - PubMed
    1. Carey LA. Directed therapy of subtypes of triple-negative breast cancer. Oncologist. 2011;16(Suppl. 1):71–78. - PubMed

Publication types

MeSH terms