. 2014 Mar 26:5:3543.
doi: 10.1038/ncomms4543.

Spontaneous tumour regression in keratoacanthomas is driven by Wnt/retinoic acid signalling cross-talk

Affiliations
Free PMC article

Spontaneous tumour regression in keratoacanthomas is driven by Wnt/retinoic acid signalling cross-talk

Giovanni Zito et al. Nat Commun. .
Free PMC article

Abstract

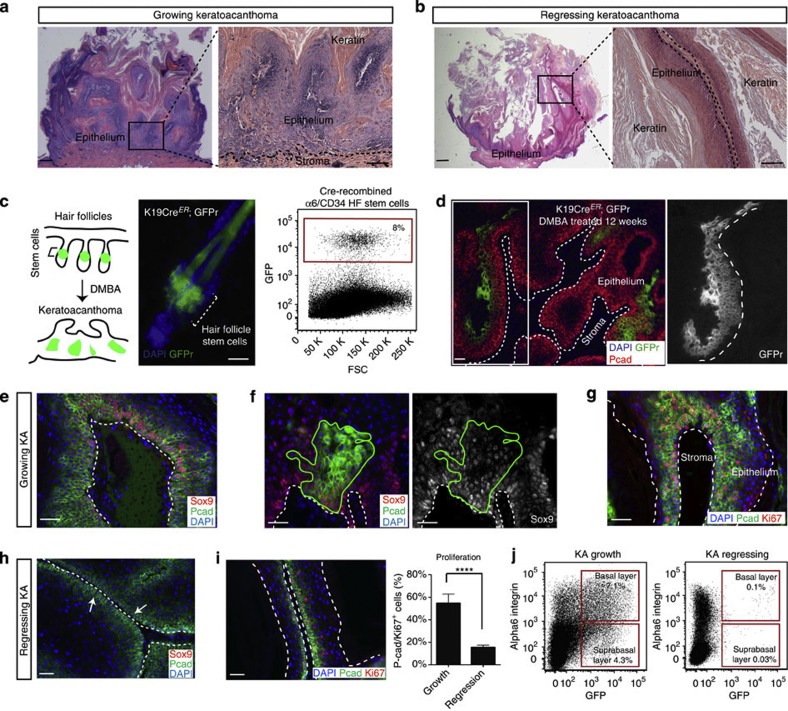
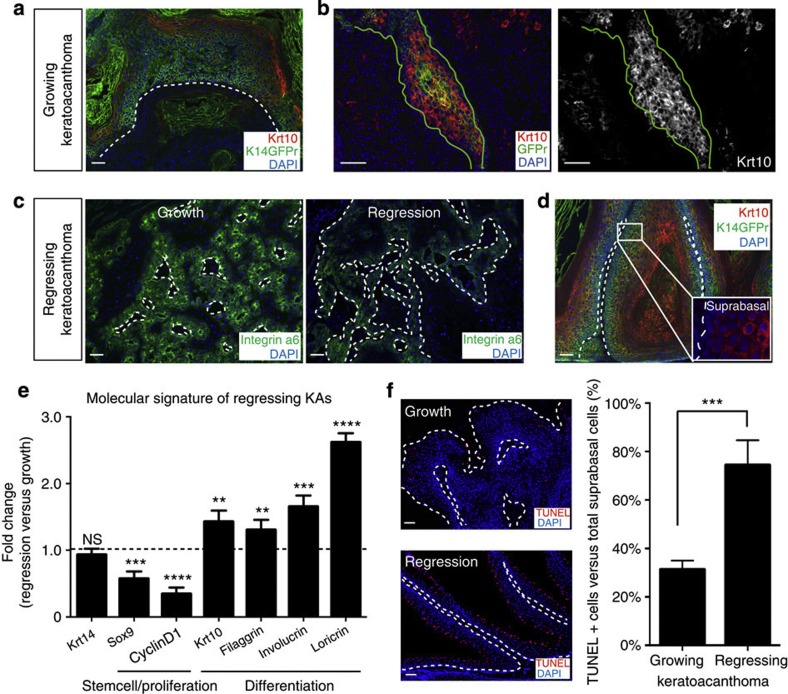
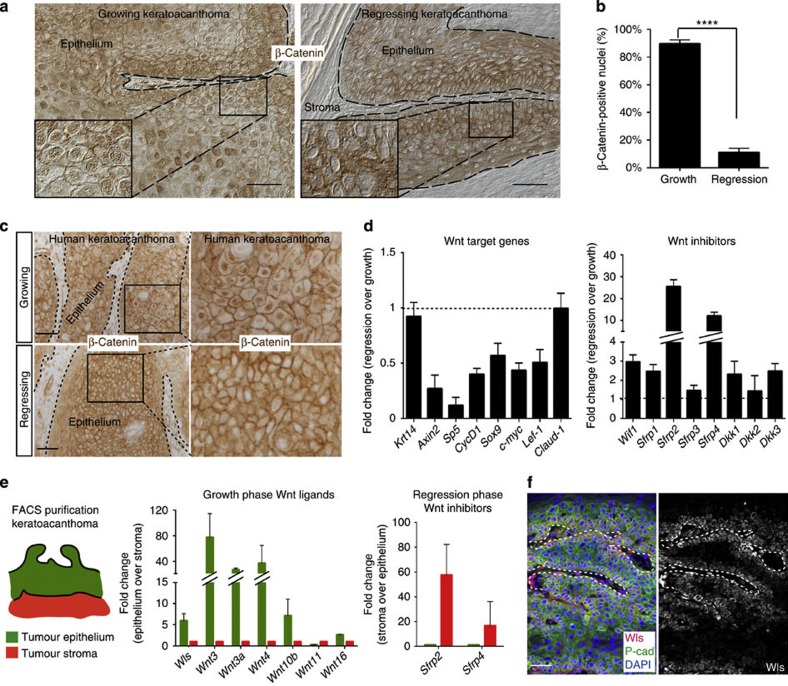
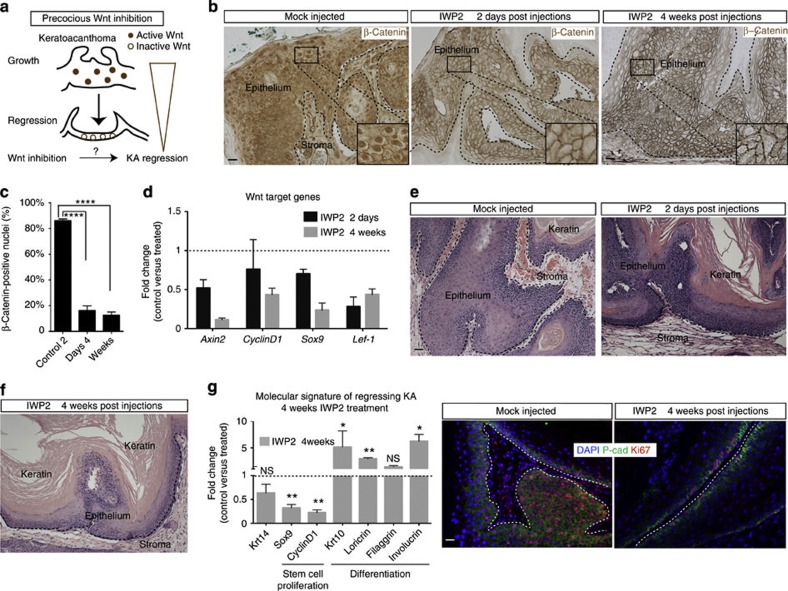
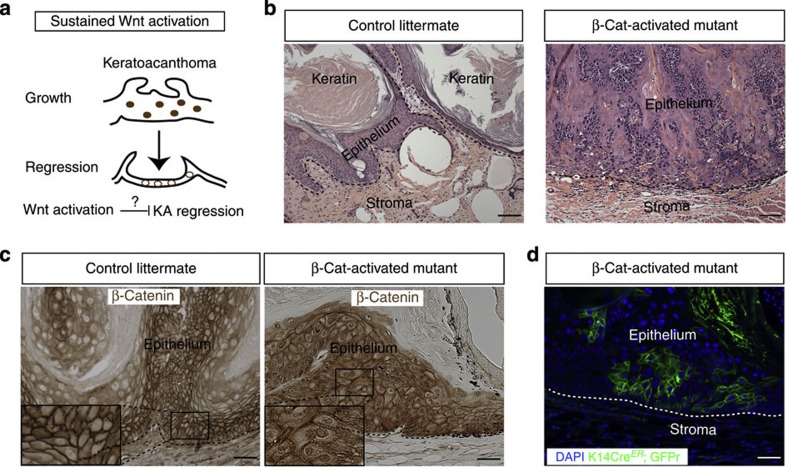
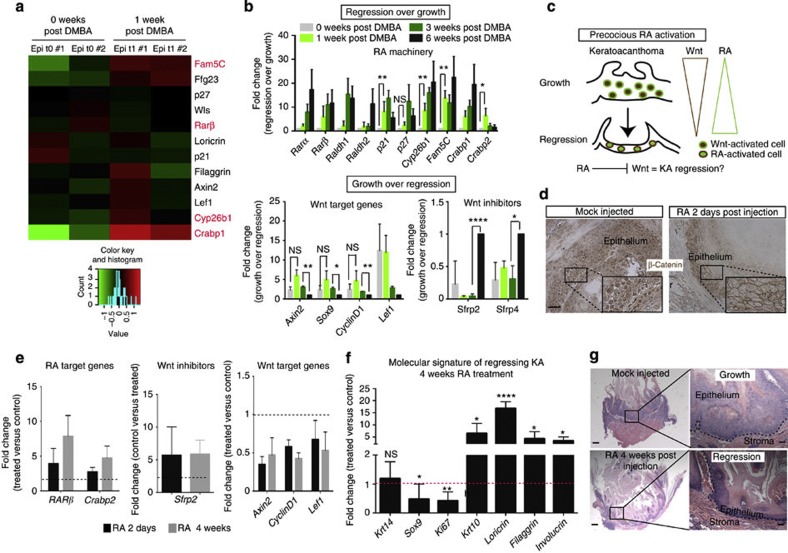
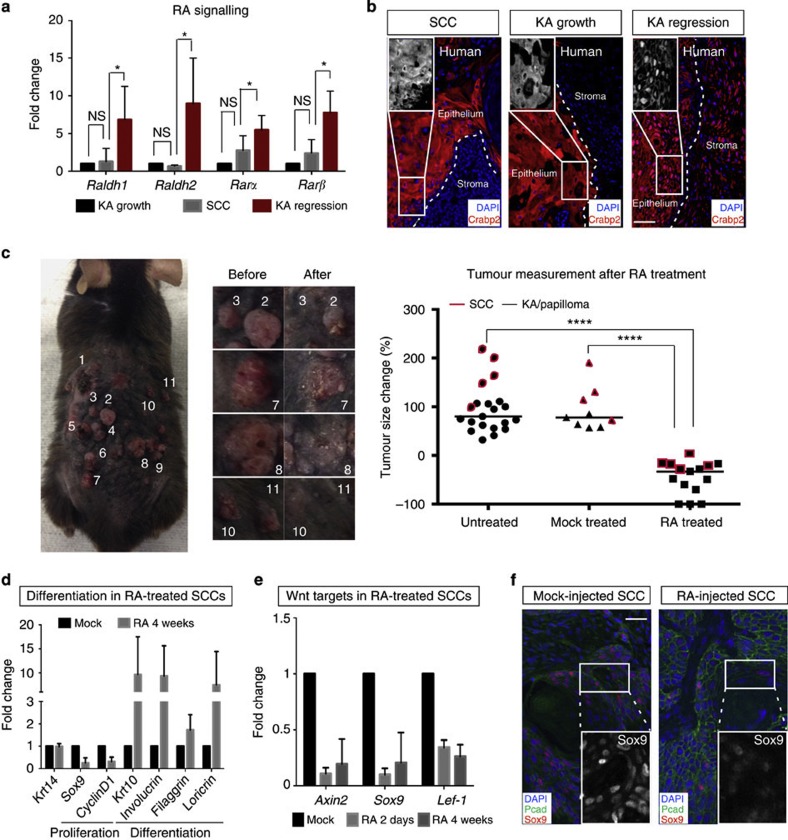
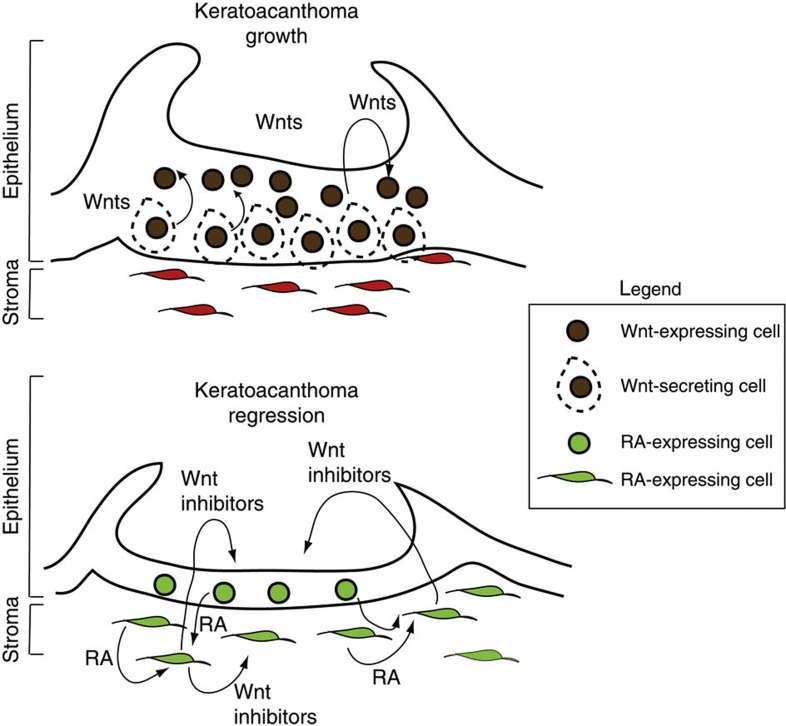
A fundamental goal in cancer biology is to identify the cells and signalling pathways that are keys to induce tumour regression. Here we use a spontaneously self-regressing tumour, cutaneous keratoacanthoma (KAs), to identify physiological mechanisms that drive tumour regression. By using a mouse model system that recapitulates the behaviour of human KAs, we show that self-regressing tumours shift their balance to a differentiation programme during regression. Furthermore, we demonstrate that developmental programs utilized for skin hair follicle regeneration, such as Wnt, are hijacked to sustain tumour growth and that the retinoic acid (RA) signalling pathway promotes tumour regression by inhibiting Wnt signalling. Finally, we find that RA signalling can induce regression of malignant tumours that do not normally spontaneously regress, such as squamous cell carcinomas. These findings provide new insights into the physiological mechanisms of tumour regression and suggest therapeutic strategies to induce tumour regression.


Figures

Figure 1
Figure 1. Mouse KA tumours recapitulate human KAs and they originate from HFSC descendants.
(a,b) Hematoxylin and eosin staining shows mouse KA in the growth phase and the regression phase (scale bar, 100 μm for pictures on the left, and 50 μm for pictures on the right). (c) Schematic representation of the genetic lineage tracing approach utilized for labelling the HFSCs. Representative image of a hair follicle from tamoxifen-treated Krt19CreER; Rosa26 mTmGFP mice. The fluorescent reporter (GFPr, in green) labels the stem cells and the progeny. Dotted bracket indicates the location of the stem cells within the hair follicle (scale bar, 20 μm). Flow cytometry analysis of GFP+ cells in the HFSC compartment prior to DMBA treatment (n=3). (d) DMBA was applied to tamoxifen-treated K19CreER; Rosa26mTmGFP mice. Twelve weeks post-DMBA treatment, GFP+ hair follicle descendant cells were found in the epithelium of KA tumours, as shown by GFP (green) co-localization with P-cadherin (red) (n=18, scale bar, 50 μm). (e,h) Sox9 staining in KA tumours sections during growth and regression phases (n=3, scale bar, 50 μm). (f) Immunofluorescence staining for Sox9 showing co-localization with the HFSCs-derived cells (HFSCs, green) after Cre recombination tamoxifen mediated. Continuous green lines identify the HFSC descendants (scale bar, 50 μm). (g,i) Immunofluorescence staining for the proliferation marker Ki67 in KAs tumours during growth and regression phase shows reduction in the number of Ki67+ (red) and P-cadherin+ (green) cells during regression (scale bar, 50 μm). Cell proliferation has been quantified in KA during growth or regression (n=4). Data are represented as mean±s.d., ****<0.001 obtained by unpaired t-test analysis. (j) Representative flow cytometry analysis of HFSC-derived GFP+ cells during KA growth and regression (n=7 and n=8, respectively). In all the pictures, dotted lines indicate the tumour/stroma interface. In all the immunofluorescence experiments performed, nuclei are marked in blue with DAPI.
Figure 2
Figure 2. Increased differentiation characterize KA tumour regression.
(a,d) KAs tumours show different expression of differentiation markers Krt10 (scale bar, 50 μm). (b) HFSC descendants within KA tumours (green labelling) show co-localization with Krt10. Continuous green line identifies the HFSC descendants (scale bar, 50 μm). (c) Immunofluorescence staining showing maintained expression of integrin α6 in growth and regression phase (scale bar, 50 μm). (e) qRT–PCR from whole KA tumour RNA in the regression phase. Krt14 expression levels are used as control. The comparison has been conducted by using the ΔΔCT method and normalized to Glyceraldehyde-3-phosphate dehydrogenase transcript. Dotted line represents the normalized expression level of each transcript analysed during tumour growth. Data are represented as mean±s.d. (n=4) (**<0.05, ***<0.001, ****<0.005 obtained by unpaired t-test statistical analysis). (f) Immunofluorescence staining for TUNEL and its relative quantification (KA regression versus KA growth) (n=4, ***<0.001, obtained by unpaired t-test statistical analysis) (scale bar, 50 μm). In all the pictures, dotted lines indicate the tumour/stroma interface. Nuclei are marked in blue with DAPI.
Figure 3
Figure 3. Wnt signalling is differentially regulated in growing and regressing KAs.
(a) β-Catenin immunohistochemistry on growing and regressing KAs (see also insets) (scale bar, 50 μm). (b) Quantification for nuclear β-catenin fraction in KAs confirmed a statistically significant reduction of nuclear β-catenin-positive cells in regressing KAs. Data are represented as mean±s.d. (n=4) (****<0.001 obtained by unpaired t-test statistical analysis). (c) Wnt signalling is differentially expressed in human KAs. Nuclear β-catenin immunohistochemistry shows Wnt activation in growing KAs, while absence of nuclear β-catenin indicates Wnt downregulation in human regressing KAs (scale bar, 50 μm). (d) qRT–PCR analysis of Wnt target genes and inhibitors in growing and regressing KAs. The comparison has been conducted by using the ΔΔCT method and normalized to glyceraldehyde-3-phosphate dehydrogenase (GAPDH) transcript. Dotted line represents the normalized expression level of each transcript analysed during tumour growth. Data are represented as mean±s.d. (n=4). (e) Krt14Cre; Rosa26mTmGFP mice have been used for FACS sorting epithelial and stromal cells from KA tumours in growth and regression phase. GFP (green) marks all the KA epithelial cells, while tomato (red) labels the tumoural stroma. Center panel: qRT–PCR expression analysis of the Wnt ligands in growing KAs comparing epithelium versus stroma. Right panel: qRT–PCR expression analysis of the Wnt inhibitors in regressing KAs comparing stroma versus epithelium. Both comparisons have been conducted by using the ΔΔCT method and normalized to GAPDH transcript. Data are represented as mean±s.d. (n=3). (f) Immunofluorescence staining for Wntless (Wls) and P-cadherin shows expression in KA tumoural epithelium (scale bar, 50 μm). In all the pictures, dotted lines delineate the tumour/stroma interface. In all the immunofluorescence experiments performed, nuclei are marked in blue with DAPI.
Figure 4
Figure 4. Wnt inhibition is sufficient to induce KA regression.
(a) Schematic model for Wnt inhibition as trigger for KA regression. (b,c) β-Catenin immunohistochemistry on IWP2-treated tumours versus mock-injected tumours (scale bar, 50 μm). Nuclear β-catenin quantification of the number of nuclear β-catenin+ cells at the 2 days and 4 weeks time points of IWP2-treated tumours (83%±2 versus 17%±3 and 15%±2, respectively). Data are represented as mean±s.d. (n=4) (****<0.001 obtained by unpaired t-test statistical analysis) (scale bar, 50 μm). (d) qRT–PCR analysis on IWP2- versus mock-injected KA tumours of Wnt target genes at both 2 days and 4 weeks post injections. Dotted line represents the normalized expression level of each transcript analysed during tumour growth. Data are represented as mean±s.d. (n=4). (e) Hematoxylin and eosin staining performed on IWP2 and PBS-injected tumours at 2 days and 4 weeks post injections (scale bar, 50 μm). (f) qRT–PCR for proliferation and terminal differentiation markers in IWP2-injected KAs. Dotted line represents the normalized expression level of each gene analysed during tumour growth. Data are represented as mean±s.d. (n=4) (**<0.005, *<0.01, obtained by unpaired t-test statistical analysis). (g) Ki67 (red) and P-cadherin (green) immunofluorescence staining on IWP2- and mock-injected tumours. DAPI (blue) labels all the nuclei (scale bar, 50 μm). Dotted lines delineate the tumour/stroma interface.
Figure 5
Figure 5. Wnt inhibition is required to induce KA regression.
(a) Schematic representation of the role of constitutive Wnt activation to inhibit KA tumour regression. (b) Histological analysis of K14CreER; Rosa26mTmGFP; β-catnflox(Ex3)/+ and control littermates showing that Wnt constitutive activation inhibits tumour regression (n=5 for control littermates and mutant) (scale bar, 50 μm). (c) β-Catenin immunohistochemistry on K14CreER; Rosa26mTmGFP;β-catnflox(Ex3)/+ and control littermates shows nuclear β-catenin localization in the mutant tumours in comparison with the control ones where β-catenin is expressed in the membrane (scale bar, 50 μm). (d) KA tumour from K14CreER; Rosa26mTmGFP; β-catnflox(Ex3)/+ mice stained with an anti-GFP antibody showing the localization of β-catenin-mutant cells within KA tumours (scale bar, 50 μm). Nuclei are labelled with DAPI (blue). Dotted lines delineate the tumour/stroma interface.
Figure 6
Figure 6. RA downregulates Wnt and promote KA tumour regression.
(a) RNA sequencing heatmap showing a subset of genes differentially expressed between tumour in growth (0 weeks post DMBA) and early regression (1 week post DMBA). The colour coded values are mean centred log10(CPM+1). CPM (count per million): number of reads mapped to a gene for each million reads mapped to any genes. (b) qRT–PCR analysis of RA and Wnt signalling pathway on 0, 1, 3 and 6 weeks post-DMBA treatment. All the values are normalized to the 6-week post-DMBA time point. Data are represented as mean±s.d. (n=3 for each time point) (**<0.01, *<0.05, obtained by unpaired t-test statistical analysis). (c) Schematic representation that represents RA/Wnt cross-talk in regressing KAs. (d) Immunohistochemistry analysis for nuclear β-catenin+ cells in RA and mock-injected KAs (scale bar, 50 μm). (e) qRT–PCR analysis on RA and mock-injected KA tumours at 2 days and 4 weeks after last injection (n=5). (f) qRT–PCR analysis of proliferation and differentiation genes in RA and vehicle-injected KA tumours. RA versus mock-injected tumours comparison has been conducted by using the ΔΔCT method and normalized to glyceraldehyde-3-phosphate dehydrogenase transcript. Data are represented as mean±s.d. (n=5). Dotted line represents the normalized expression level of each gene analysed for the experiment (*<0.05, **<0.01, ****<0.001, obtained by unpaired t-test statistical analysis). (g) Hematoxylin and eosin staining performed on RA and mock-injected tumours at 4 weeks post injection (scale bar, 200 μm for the pictures on the left and 50 μm for the pictures on the right). Dotted lines delineate the tumour/stroma interface.
Figure 7
Figure 7. RA induces SCC tumour regression.
(a) RNA levels of RA in mouse SCC, KA in growth and regression. Data are represented as mean±s.d. (n=5 for each tumour analysed, *<0.05 obtained by unpaired t-test statistical analysis). (b) Immunofluorescence staining for Crabp2 in human SCC tumours, growing and regressing KAs (n=2 for each tumour). (c, left and central panel) Mouse treated with RA showing skin tumour regression (including SCC in the micrographs). (right panel) % of tumour growth rate by comparing untreated, mock-treated and RA-treated skin tumours at the fourth week post RA treatment. Red boxes indicate SCC tumours that have been diagnosed for each category, black box indicate KA and papilloma tumours (****<0.001 obtained by unpaired t-test statistical analysis). (d) qRT–PCR analysis for proliferation and differentiation genes in mock- and RA-injected SCC tumours. RA- versus mock-injected tumour comparison has been conducted by using the ΔΔCT method and normalized to glyceraldehyde-3-phosphate dehydrogenase (GAPDH) transcript. Data are represented as mean±s.d. (n=7). (e) qRT–PCR analysis for Wnt target genes in mock- and RA-injected SCC tumours. RA versus mock-injected tumours comparison has been conducted by using the ΔΔCT method and normalized to GAPDH transcript. Data are represented as mean±s.d. (n=5). (f) Immunofluorescence staining for Sox9 in mock- and RA-injected SCC tumours (scale bar, 50 μm).
Figure 8
Figure 8. A working model of the signalling mechanisms that regulate Keratoacanthoma tumour growth and regression.
During Keratoacanthoma tumour growth, Wnt ligands secreted by the epithelium activate the Wnt pathway and sustain tumour growth. During keratoacanthoma regression, the RA signalling pathway is activated in both tumour epithelium and stroma; stromal Wnt inhibitors signal to the epithelium, thus inducing terminal differentiation and regression.

References

    1. Hamid Y. & Poller D. N. Spontaneous regression of renal cell carcinoma: a pitfall in diagnosis of renal lesions. J. Clin. Pathol. 51, 334–336 (1998). - PMC - PubMed
    1. Drobyski W. R. & Qazi R. Spontaneous regression in non-Hodgkin’s lymphoma: clinical and pathogenetic considerations. Am. J. Hematol. 31, 138–141 (1989). - PubMed
    1. Nakagawara A. Molecular basis of spontaneous regression of neuroblastoma: role of neurotrophic signals and genetic abnormalities. Hum. Cell 11, 115–124 (1998). - PubMed
    1. Ko C. J. Keratoacanthoma: facts and controversies. Clin. Dermatol. 28, 254–261 (2010). - PubMed
    1. Blessing K., al Nafussi A. & Gordon P. M. The regressing keratoacanthoma. Histopathology 24, 381–384 (1994). - PubMed

Publication types

Associated data