. 2014 May;124(5):1945-55.
doi: 10.1172/JCI69592. Epub 2014 Mar 25.

Methyltransferase G9A regulates T cell differentiation during murine intestinal inflammation

Methyltransferase G9A regulates T cell differentiation during murine intestinal inflammation

Frann Antignano et al. J Clin Invest. 2014 May.

Abstract

Inflammatory bowel disease (IBD) pathogenesis is associated with dysregulated CD4⁺ Th cell responses, with intestinal homeostasis depending on the balance between IL-17-producing Th17 and Foxp3⁺ Tregs. Differentiation of naive T cells into Th17 and Treg subsets is associated with specific gene expression profiles; however, the contribution of epigenetic mechanisms to controlling Th17 and Treg differentiation remains unclear. Using a murine T cell transfer model of colitis, we found that T cell-intrinsic expression of the histone lysine methyltransferase G9A was required for development of pathogenic T cells and intestinal inflammation. G9A-mediated dimethylation of histone H3 lysine 9 (H3K9me2) restricted Th17 and Treg differentiation in vitro and in vivo. H3K9me2 was found at high levels in naive Th cells and was lost following Th cell activation. Loss of G9A in naive T cells was associated with increased chromatin accessibility and heightened sensitivity to TGF-β1. Pharmacological inhibition of G9A methyltransferase activity in WT T cells promoted Th17 and Treg differentiation. Our data indicate that G9A-dependent H3K9me2 is a homeostatic epigenetic checkpoint that regulates Th17 and Treg responses by limiting chromatin accessibility and TGF-β1 responsiveness, suggesting G9A as a therapeutic target for treating intestinal inflammation.


Figures

Figure 1
Figure 1. G9A is required for the development of experimental colitis.
CD4+CD25CD45RBhi naive T cells (4 × 10⁵) from G9afl/fl or G9a–/– mice were transferred into Rag1–/– mice and monitored for colitis. (A) Weight loss (percentage of initial weight) was calculated for each mouse over 7 weeks. (B) Representative sections of H&E-stained proximal colons. Scale bars: 100 μm. (C) Colitis was assessed histologically at 7 weeks after transfer, and severity of inflammation was scored. (D) Colon length, (E) spleen weight and cellularity, and (F) serum TNF-α were analyzed at 7 weeks after transfer. (G) Frequency and total number of CD4+ T cells in spleen and mLN. Each point represents an individual mouse, and the data are from 2 of 4 independent experiments (n = 5–8 per experiment). Statistics compare Rag1–/– mice that received G9afl/fl T cells to those that received G9a–/– T cells. *P < 0.05; **P < 0.01; ***P < 0.001. Error bars indicate SEM.
Figure 2
Figure 2. Expansion of Foxp3+ Tregs after transfer of naive G9a–/– Th cells into Rag1–/– mice.
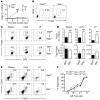
CD4+CD25CD45RBhi naive T cells (4 × 10⁵) from G9afl/fl or G9a–/– mice were transferred into Rag1–/– mice. (A) The frequency of Tregs (CD4+CD25+Foxp3+) in peripheral blood of Rag1–/– mice that received G9afl/fl or G9a–/– T cells was quantified by flow cytometry. (B) Representative CD25 and Foxp3 staining of peripheral blood CD4+ cells at 7 weeks after transfer. Numbers represent frequency of CD4+CD25+Foxp3+ cells. (C) Representative CD4 and Foxp3 staining and (D) quantitative analysis of the frequency and total number of Foxp3+ cells from the spleen, mLN, and LP from Rag1–/– mice receiving G9afl/fl or G9a–/– naive T cells. Data are from 1 representative experiment of 4 experiments (n = 5–8 per experiment). Numbers represent frequency of CD4+Foxp3+ cells. (E) Cells from the spleen, mLN, and LP of G9afl/fl or G9a–/– mice were stained for CD4 and these cells analyzed for expression of CD25 and intracellular Foxp3. Representative FACS plots are shown (n = 3–6). Numbers represent frequency of CD4+CD25+Foxp3+ cells. (F) Proliferation of bead-sorted CD4+CD25 Teff cells from WT mice cultured alone or with the indicated ratios of G9afl/fl or G9a–/– CD4+CD25+ Tregs in the presence of T cell activator beads for 4 days. Data are representative of 3 independent experiments. **P < 0.01; ***P < 0.001. Error bars indicate SEM.
Figure 3
Figure 3. Dysregulated IFN-γ and IL-17A production from G9a–/– Th cells after transfer into Rag1–/– mice.
CD4+CD25CD45RBhi naive T cells (4 × 10⁵) from G9afl/fl or G9a–/– mice were transferred into Rag1–/– mice and analyzed 7 weeks after transfer. (A) Representative IL-17A and IFN-γ expression by CD4+ cells. Numbers represent frequency of cells in each quadrant. (B) Quantitative analysis of intracellular IL-17A and IFN-γ produced by CD4+ cells in the spleen, mLN, and LP. (C) Quantitative RT-PCR analysis of mRNA transcripts encoding Ifng, Il17a, Il17f, and Rorc measured in proximal colons and expressed relative to Actb. (D) Serum IFN-γ and IL-17A levels. Each point represents an individual mouse and is from 2 of 4 independent experiments (n = 5–8 per experiment). *P < 0.05; **P < 0.01; ***P < 0.001. Error bars indicate SEM.
Figure 4
Figure 4. Dynamic regulation of histone acetylation and methylation during Th cell differentiation.
Naive CD4+ T cells (N) from WT mice were differentiated in vitro under Th17 (17) or Treg-promoting conditions and processed for ChIP analysis using antibodies specific for (A) H3K9/14Ac or (B) H3K9me2. Quantitative PCR was performed using primers for the promoters of the specific genes. Data shown are from 3 to 5 independent experiments performed in duplicate. Statistics compare differentiated cells to naive. *P < 0.05; **P < 0.01. Error bars indicate SEM.
Figure 5
Figure 5. G9A limits in vitro differentiation of Tregs.
(A) Naive CD4+ T cells from G9afl/fl or G9a–/– mice were differentiated for 6 days under Treg-promoting conditions and analyzed for Foxp3 expression. Representative flow cytometry data and quantification of Foxp3+ cells (n = 11) are shown. Numbers represent frequency of CD4+Foxp3+ cells. (B) Naive and in vitro differentiated Tregs from G9afl/fl or G9a–/– CD4+ T cells were processed for ChIP analysis using antibodies specific for H3K9me2. H3K9me2 levels were determined at the Foxp3 locus. Data shown are the mean of 3 independent experiments performed in duplicate. ***P < 0.001. Error bars indicate SEM.
Figure 6
Figure 6. Enhanced TGF-β1 sensitivity of G9a–/– T cells results in increased Foxp3+ cells under Th1 conditions.
G9afl/fl or G9a–/– naive CD4+ cells were differentiated under Th1 cell–promoting conditions with the indicated dose of TGF-β1 and analyzed at day 6 for the expression of IFN-γ and Foxp3 by flow cytometry. Data shown are representative of at least 3 independent experiments. Numbers represent frequency of cells in each quadrant.
Figure 7
Figure 7. Enhanced sensitivity to TGF-β1 leads to increased Tregs from G9a–/– T cells.
(A) G9afl/fl or G9a–/– naive CD4+ cells were differentiated under Treg-promoting conditions with the indicated dose of TGF-β1 and analyzed at day 6 for the expression of Foxp3 by flow cytometry. Numbers represent frequency of CD4+Foxp3+ cells. (B) Naive G9a–/– T cells were differentiated under Treg-promoting conditions in the presence of vehicle, neutralizing antibody to TGF-β1 (10 μg/ml), or TGF-β signaling inhibitor (LY364947, 5 μM). Data shown are representative of at least 3 independent experiments. Numbers represent frequency of CD4+Foxp3+ cells.
Figure 8
Figure 8. The methyltransferase activity of G9A is required to dampen Treg generation.
Naive CD4+ T cells from C57BL/6 mice were differentiated under Treg-promoting conditions for 6 days in the absence (ctrl) or presence of the G9A-specific inhibitors UNC0638 (UNC, n = 5) or BIX01294 (BIX, n = 8) and analyzed by flow cytometry for the expression of CD4 and Foxp3. Numbers represent frequency of CD4+Foxp3+ cells. *P < 0.05; **P < 0.01. Error bars indicate SEM.
Figure 9
Figure 9. Increased activation of the Foxp3 locus in the absence of G9A.
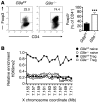
G9afl/fl or G9a–/– naive CD4+ cells were differentiated under Treg-promoting conditions for 4 days with (A) 10 ng/ml TGF-β1 and (B) 0.5 ng/ml TGF-β1 and analyzed by ChIP for H3K9/14Ac levels at the Foxp3 promoter and Foxp3 CNS1. (C) Naive CD4+CD25CD45RBhi cells from G9afl/fl or G9a–/– mice were subjected to FAIRE-seq and data analyzed at the Foxp3 locus. Schematic depicts the Foxp3 gene with locations along the X chromosome and approximate locations of the promoter and 3 CNS. Data shown are the mean from 2 to 3 independent experiments performed in duplicate. *P < 0.05. Error bars indicate SEM.

References

    1. Xavier RJ, Podolsky DK. Unravelling the pathogenesis of inflammatory bowel disease. Nature. 2007;448(7152):427–434. doi: 10.1038/nature06005. - DOI - PubMed
    1. Jostins L, et al. Host-microbe interactions have shaped the genetic architecture of inflammatory bowel disease. Nature. 2012;491(7422):119–124. doi: 10.1038/nature11582. - DOI - PMC - PubMed
    1. Ostanin DV, et al. T cell transfer model of chronic colitis: concepts, considerations, and tricks of the trade. Am J Physiol Gastrointest Liver Physiol. 2009;296(2):G135–G146. doi: 10.1152/ajpgi.90462.2008. - DOI - PMC - PubMed
    1. Powrie F, Coffman RL, Correa-Oliveira R. Transfer of CD4+ T cells to C.B-17 SCID mice: a model to study Th1 and Th2 cell differentiation and regulation in vivo. . Res Immunol. 1994;145(5):347–353. doi: 10.1016/S0923-2494(94)80198-3. - DOI - PubMed
    1. Strober W, Fuss IJ, Blumberg RS. The immunology of mucosal models of inflammation. Annu Rev Immunol. 2002;20:495–549. doi: 10.1146/annurev.immunol.20.100301.064816. - DOI - PubMed

Publication types

MeSH terms