. 2014 Mar 25;9(3):e92966.
doi: 10.1371/journal.pone.0092966. eCollection 2014.

Depletion of white adipose tissue in cancer cachexia syndrome is associated with inflammatory signaling and disrupted circadian regulation

Affiliations

Depletion of white adipose tissue in cancer cachexia syndrome is associated with inflammatory signaling and disrupted circadian regulation

Maria Tsoli et al. PLoS One. .

Abstract

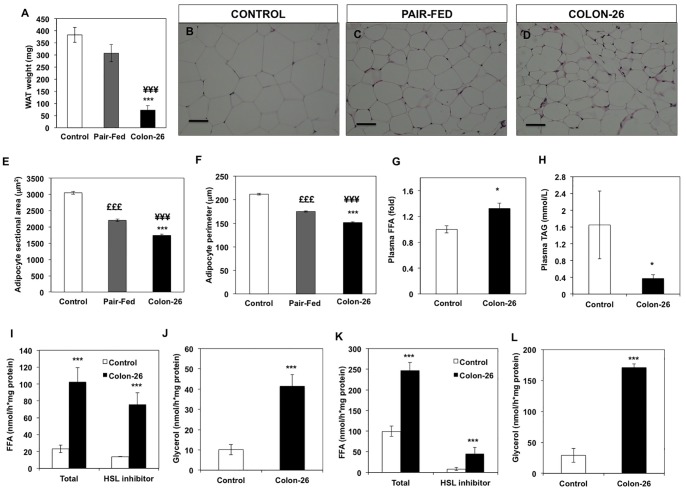
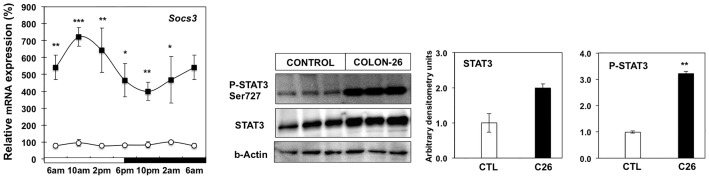
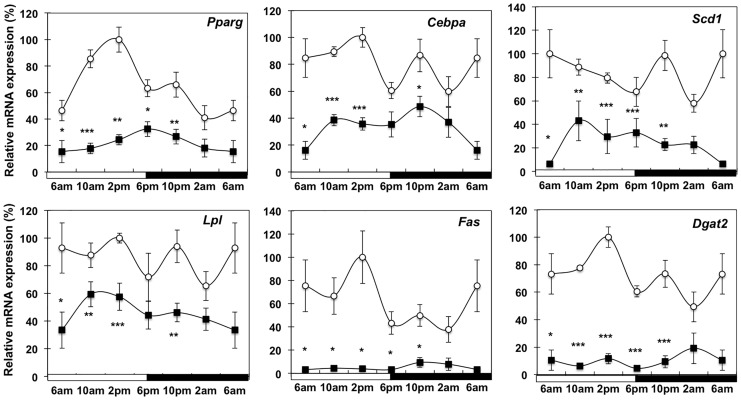
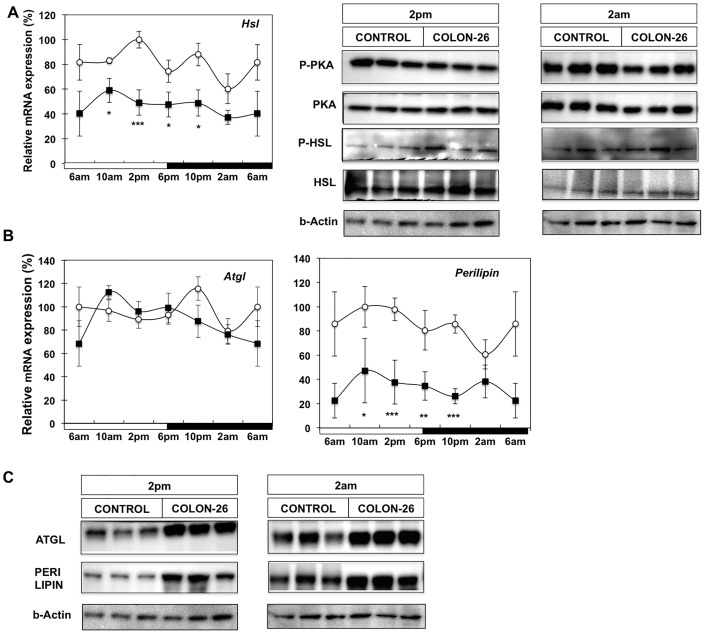
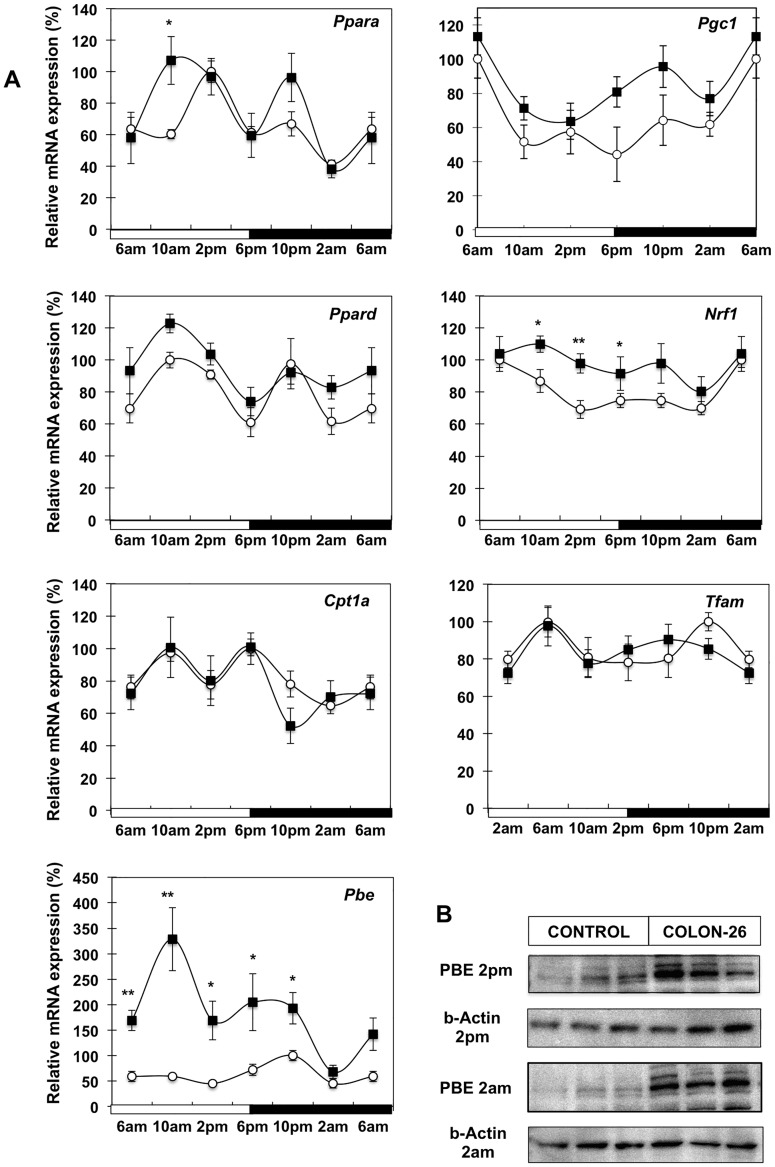
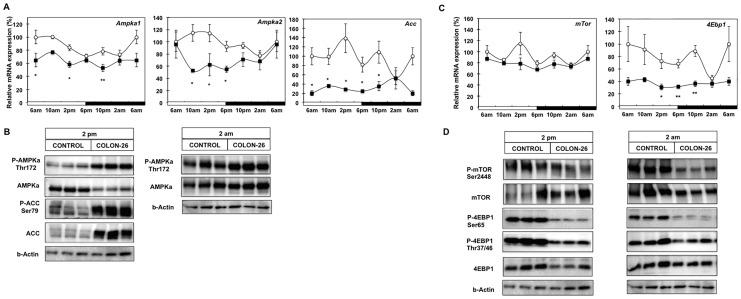
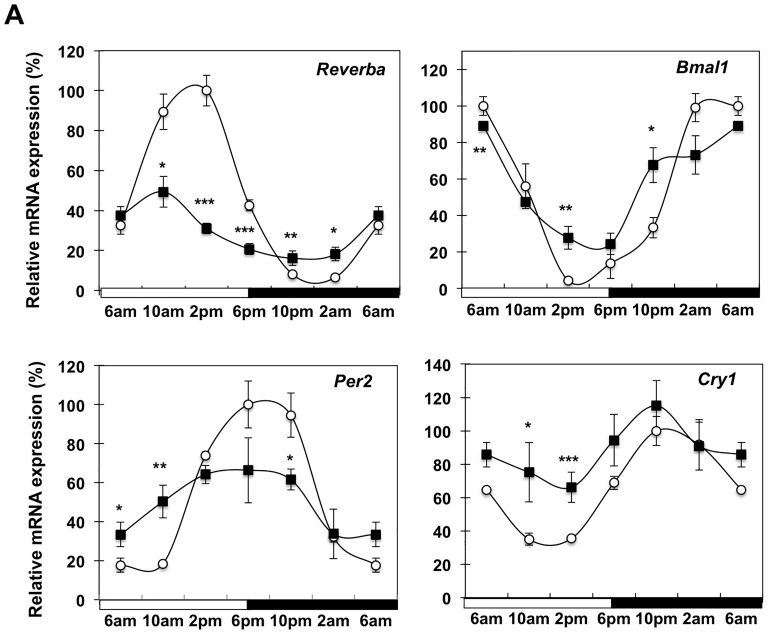
Involuntary weight loss in patients with cancer is the hallmark of cancer cachexia. The etiology of cachexia is multifactorial involving loss of skeletal muscle and adipose tissue associated with high systemic levels of acute phase proteins and inflammatory cytokines. While muscle wasting overtly impacts on cancer patient quality of life, loss of lipid depots represents a sustained energy imbalance. In this study fat depletion was examined in Colon-26 model of cancer cachexia, which is a widely used rodent model of this syndrome. We investigated diurnal expression of circadian rhythm regulators as well as key mediators of energy metabolism and cytokine signaling. Mice bearing the C26 tumour exhibited reduced adipose mass, elevated adipose tissue lipolysis and a 5-fold increase in plasma levels of free fatty acids. These changes were associated with activated IL-6 signaling in WAT through a 3-fold increase in phosphorylated STAT3 and high SOCS3 gene expression levels. In addition perturbations in circadian regulation of lipid metabolism were also observed. Lipid catabolism did not appear to be influenced by the classical PKA pathway activating the lipase HSL. ATGL protein levels were elevated 2-fold in cachectic mice while 4-fold increase phosphorylated ACC and a 2-fold decrease in phosphorylated 4EBP1 was observed indicating that lipid metabolism is modulated by the ATGL & AMPK/mTOR pathways. This study provides evidence for activation of cytokine signaling and concomitant alterations in circadian rhythm and regulators of lipid metabolism in WAT of cachectic animals.


Conflict of interest statement

Competing Interests: Cachectic Colon 26 cells were kindly provided by AMGEN. This does not alter the authors’ adherence to all the PLOS ONE policies on sharing data and materials.

Figures

Figure 1
Figure 1. Organ weight and morphological characteristics of white adipose tissue from cachectic C26 tumour-bearing, ad lib and pair-fed non-tumor bearing control mice.
(A) Epididymal adipose tissue weights from cachectic animals at day 14 after tumour inoculation (***P<0.001, ¥¥¥P<0.001 vs pair-fed); (C–E) Hematoxylin and eosin staining and (B–F) quantification of adipocyte size from cachectic and pair-fed mice. (G) Circulating levels of non-esterified free fatty acids in plasma of cachectic animals (*P<0.05; vs control); (H, I) Free fatty acid (FFA) and glycerol release from WAT explants obtained from control and C26 tumour-bearing mice under basal conditions in the presence and in the absence of the HSL inhibitor Hi 76–0079; (J, K) Free fatty acid (FFA) and glycerol release from WAT explants under forskolin stimulated conditions in the presence or in the absence of Hi- 76–0079. For A, values are presented as mean ± s.e.m. for 8–10 animals per group. For B, C and D representative images are shown from H&E images taken from 4 animals per group. For E and F values are presented as as mean ± s.e.m. for 4 animals per group. Approximately 250 adipocytes were counted per animal giving in total 1000 adipocytes from each group. G and H values are presented as mean ± s.e.m. for 4 animals per group. For I–K values are presented as mean ± s.e.m. for 5 animals per group.
Figure 2
Figure 2. Activation of IL-6 signaling pathway in C26-bearing mice.
Diurnal mRNA expression of SOCS3 mRNA in white adipose tissue from control mice (white circle) and cachectic mice (black square) (*P<0.05, **P<0.01, ***P<0.001 vs control). 6 am values are duplicated in the graph to illustrate diurnal rhythmicity. mRNA expression values are mean ± s.e.m. relative to controls for 4–6 animals per group. Western blot and densitometric analysis of STAT3 protein and phospho-STAT3 (Ser727), in white adipose tissue from cachectic and control animals.
Figure 3
Figure 3. Expression of genes involved in lipid biosynthesis pathway in white adipose tissue during cancer cachexia.
mRNA analysis of Pparγ, C/ebpα, Lpl, Fas, Scd1, Dgat2, isolated from WAT of control (white circle), and C26-bearing mice (black square); Values are mean ± s.e.m. presented as percentages relative to the controls for 4–5 animals per group (*P<0.05; **P<0.01; ***P<0.001 C26 vs control). 6 am values are duplicated in each graph to illustrate a complete 24-h cycle.
Figure 4
Figure 4. Lipolytic pathway in WAT of cachectic animals.
(A) mRNA analysis of Hsl gene expression and Western blot analysis of phospho-PKA (Thr197), total PKA, phospho-HSL and total HSL proteins at 2 am and 2 pm; (B) mRNA analysis of Atgl and Perilipin gene expression from WAT of control (white circle), and C26 tumour-bearing mice (black square); Values are mean ± s.e.m. presented as percentages relative to the controls for 4–5 animals per group (*P<0.05; **P<0.01; ***P<0.001, C26 vs control). 6 am values are duplicated in each graph to illustrate a complete 24-h cycle; (C) Western blot analysis of ATGL and PERILIPIN proteins at 2 pm and 2 am.
Figure 5
Figure 5. Diurnal expression of genes in lipid utilization pathways in cachectic mice.
(A) mRNA analysis of Pparα, Pgc1α, Pparδ, Nrf1, Tfam, Cpt1α and Pbe from WAT of control (white circle) and C26 tumour -bearing mice (black square); Values are mean ± s.e.m. presented as percentages relative to the controls for 4–5 animals per group (*P<0.05; **P<0.01; C26 vs control). 6 am values are duplicated in each graph to illustrate a complete 24-h cycle; (B) Western blot analysis of PBE protein at 2 pm and 2 am time points.
Figure 6
Figure 6. Involvement of AMPK and mTOR/4EBP1 signaling pathways in cancer cachexia.
(A) mRNA analysis of Ampkα1, Ampkα2 and Acc from WAT of control (white circle), and C26-bearing mice (black square); (B) Western blot analysis of phospho-AMPK (Thr192) and total AMPK at 2 pm and 2 am; Immunoblot analysis of Phospho-ACC and total ACC for 2 pm WAT samples. (C) mRNA analysis of mTor and 4Ebp1; from WAT of control (white circle), and C26-bearing mice (black square); (D) Western blot analysis of phospho-mTOR (Ser2448) total mTOR, phospho-4EBP1 (Ser65), phospho-4EBP1 (Thr37/46) and total 4EBP1 at 2 pm and 2 am. Values are mean ± s.e.m. presented as percentages relative to the controls for 4–5 animals per group (*P<0.05; **P<0.01; C26 vs control). 6 am values are duplicated in each graph to illustrate a complete 24-h cycle.
Figure 7
Figure 7. Expression of core clock genes in white adipose tissue during cancer cachexia.
mRNA analysis of Rev-erbα, Bmal, Per2 and Cry1 isolated from WAT of control (white circle), and C26-bearing mice (black square); Values are mean ± s.e.m. presented as percentages relative to the controls for 4–5 animals per group (*P<0.05; **P<0.01; ***P<0.001 C26 vs control). 6 am values are duplicated in each graph to illustrate a complete 24-h cycle.

References

    1. Bruera E (1997) ABC of palliative care. Anorexia, cachexia, and nutrition. Br Med J 315: 1219–1222. - PMC - PubMed
    1. Palesty JA, Dudrick SJ (2003) What we have learned about cachexia in gastrointestinal cancer. Dig Dis 21: 198–213. - PubMed
    1. Richards CH, Roxburgh CS, MacMillan MT, Isswiasi S, Robertson EG, et al. (2012) The relationships between body composition and the systemic inflammatory response in patients with primary operable colorectal cancer. PLoS One 7: e41883. - PMC - PubMed
    1. Argiles JM, Almendro V, Busquets S, Lopez-Soriano FJ (2004) The pharmacological treatment of cachexia. Curr Drug Targets 5: 265–277. - PubMed
    1. Dewys WD, Begg C, Lavin PT, Bennet PR, Bertino JR (1980) Prognostic effect of weight loss prior to chemotherapy in cancer patients. Am J Med 69: 491–497. - PubMed

Publication types

MeSH terms

LinkOut - more resources