. 2014 Mar 25;12(3):e1001823.
doi: 10.1371/journal.pbio.1001823. eCollection 2014 Mar.

In vivo time-resolved microtomography reveals the mechanics of the blowfly flight motor

Affiliations

In vivo time-resolved microtomography reveals the mechanics of the blowfly flight motor

Simon M Walker et al. PLoS Biol. .

Abstract

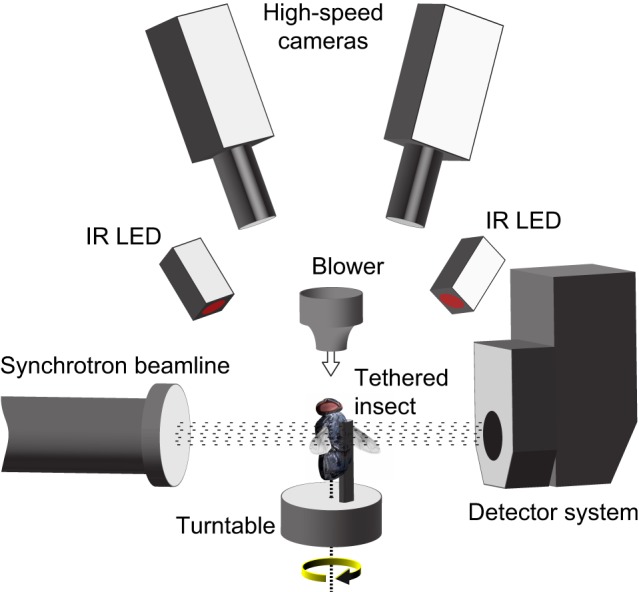
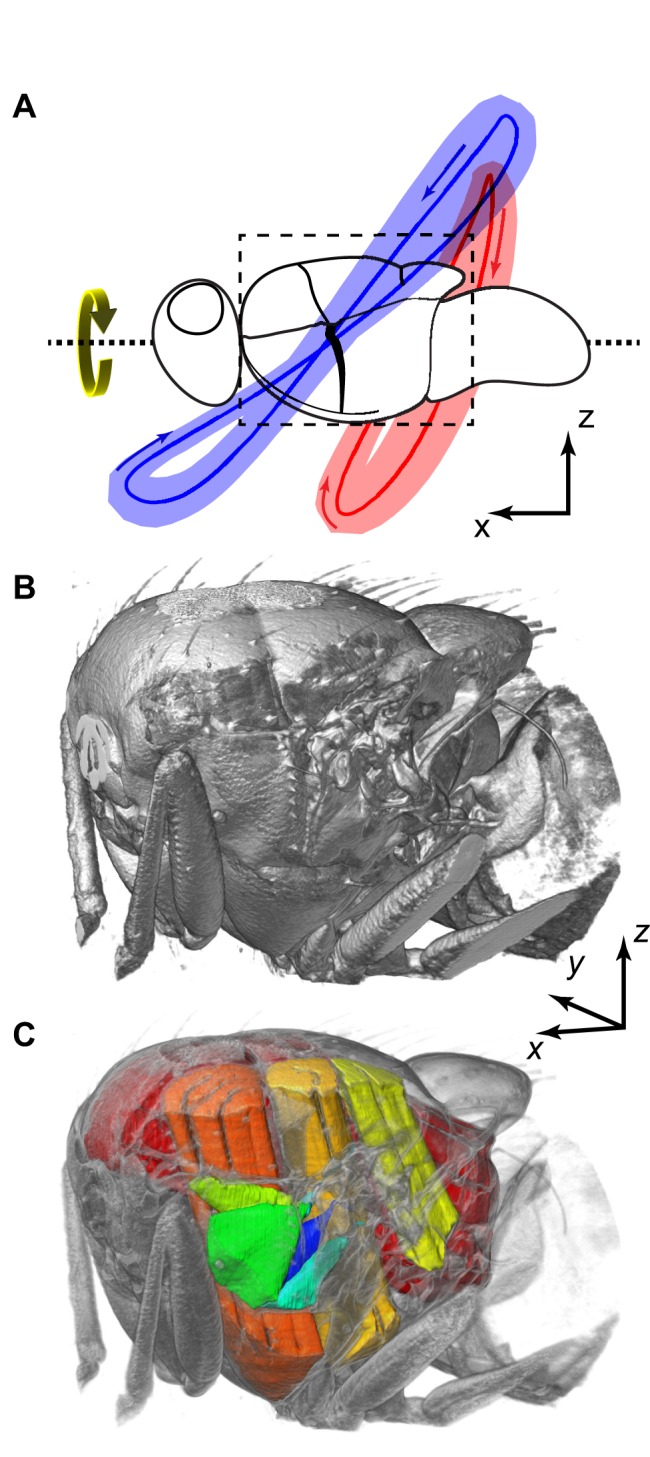
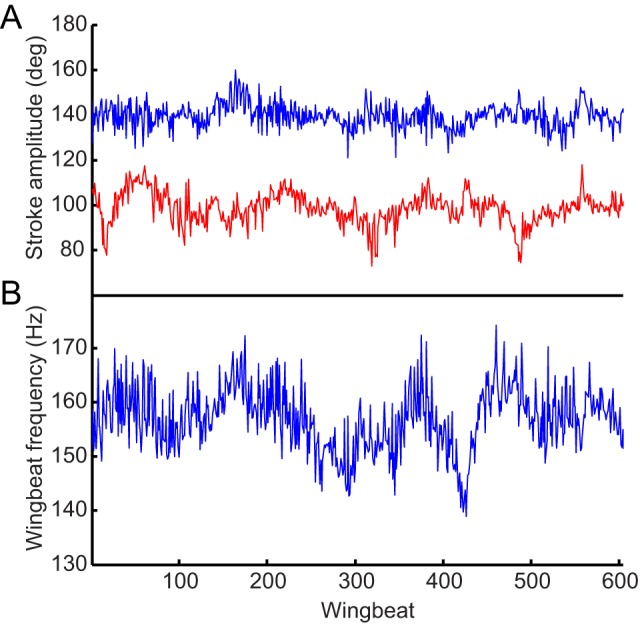
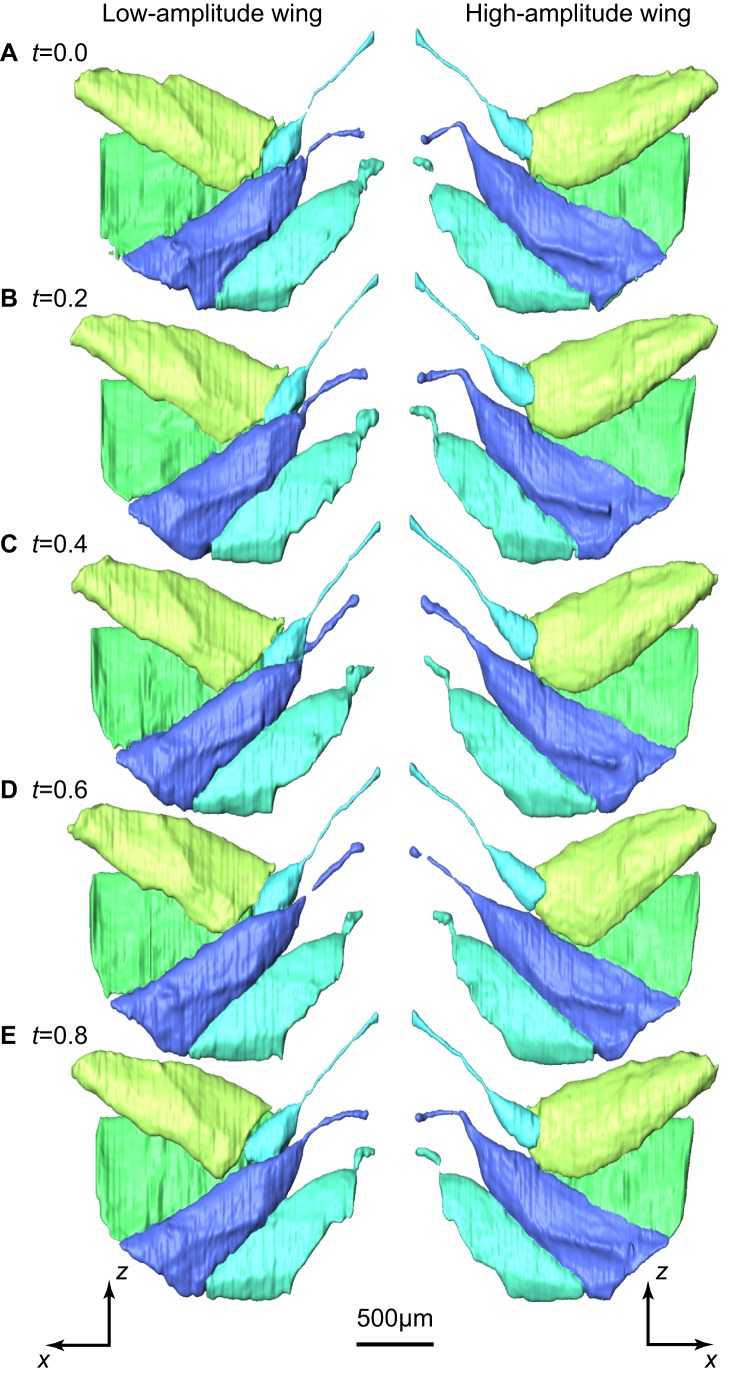
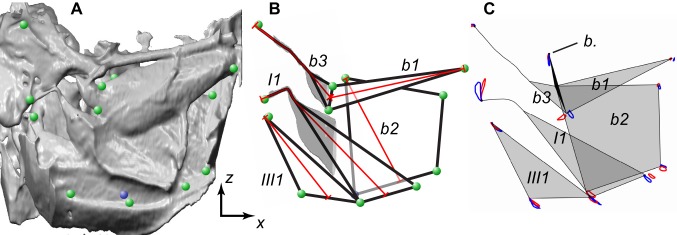
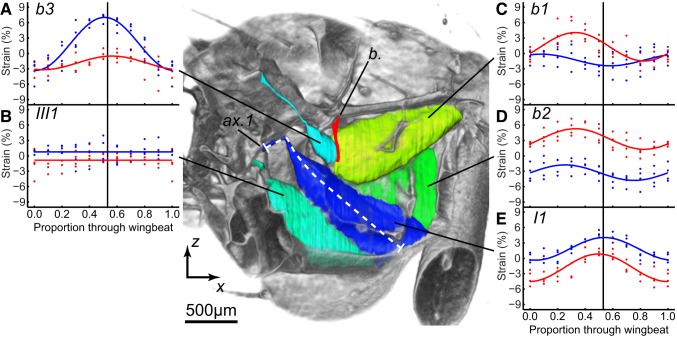
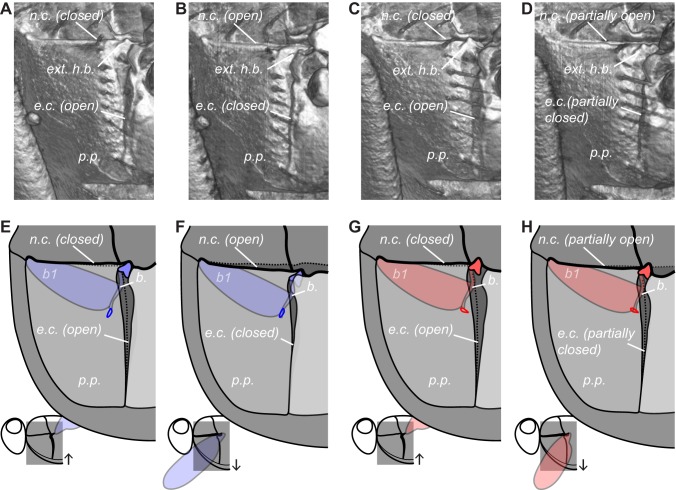
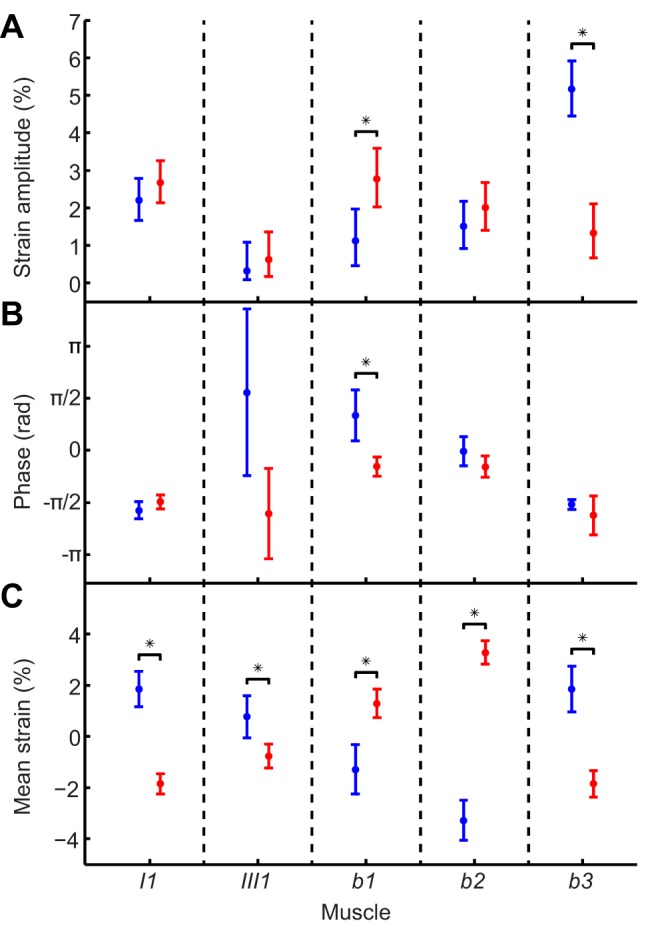
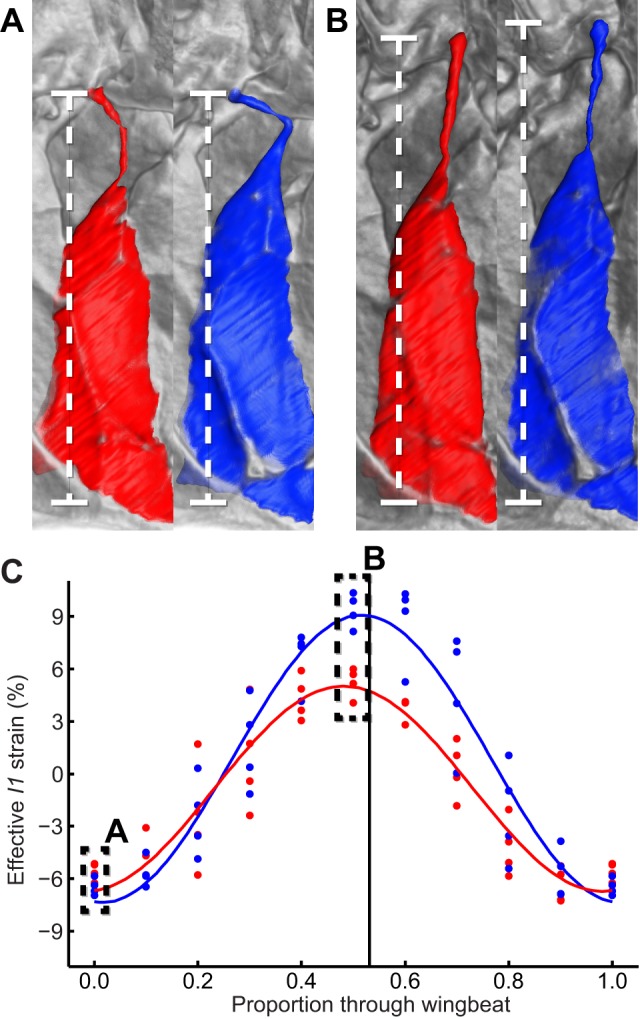
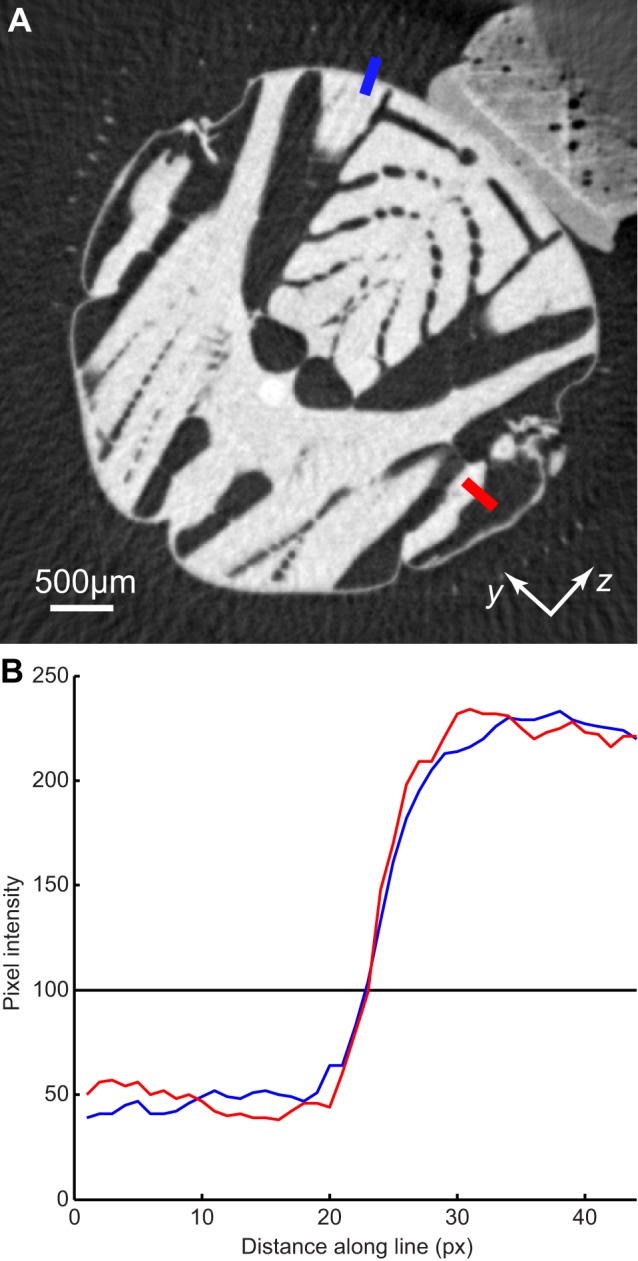
Dipteran flies are amongst the smallest and most agile of flying animals. Their wings are driven indirectly by large power muscles, which cause cyclical deformations of the thorax that are amplified through the intricate wing hinge. Asymmetric flight manoeuvres are controlled by 13 pairs of steering muscles acting directly on the wing articulations. Collectively the steering muscles account for <3% of total flight muscle mass, raising the question of how they can modulate the vastly greater output of the power muscles during manoeuvres. Here we present the results of a synchrotron-based study performing micrometre-resolution, time-resolved microtomography on the 145 Hz wingbeat of blowflies. These data represent the first four-dimensional visualizations of an organism's internal movements on sub-millisecond and micrometre scales. This technique allows us to visualize and measure the three-dimensional movements of five of the largest steering muscles, and to place these in the context of the deforming thoracic mechanism that the muscles actuate. Our visualizations show that the steering muscles operate through a diverse range of nonlinear mechanisms, revealing several unexpected features that could not have been identified using any other technique. The tendons of some steering muscles buckle on every wingbeat to accommodate high amplitude movements of the wing hinge. Other steering muscles absorb kinetic energy from an oscillating control linkage, which rotates at low wingbeat amplitude but translates at high wingbeat amplitude. Kinetic energy is distributed differently in these two modes of oscillation, which may play a role in asymmetric power management during flight control. Structural flexibility is known to be important to the aerodynamic efficiency of insect wings, and to the function of their indirect power muscles. We show that it is integral also to the operation of the steering muscles, and so to the functional flexibility of the insect flight motor.


Conflict of interest statement

The authors have declared that no competing interests exist.

Figures

Figure 1
Figure 1. Schematic diagram of the experimental setup, showing the direction of the wind stimuli (white arrow) and rotational stimuli (yellow arrow).
Figure 2
Figure 2. Overview.
(A) Mean (red/blue lines) and standard deviation (red/blue shading) of wing tip position through all of the wingbeats of all four flies, showing differences in wing tip path between the left, high-amplitude (blue) and right, low-amplitude (red) wings. The arrows indicate the direction of the wings' movement. (B) External visualization of the thorax, covering the region outlined in (A). (C) Cutaway visualization of the thorax showing the five steering muscles analysed (green to blue) and the power muscles (yellow to red). Movie S1 provides an animated overview of the movements of these muscles (view Movie S1 here).
Figure 3
Figure 3. Wing kinematic parameters for one fly over entire recording period.
(A) Stroke amplitude for the left (blue) and right (red) wings. (B) Wingbeat frequency, calculated as the mean of both wings.
Figure 4
Figure 4. Three-dimensional surface renderings of five of the direct steering muscles in the low-amplitude (left column) and high-amplitude (right column) wings.
Five of the ten stages of the wingbeat cycle are shown for one individual, starting at the beginning of the downstroke. The times (t) marked on each panel denote the proportion of the time through the wingbeat cycle. The steering muscles are viewed from the inside of the thorax looking out toward the wing hinge, and other parts of the thorax have been removed for clarity. See main text and Figure 6 for labeling of muscles, which follows the same colour scheme. Note the asymmetries in the buckling of the I1 tendon (dark blue) at the start of the stroke. The asymmetries in the movements of the other steering muscle are almost imperceptible in this figure, but they are clearly visible in the accompanying animation of all ten stages of the wingbeat cycle in Movie S2 (view Movie S2 here). The muscles and tendons were segmented manually. Note, however, that the small diameter and fast movement of the tendons leads to occasional data dropout (e.g., I1 tendon at t = 0.6).
Figure 5
Figure 5. Measurements of muscle strains.
(A) Three-dimensional surface rendering showing the internal view of the left steering muscles (high-amplitude wing). The steering muscles are viewed from the inside of the thorax looking out toward the wing hinge. The green circles indicate the endpoints of the muscles that were tracked. The blue circle shows the ventral base of b2, which is hidden from view behind the I1 and III1 muscles. A clipping plane was used to remove these muscles so that the base of b2 was visible and could be tracked. (B) Schematic showing approximate shape of the five steering muscles (black lines) and the lines along which the muscle lengths were calculated (red lines). The grey shaded regions of I1 and b3 show where 3D skeletonization was used to find the centre line of the tendons to take buckling into account. (C) Diagram showing the movements of the endpoints of the steering muscles for the high-amplitude (blue orbits) and low-amplitude (red orbits) wings, averaged across flies. The view shown here corresponds to that in (C), with data for the other wing mirrored about the sagittal plane and overlain. The schematic representations of the muscles (shaded grey) and tendons (black lines) indicate the mean posture of the muscles at the start of the downstroke. b., basalare sclerite (filled black).
Figure 6
Figure 6. Cutaway visualization of the steering muscles and measured strains.
Cutaway visualization of the steering muscles, looking out toward the wing hinge, with graphs of their measured strains (blue, high-amplitude wing; red, low-amplitude wing). The data points plot the strains measured for each individual fly (n = 4) at every stage of the wingbeat, starting at the beginning of the downstroke. The fitted curves are simple harmonic functions, except in the case of III1, which showed no significant time-periodic strain. Black vertical lines indicate the mean timing of the start of the upstroke. The strain in I1 was measured along a line running down the middle of the muscle and its tendon (white dashed line) to take account of buckling. Movie S2 animates this view through the wingbeat for both wings. b., basalare sclerite (filled red); ax.1, first axillary sclerite. Movie S2 can be viewed here.
Figure 7
Figure 7. Movements of the basalare sclerite and pleural plate.
External visualizations (A–D) and schematics (E–H) of the section of thorax indicated on the inset diagrams for the high-amplitude wing (A,B,E,F) and the low-amplitude wing (C,D,G,H). (A,C,E,G) Start of the downstroke. (B,D,F,H) Start of the upstroke. The pleural plate rotates as the thorax deforms through the wingbeat, causing oscillations of the basalare sclerite, which articulates with it. The small blue (high-amplitude) and red (low-amplitude) loops in (E–H) plot the path of the tip of the internal arm of the basalare sclerite, which oscillates rotationally on the low-amplitude wing and translationally on the high-amplitude wing. Movie S3 animates the external views of these movements through the wingbeat. b., basalare sclerite; b1, first muscle of the basalare sclerite; e.c., episternal cleft; ext. h.b., external head of the basalare sclerite; n.c., notopleural cleft; p.p., pleural plate. Movie S3 can be viewed here.
Figure 8
Figure 8. Statistical analysis of steering muscle asymmetries.
95% confidence intervals computed for: (A) amplitude of oscillatory muscle strain, (B) phase of oscillatory muscle strain, relative to start of the downstroke; (C) mean muscle strain. Vertical bars denote 95% confidence intervals; points denote actual parameter estimate. Non-overlapping 95% confidence intervals are starred to indicate the statistically significant differences between the high-amplitude (blue) and low-amplitude (red) wings.
Figure 9
Figure 9. Buckling of the I1 tendon.
(A, B) Visualizations of the I1 muscle at the start and end of the downstroke, respectively. The tendon is buckled on both wings at the start of the downstroke (A) but has been pulled straight by the end of the downstroke (B). Each panel compares the state of I1 on the high-amplitude (blue) and low-amplitude (red) wing. (C) effective strain measured along the straight line joining the attachment points of I1 (dashed line). Comparing the amplitude of this effective strain with the amplitude of the actual I1 muscle strain in Figure 6F shows that the buckling tendon accommodates a 4-fold enhancement in the range of movement of the first axillary sclerite on the high-amplitude wing.
Figure 10
Figure 10. Edge detail of two parts of the thorax.
(A) Tomogram showing transverse section of the thorax, with the mount visible in the upper right of the image. The blue line cuts through the scutum, which is a rigid part of the thorax that did not move measurably during recordings. The red line cuts through the steering muscles, which oscillate at wingbeat frequency. (B) Pixel intensities along the two lines indicated in (A). Edge sharpness, as measured by the steepness of the change in pixel intensity along each line, is essentially identical for the scutum and the steering muscles. This indicates that the position of the steering muscles must have been consistent between wingbeats, at the phase of the wingbeat shown here, which indicates that the steering muscle kinematics did not vary measurably between wingbeats.

Comment in

  • How insect flight steering muscles work.
    Hedenström A. Hedenström A. PLoS Biol. 2014 Mar 25;12(3):e1001822. doi: 10.1371/journal.pbio.1001822. eCollection 2014 Mar. PLoS Biol. 2014. PMID: 24667632 Free PMC article.

References

    1. Bomphrey RJ, Walker SM, Taylor GK (2009) The typical flight performance of blowflies: measuring the normal performance envelope of Calliphora vicina using a novel corner-cube arena. PLoS One 4: e7852. - PMC - PubMed
    1. Pringle JWS (1957) Insect flight. Cambridge: Cambridge University Press.
    1. Dickinson MH, Tu MS (1997) The function of dipteran flight muscle. Comp Biochem Physiol A 116: 223–238.
    1. Heide G (1983) Neural mechanisms of flight control in Diptera. Nachtigall W, editor. BIONA Report 2: Insect flight II. Stuttgart: Fischer. pp. 35–52.
    1. Smyth T (1966) Yurkiewi.Wj (1966) Visual reflex control of indirect flight muscles in the sheep blowfly. Comp Biochem Physiol 17: 1175–1180.

Publication types

LinkOut - more resources