. 2014 Mar 25;9(3):e92390.
doi: 10.1371/journal.pone.0092390. eCollection 2014.

Limitations of the spike-triggered averaging for estimating motor unit twitch force: a theoretical analysis

Affiliations

Limitations of the spike-triggered averaging for estimating motor unit twitch force: a theoretical analysis

Francesco Negro et al. PLoS One. .

Erratum in

  • PLoS One. 2014;9(6):e101614. Yavuz, Utku Ş [corrected to Yavuz, Ş Utku]

Abstract

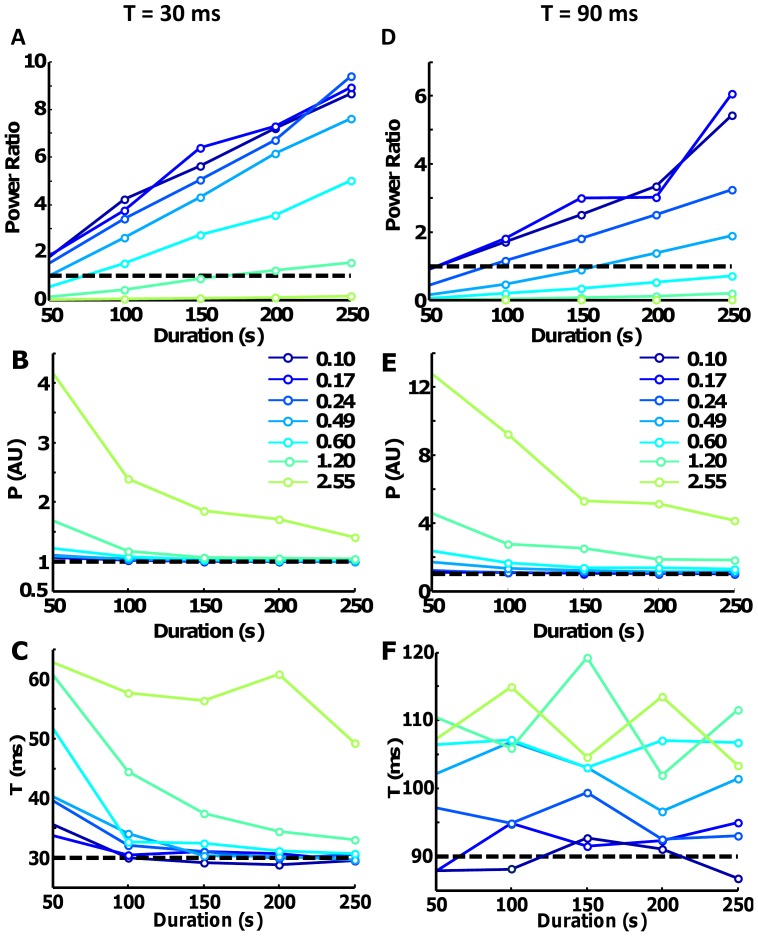
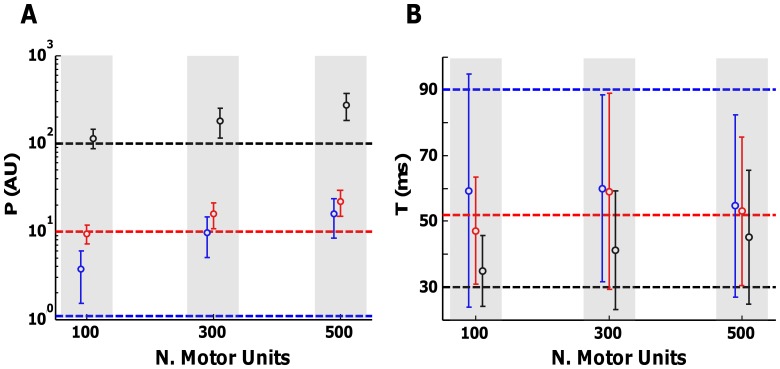
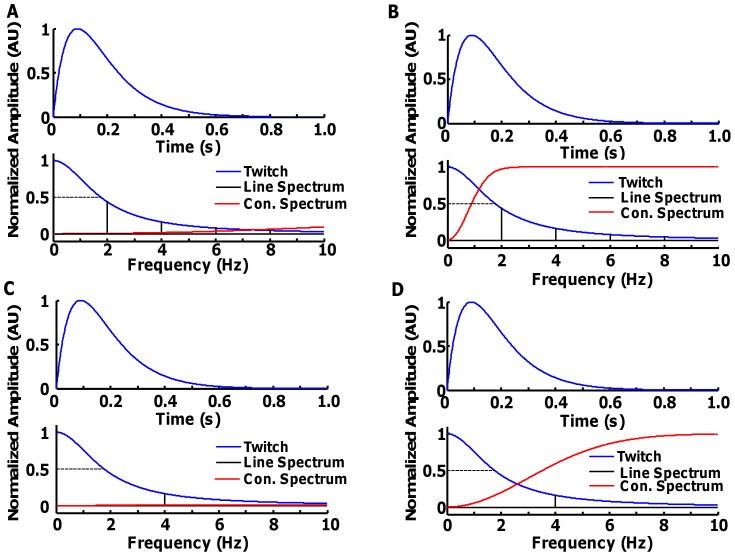
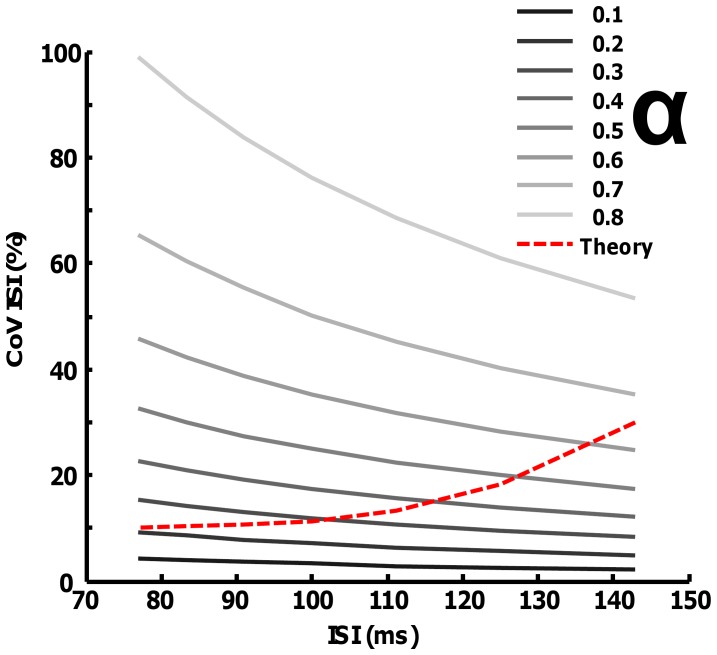
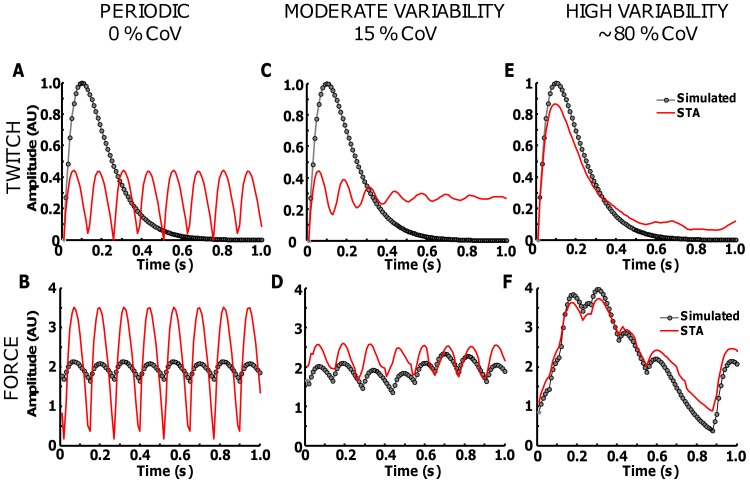
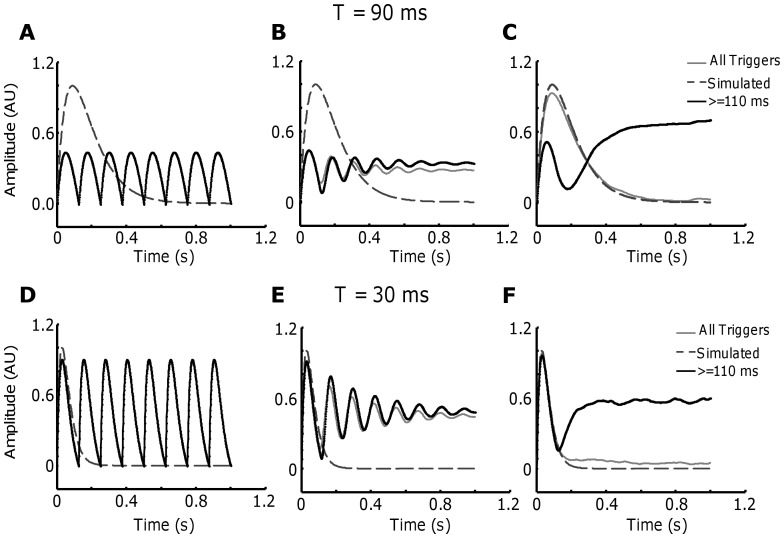
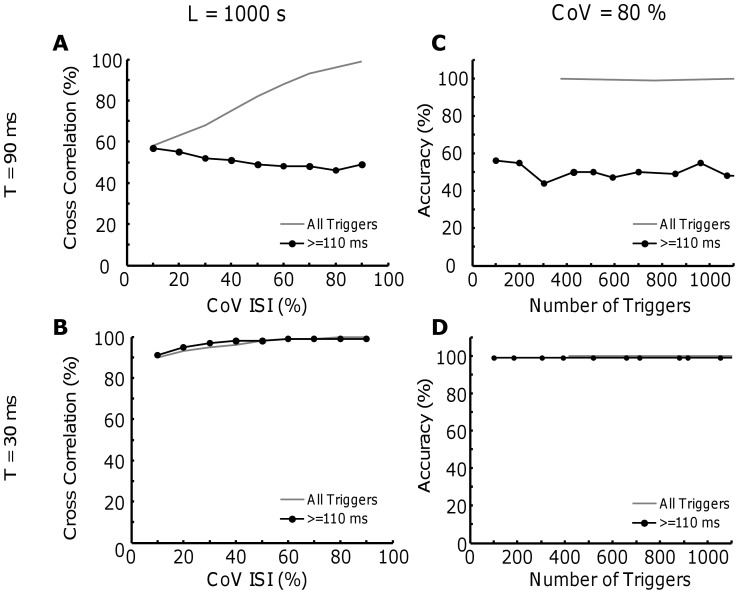
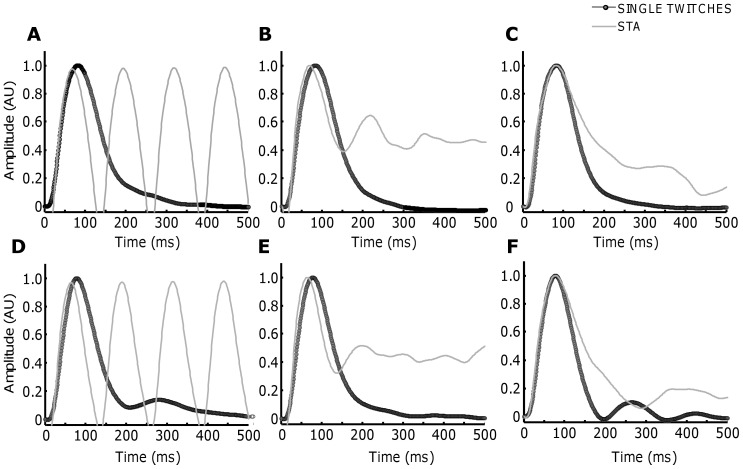
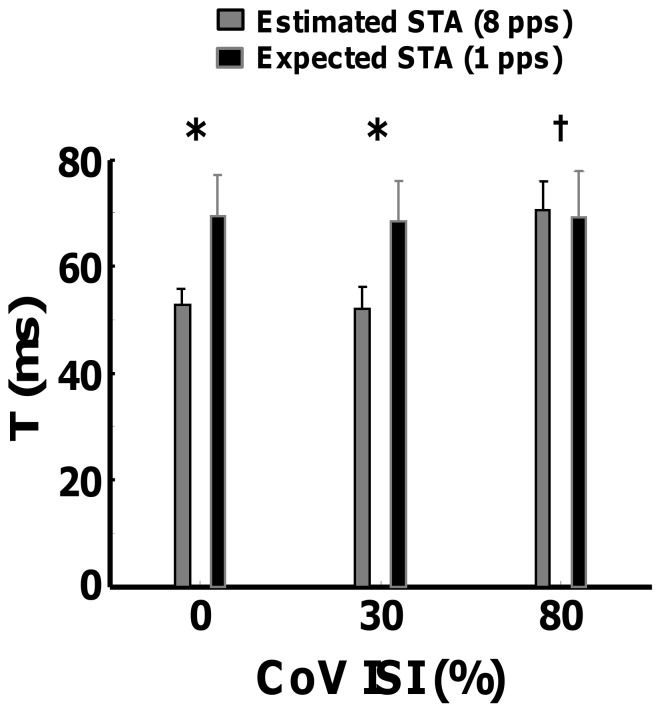
Contractile properties of human motor units provide information on the force capacity and fatigability of muscles. The spike-triggered averaging technique (STA) is a conventional method used to estimate the twitch waveform of single motor units in vivo by averaging the joint force signal. Several limitations of this technique have been previously discussed in an empirical way, using simulated and experimental data. In this study, we provide a theoretical analysis of this technique in the frequency domain and describe its intrinsic limitations. By analyzing the analytical expression of STA, first we show that a certain degree of correlation between the motor unit activities prevents an accurate estimation of the twitch force, even from relatively long recordings. Second, we show that the quality of the twitch estimates by STA is highly related to the relative variability of the inter-spike intervals of motor unit action potentials. Interestingly, if this variability is extremely high, correct estimates could be obtained even for high discharge rates. However, for physiological inter-spike interval variability and discharge rate, the technique performs with relatively low estimation accuracy and high estimation variance. Finally, we show that the selection of the triggers that are most distant from the previous and next, which is often suggested, is not an effective way for improving STA estimates and in some cases can even be detrimental. These results show the intrinsic limitations of the STA technique and provide a theoretical framework for the design of new methods for the measurement of motor unit force twitch.


Conflict of interest statement

Competing Interests: The authors have declared that no competing interests exist.

Figures

Figure 1
Figure 1. Influence of spike train correlation in the STA estimation.
100 motor unit spike trains were simulated with an average discharge rate of 2∼80%. P was set to 1 and T to 30 (Fig. 1A–C) and 90 ms (Fig. 1D–F) for all units. A–D. The power ratio between the two terms of Eq. 6 is plotted as a function of the duration of the signal used for the calculation and for different levels of synchronization between the simulated spike trains. Each point represents the average of 100 simulations. The synchronization levels (CIS index) were reported at a discharge rate of 8 pps to be comparable with previously reported data in humans. B–E. Similar graphs for estimated values of P and (C–F) T extracted from the STA calculations.
Figure 2
Figure 2. Variability in the STA estimations with different number of motor units active.
Simulations were performed with 100, 300 and 500 motor units. The parameters of the twitches were distributed according to an exponential law. Discharge rates and CoV for ISI were fixed at 8% respectively for all motor units. The simulated synchronization level was fixed to have CIS = 0.6 pps. In one case, an intermediate contraction level was simulated in order to have half of the motor units in each pool active. In this scenario, the twitch of the first (blue) and the last (red) recruited motor unit was estimated. In a second case, all motor units were active and the twitch of the last recruited motor unit was estimated. The simulated values are represented with a dashed line. A. Estimations of peak amplitude P in AU. B. Values of time-to-peak T in ms.
Figure 3
Figure 3. Sampling of the motor unit twitch with different discharge rates and variabilities.
The simulated twitch waveform had P = 1 and T = 90 ms (upper plots). A. Period spike train with average discharge rate of 2 pps. B. Same as before but with CoV of approximately 20%. C. Periodic spike train of 4 pps. D. Same as before, with CoV for ISI of 20%.
Figure 4
Figure 4. Reconstruction accuracy for different values of ISI and CoV (Eq. A10).
The lines for different values of α are plotted as a function of ISI and CoV for ISI (grey lines). An approximation of the relation between ISI and CoV ISI that is usually found in humans was superimposed (red dashed line) for comparison.
Figure 5
Figure 5. Effect of variability on the twitch fusion when the STA technique is applied.
A spike train with DR of 8(0%, 15% and ∼80%) was simulated. The original twitch waveform was simulated with P = 1 and T = 90 ms (grey line in all plots). The STA estimation are shown on the upper plots with red lines. The plots on the bottom show the original force profiles (grey) and the reconstructed force with the estimated STA (red lines).
Figure 6
Figure 6. Effect of the selection of the triggers.
The twitch waveform has P = 1 and the discharge rate was selected to 8 pps as before. A. Original twitch waveform (blue) with T = 90 ms and estimated twitch with the original (grey) and modified (black) method. B. Similar with CoV for ISI of 15% and ∼80% (C). The estimation for the case with T = 30 ms are reported on the bottom (D, E and F).
Figure 7
Figure 7. Conseguence of variability and total number of triggers for the estimation of motor unit twitch performed with the original or modified version of the STA technique.
A. The cross correlation between the original twitch waveform (P = 1 and T = 90 ms) and the estimation performed with the standard STA technique (black line) or the modified one (pointed line) when the CoV is varied between 10 and ∼80%. B. similar results for T = 30 ms. C. In this case, the CoV for ISI is maintained very high (∼80%), but the number of triggers is increased (T = 90 ms). D. Similar results for the case with T = 30 ms.
Figure 8
Figure 8. Experimental results performed with stimulation of the FDI muscle subject one (A,B and C) and subject two (D, E and F).
Similar as the simulations results, the discharge rate was fixed at 8(black lines). A. Periodic discharge pattern. B. CoV of ∼30%. C. CoV of ∼80%. Similar results are reported for the second subject (D, E and F).
Figure 9
Figure 9. The estimated values of time-to-peak T as a function of the imposed CoV for ISI, averaged across all subjects.
Expected (estimation performed as an average of the five pulses generated at the beginning of each trial) and estimated (STA performed in the following 30 s) are shown. T-test analysis was performed for each pair of expected and estimated set of values. *significant at p<0.05.

Similar articles

Cited by

References

    1. Heckman C, Enoka RM (2004) Physiology of the motor neuron and the motor unit. Handbook of Clinical Neurophysiology 4: 119–147.
    1. Fuglevand aJ, Winter Da, Patla aE (1993) Models of recruitment and rate coding organization in motor-unit pools. Journal of neurophysiology 70: 2470–2488. - PubMed
    1. Heckman C, Enoka RM (2012) Motor unit. Comprehensive Physiology. - PubMed
    1. Burke RE (1967) Motor unit types of cat triceps surae muscle. The Journal of physiology 193: 141–160. - PMC - PubMed
    1. Roatta S, Arendt-Nielsen L, Farina D (2008) Sympathetic-induced changes in discharge rate and spike-triggered average twitch torque of low-threshold motor units in humans. The Journal of physiology 586: 5561–5574. - PMC - PubMed

Publication types

LinkOut - more resources