

Haplotype differences for copy number variants in the 22q11.23 region among human populations: a pigmentation-based model for selective pressure
- PMID: 24667780
- PMCID: PMC4266733
- DOI: 10.1038/ejhg.2014.47
Haplotype differences for copy number variants in the 22q11.23 region among human populations: a pigmentation-based model for selective pressure
Abstract
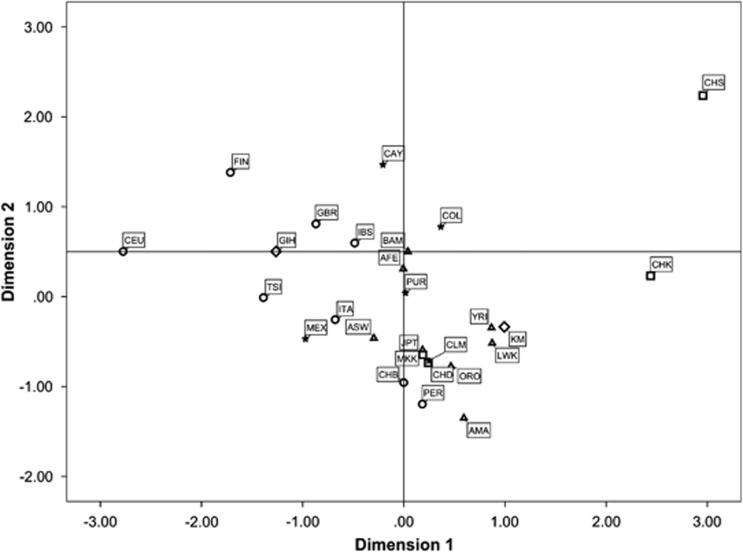
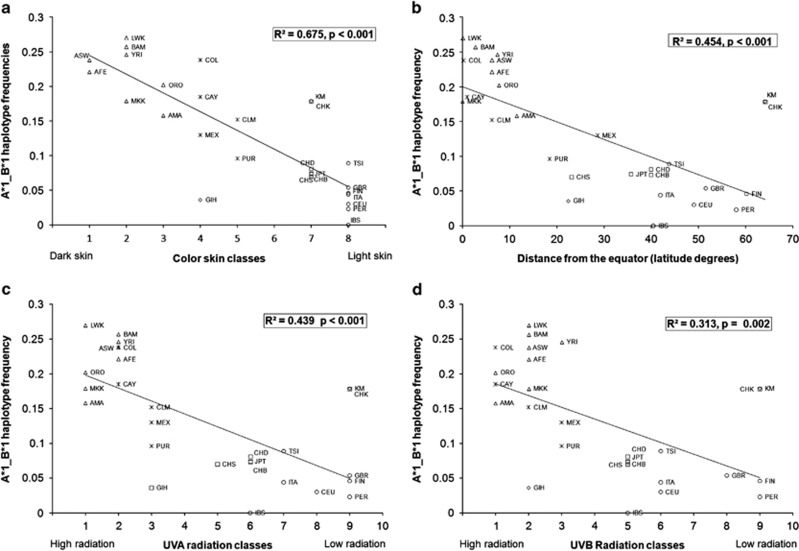
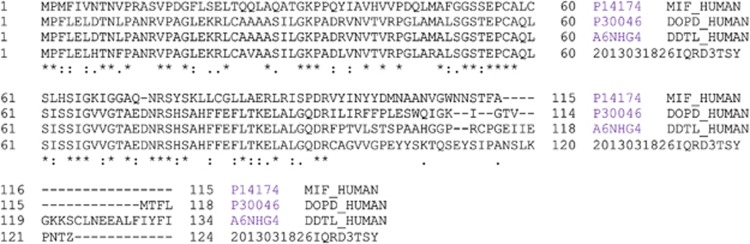
Two gene clusters are tightly linked in a narrow region of chromosome 22q11.23: the macrophage migration inhibitory factor (MIF) gene family and the glutathione S-transferase theta class. Within 120 kb in this region, two 30-kb deletions reach high frequencies in human populations. This gives rise to four haplotypic arrangements, which modulate the number of genes in both families. The variable patterns of linkage disequilibrium (LD) between these copy number variants (CNVs) in diverse human populations remain poorly understood. We analyzed 2469 individuals belonging to 27 human populations with different ethnic origins. Then we correlated the genetic variability of 22q11.23 CNVs with environmental variables. We confirmed an increasing strength of LD from Africa to Asia and to Europe. Further, we highlighted strongly significant correlations between the frequency of one of the haplotypes and pigmentation-related variables: skin color (R(2)=0.675, P<0.001), distance from the equator (R(2)=0.454, P<0.001), UVA radiation (R(2)=0.439, P<0.001), and UVB radiation (R(2)=0.313, P=0.002). The fact that all MIF-related genes are retained on this haplotype and the evidences gleaned from experimental systems seem to agree with the role of MIF-related genes in melanogenesis. As such, we propose a model that explains the geographic and ethnic distribution of 22q11.23 CNVs among human populations, assuming that MIF-related gene dosage could be associated with adaptation to low UV radiation.
Figures
Similar articles
-
Extensive Ethnic Variation and Linkage Disequilibrium at the FCGR2/3 Locus: Different Genetic Associations Revealed in Kawasaki Disease.Front Immunol. 2019 Mar 21;10:185. doi: 10.3389/fimmu.2019.00185. eCollection 2019. Front Immunol. 2019. PMID: 30949161 Free PMC article.
-
Genotype, haplotype and copy-number variation in worldwide human populations.Nature. 2008 Feb 21;451(7181):998-1003. doi: 10.1038/nature06742. Nature. 2008. PMID: 18288195
-
Complete haplotype sequence of the human immunoglobulin heavy-chain variable, diversity, and joining genes and characterization of allelic and copy-number variation.Am J Hum Genet. 2013 Apr 4;92(4):530-46. doi: 10.1016/j.ajhg.2013.03.004. Epub 2013 Mar 28. Am J Hum Genet. 2013. PMID: 23541343 Free PMC article.
-
An Evolutionary Perspective on the Impact of Genomic Copy Number Variation on Human Health.J Mol Evol. 2020 Jan;88(1):104-119. doi: 10.1007/s00239-019-09911-6. Epub 2019 Sep 14. J Mol Evol. 2020. PMID: 31522275 Review.
-
Copy number variation at 22q11.2: from rare variants to common mechanisms of developmental neuropsychiatric disorders.Mol Psychiatry. 2013 Nov;18(11):1153-65. doi: 10.1038/mp.2013.92. Epub 2013 Aug 6. Mol Psychiatry. 2013. PMID: 23917946 Free PMC article. Review.
Cited by
-
Genetic diversity of disease-associated loci in Turkish population.J Hum Genet. 2015 Apr;60(4):193-8. doi: 10.1038/jhg.2015.8. Epub 2015 Feb 26. J Hum Genet. 2015. PMID: 25716910
-
Higher prevalence of homologous recombination deficiency in tumors from African Americans versus European Americans.Nat Cancer. 2020 Jan;1(1):112-121. doi: 10.1038/s43018-019-0009-7. Epub 2020 Jan 13. Nat Cancer. 2020. PMID: 35121843 Free PMC article.
-
Diversity and population-genetic properties of copy number variations and multicopy genes in cattle.DNA Res. 2016 Jun;23(3):253-62. doi: 10.1093/dnares/dsw013. Epub 2016 Apr 15. DNA Res. 2016. PMID: 27085184 Free PMC article.
-
Comparison of the Transcriptional Profiles of Melanocytes from Dark and Light Skinned Individuals under Basal Conditions and Following Ultraviolet-B Irradiation.PLoS One. 2015 Aug 5;10(8):e0134911. doi: 10.1371/journal.pone.0134911. eCollection 2015. PLoS One. 2015. PMID: 26244334 Free PMC article.
-
Population Genomics of Variegated Toad-Headed Lizard Phrynocephalus versicolor and Its Adaptation to the Colorful Sand of the Gobi Desert.Genome Biol Evol. 2022 Jul 2;14(7):evac076. doi: 10.1093/gbe/evac076. Genome Biol Evol. 2022. PMID: 35679302 Free PMC article.
References
-
- McCarroll SA, Altshuler DM. Copy-number variation and association studies of human disease. Nat Genet. 2007;39:S37–S42. - PubMed
Publication types
MeSH terms
Substances
LinkOut - more resources
Full Text Sources
Other Literature Sources
Research Materials
Miscellaneous
