. 2014 Mar 25;9(3):e93051.
doi: 10.1371/journal.pone.0093051. eCollection 2014.

11β-hydroxysteroid dehydrogenase 1 specific inhibitor increased dermal collagen content and promotes fibroblast proliferation

Affiliations

11β-hydroxysteroid dehydrogenase 1 specific inhibitor increased dermal collagen content and promotes fibroblast proliferation

Mika Terao et al. PLoS One. .

Abstract

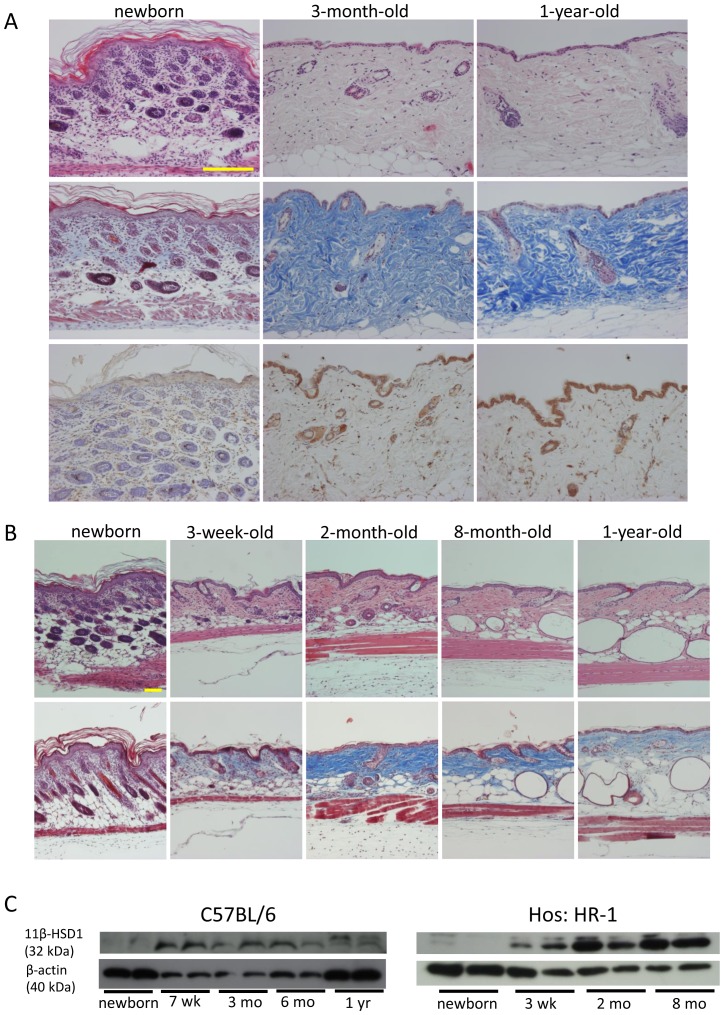
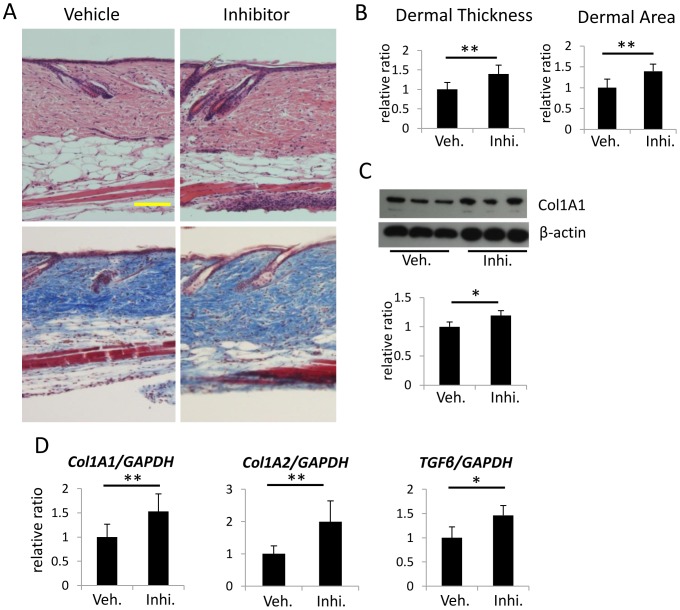
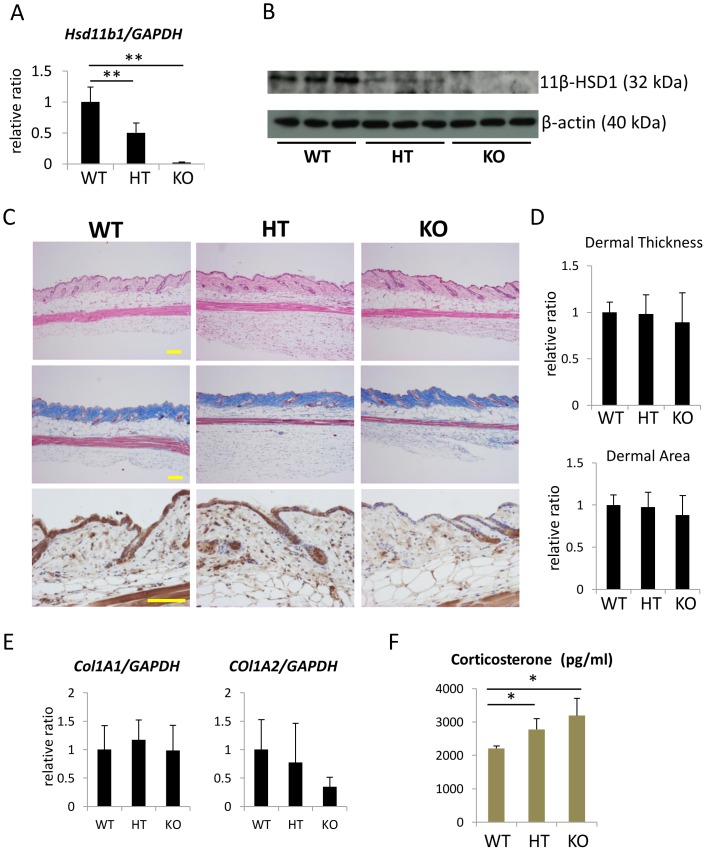
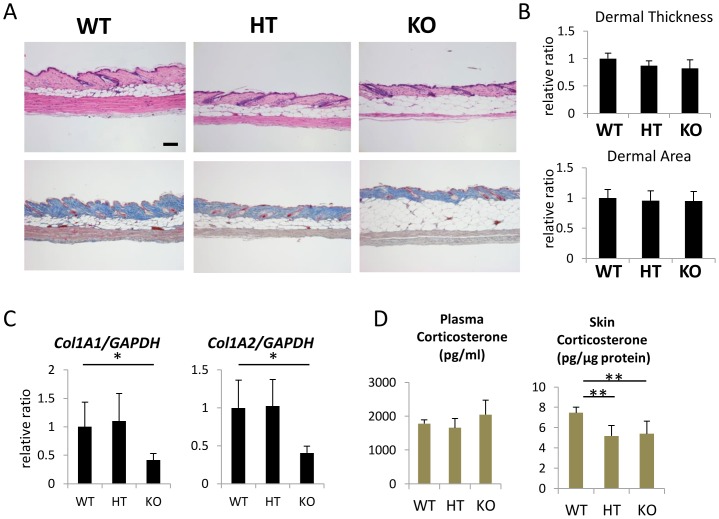
Glucocorticoids (GCs) are one of the most effective anti-inflammatory drugs for treating acute and chronic inflammatory diseases. However, several studies have shown that GCs alter collagen metabolism in the skin and induce skin atrophy. Cortisol is the endogenous GC that is released in response to various stressors. Over the last decade, extraadrenal cortisol production in various tissues has been reported. Skin also synthesizes cortisol through a de novo pathway and through an activating enzyme. 11β-hydroxysteroid dehydrogenase 1 (11β-HSD1) is the enzyme that catalyzes the conversion of hormonally inactive cortisone to active cortisol in cells. We previously found that 11β-HSD1 negatively regulates proliferation of keratinocytes. To determine the function of 11β-HSD1 in dermal fibroblasts and collagen metabolism, the effect of a selective 11β-HSD1 inhibitor was studied in mouse tissues and dermal fibroblasts. The expression of 11β-HSD1 increased with age in mouse skin. Subcutaneous injection of a selective 11β-HSD1 inhibitor increased dermal thickness and collagen content in the mouse skin. In vitro, proliferation of dermal fibroblasts derived from 11β-HSD1 null mice (Hsd11b1(-/-) mice) was significantly increased compared with fibroblasts from wild-type mice. However, in vivo, dermal thickness of Hsd11b1(-/-) mice was not altered in 3-month-old and 1-year-old mouse skin compared with wild-type mouse skin. These in vivo findings suggest the presence of compensatory mechanisms in Hsd11b1(-/-) mice. Our findings suggest that 11β-HSD1 inhibition may reverse the decreased collagen content observed in intrinsically and extrinsically aged skin and in skin atrophy that is induced by GC treatment.


Conflict of interest statement

Competing Interests: The authors have declared that no competing interests exist.

Figures

Figure 1
Figure 1. Histological analysis and changes in 11β-HSD1 expression in mouse skin during aging in C57BL/6 and Hos: HR-1 mice.
(A) H&E staining (upper panel), Masson's trichrome staining (middle panel), and 11β-HSD1 staining (lower panel) of newborn, 3-month-old, and 1-year-old C57BL/6 mouse skin. Bar  = 100 μm. (B) H&E staining (upper panel) and Masson's trichrome staining (lower panel) of newborn, 3-week-old, 2-month-old, 8-month-old, and 1-year-old Hos: HR-1 mouse skin. Bar  = 100 μm. (C) Western blot analysis of 11β-HSD1 expression in mouse skin harvested from newborn, 7-weeks-old, 3-month-old, 6-month-old and 1-year-old mouse skin (C57BL/6), and newborn, 3-week-old, 2-month-old, and 8-month-old mouse skin (Hos: HR-1).
Figure 2
Figure 2. Effects of 11β-HSD1 inhibition on dermal thickness and expression of a collagen-associated gene in 7-week-old C57BL/6 mice.
(A) Representative H&E and Masson's trichrome staining of 11β-HSD1 inhibitor-treated and vehicle-treated mouse skin (N = 6 per group). Bar  = 100 μm. (B) Dermal thickness and the dermal area of 11β-HSD1 inhibitor-treated and vehicle-treated mice. Dermal thickness was calculated by averaging the thickness measured at five locations in each section. Three sections from each mouse were evaluated. The dermal area in each mouse was measured using Image J. Bars show the mean epidermal thickness ± SD (N = 6; *P<0.01, Student's t-test). (C) Western blot analysis of Collagen type 1 expression in mouse skin from three individual animals treated with the 11β-HSD1 inhibitor or vehicle. Bars show the results of densitometric analysis relative to β-actin. Mean ± SD of each group are shown. (N = 3 *P<0.05, Student's t-test.) (D) The relative expression of Col1A1, Col1A2 and TGFβ1 in 11β-HSD1 inhibitor-treated and vehicle-treated mouse skin was assessed with rtPCR. GAPDH was used as an internal control. Bars indicate the mean ± SD (N = 6; *P<0.05, **P<0.01, Student's t-test).
Figure 3
Figure 3. Effects of 11β-HSD1 inhibition on dermal thickness and expression of a collagen-associated gene in 1-year-old C57BL/6 mice.
(A) Representative H&E and Masson's trichrome staining of 11β-HSD1 inhibitor-treated and vehicle-treated mouse skin (N = 6 per group). Bar  = 100 μm. (B) Dermal thickness and the dermal area of 11β-HSD1 inhibitor-treated and vehicle-treated mice. Dermal thickness was calculated by averaging the thickness measured at five locations in each section. Three sections from each mouse were evaluated. The dermal area in each mouse was measured using Image J. Bars show the mean epidermal thickness ± SD (N = 6; **P<0.01, Student's t-test). (C) Western blot analysis of Collagen type 1 expression in mouse skin from three individual animals treated with the 11β-HSD1 inhibitor or vehicle. Bars show the results of densitometric analysis relative to β-actin. Mean ± SD of each group are shown. (N = 6) (D) The relative expression of Col1A1, Col1A2 and TGFβ1 in 11β-HSD1 inhibitor-treated and vehicle-treated mouse skin was assessed with rtPCR. GAPDH was used as an internal control. Bars indicate the mean ± SD.
Figure 4
Figure 4. Proliferation and expression of a collagen-associated gene in 11β-HSD1 knockout mouse dermal fibroblasts.
(A) The relative expression of 11β-HSD1 in dermal fibroblasts derived from newborn mouse skin and 1-year-old mouse skin was assessed with rtPCR. GAPDH was used as an internal control (N = 3; **P<0.01, Student's t-test). (B) The expression of 11β-HSD1 in dermal fibroblasts derived from newborn mouse skin and 1-year-old mouse skin was assessed with Western blotting. (C) The relative expression of 11β-HSD1 in dermal fibroblasts derived from wild-type (WT), heterozygous knockout (HT), and homozygous knockout (KO) mouse skin was assessed with rtPCR. GAPDH was used as an internal control (N = 3). **P<0.01, one-way ANOVA followed by the Bonferroni-Dunn test for multiple comparisons. (D) Proliferation of dermal fibroblasts derived from WT, HT, and KO mice was assessed with an MTS assay on days 1, 2, and 3. Day 2 and 3 data were normalized to day 1 data for each group. Bars indicate the mean ± SD [N = 6; *P<0.05, **P<0.01, two-way ANOVA followed by the Bonferroni-Dunn test for multiple comparisons. There was also a significant interaction effect of genotype and time (F = 13.33, P<0.001)]. (E) Proliferation of dermal fibroblasts derived from WT mice treated with 11β-HSD1 selective inhibitor (10 μM) for 3 days was assessed by MTS assay. DMSO was applied as vehicle control. Inhibitor group data were normalized to vehicle group. Bars indicate the mean ± SD (N = 10; *P<0.05 Student's t-test). (F) Western blot analysis of phospho-Akt (Thr308 and Ser473), Akt, phospho-Erk, and Erk in dermal fibroblasts derived from WT and KO mice. Bars show the results of densitometric analysis relative to β-actin. Mean ± SD of each group are shown. (N = 4, *P<0.05, Student's t-test) (G) The MTS assay was used to assess proliferation of dermal fibroblasts derived from WT and KO mice treated with an Akt inhibitor (LY294002, 10 μM) or an Erk inhibitor (U0126, 10 μM). Bars indicate the mean ± SD (N = 6; *P<0.0001, two-way ANOVA followed by the Bonferroni-Dunn test for multiple comparisons.) (H) The relative expression of Col1A1 and MMP-13 in dermal fibroblasts derived from WT, HT, and KO mice. GAPDH was used as an internal control (N = 3; **P<0.01, one-way ANOVA followed by the Bonferroni-Dunn test for multiple comparisons).
Figure 5
Figure 5. Generation of 11β-HSD1 knockout mice.
(A) The relative expression of 11β-HSD1 in WT, HT, and KO mouse skin extracts was assessed with rtPCR. GAPDH was used as an internal control. **P<0.01, one-way ANOVA followed by the Bonferroni-Dunn test for multiple comparisons. (B) Western blot analysis of 11β-HSD1 in WT, HT, and KO mouse skin extracts. (C) H&E staining (upper panel), Masson's trichrome staining (middle panel), and 11β-HSD1 staining (lower panel) in 3-month-old WT, HT, and KO mouse skin. Bar  = 100 μm. (D) Dermal thickness was calculated by averaging the thickness measured at five locations in each section. Three sections from each mouse were evaluated. The dermal area in each mouse was measured using Image J. Bars show the mean epidermal thickness ± SD (N = 4). (E) The relative expression of Col1A1 and Col1A2 in 3-month-old WT, HT, and KO mouse skin. GAPDH was used as an internal control. Bars indicate the mean ± SD (N = 6). (F) Plasma corticosterone levels in WT, HT, and KO mice were measured with ELISA. Bars indicate the mean ± SD (N = 6; *P<0.05, one-way ANOVA followed by the Bonferroni-Dunn test for multiple comparisons).
Figure 6
Figure 6. Dermal thickness and collagen type1 expression of 1-year-old 11β-HSD1 knockout mouse skin.
(A) H&E staining (upper panel), Masson's trichrome staining (lower panel) of 1-year-old WT, HT, and KO mouse skin. Bar  = 100 μm. (B) Dermal thickness and the dermal area of 1-year-old mouse skin. Dermal thickness was calculated by averaging the thickness measured at five locations in each section. Three sections from each mouse were evaluated. The dermal area in each mouse was measured using Image J. Bars show the mean epidermal thickness ± SD (WT: N = 4, HT: N = 5, KO: N = 6). (C) The relative expression of Col1A1 and Col1A2 in 1-year-old WT, HT, and KO mouse skin. GAPDH was used as an internal control. Bars indicate the mean ± SD (WT: N = 4, HT: N = 5, KO: N = 6; *P<0.05, Student's t-test). (D) Plasma and skin corticosterone levels in WT, HT, and KO mice were measured with ELISA. Bars indicate the mean ± SD (WT: N = 4, HT: N = 5, KO: N = 6; **P<0.01, one-way ANOVA followed by the Bonferroni-Dunn test for multiple comparisons).

References

    1. Chebotaev D, Yemelyanov A, Budunova I (2007) The mechanisms of tumor suppressor effect of glucocorticoid receptor in skin. Mol Carcinog 46: 732–740. - PubMed
    1. Chebotaev DV, Yemelyanov AY, Lavker RM, Budunova IV (2007) Epithelial cells in the hair follicle bulge do not contribute to epidermal regeneration after glucocorticoid-induced cutaneous atrophy. J Invest Dermatol 127: 2749–2758. - PubMed
    1. Oishi Y, Fu ZW, Ohnuki Y, Kato H, Noguchi T (2002) Molecular basis of the alteration in skin collagen metabolism in response to in vivo dexamethasone treatment: effects on the synthesis of collagen type I and III, collagenase, and tissue inhibitors of metalloproteinases. Br J Dermatol 147: 859–868. - PubMed
    1. Nuutinen P, Autio P, Hurskainen T, Oikarinen A (2001) Glucocorticoid action on skin collagen: overview on clinical significance and consequences. J Eur Acad Dermatol Venereol 15: 361–362. - PubMed
    1. Averbeck M, Gebhardt C, Anderegg U, Simon JC (2010) Suppression of hyaluronan synthase 2 expression reflects the atrophogenic potential of glucocorticoids. Exp Dermatol 19: 757–759. - PubMed

Publication types

MeSH terms

Substances

LinkOut - more resources