. 2014 May 9;289(19):13347-61.
doi: 10.1074/jbc.M113.543710. Epub 2014 Mar 25.

Phosphorylation decreases ubiquitylation of the thiazide-sensitive cotransporter NCC and subsequent clathrin-mediated endocytosis

Affiliations

Phosphorylation decreases ubiquitylation of the thiazide-sensitive cotransporter NCC and subsequent clathrin-mediated endocytosis

Lena L Rosenbaek et al. J Biol Chem. .

Abstract

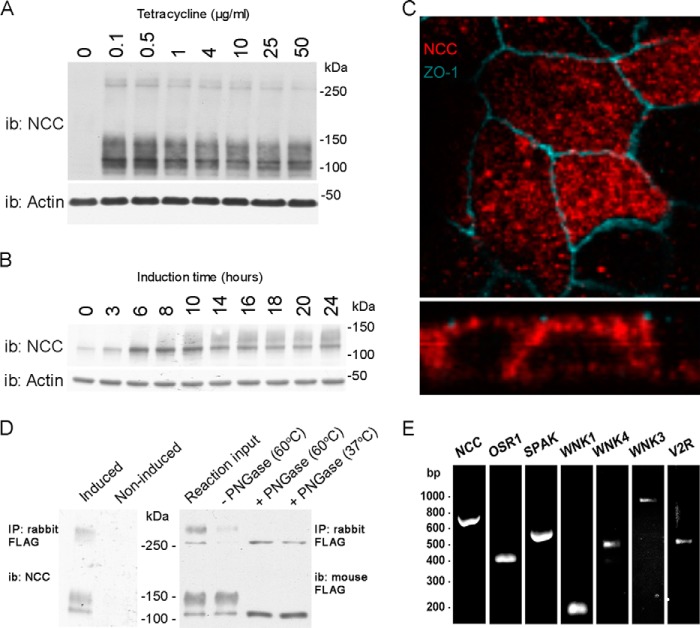
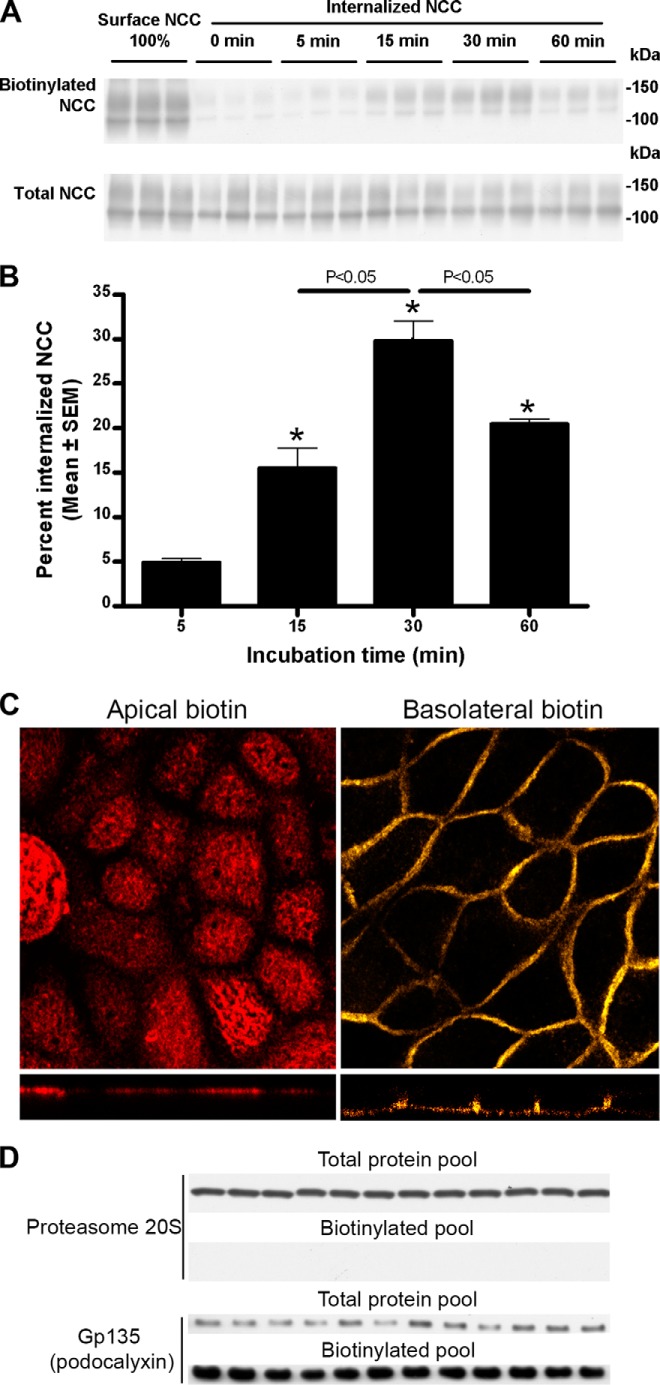
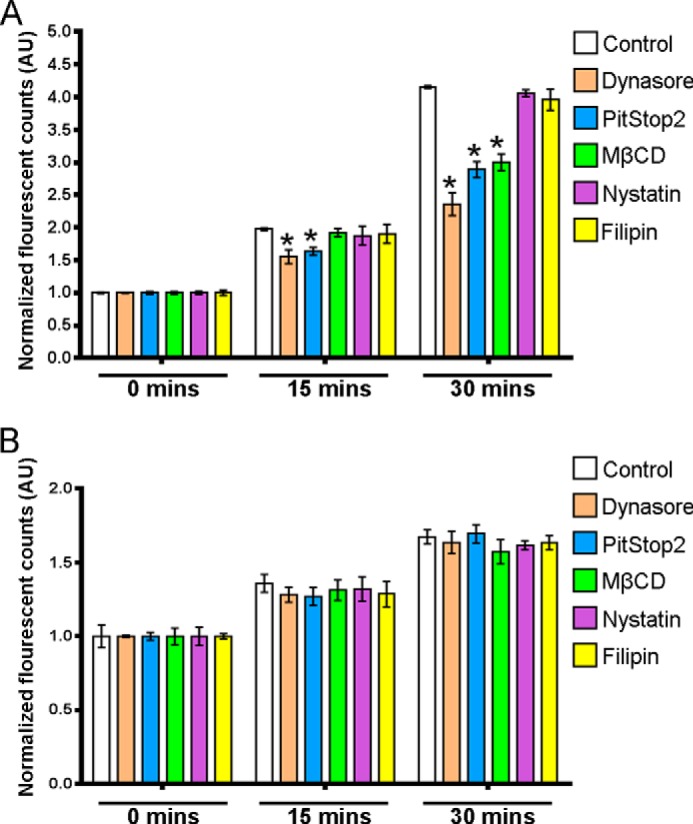
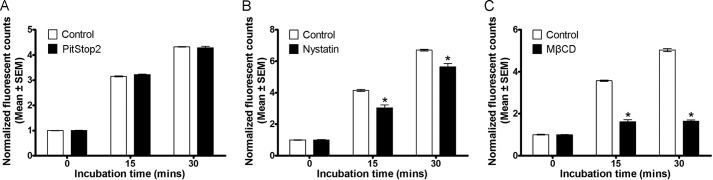
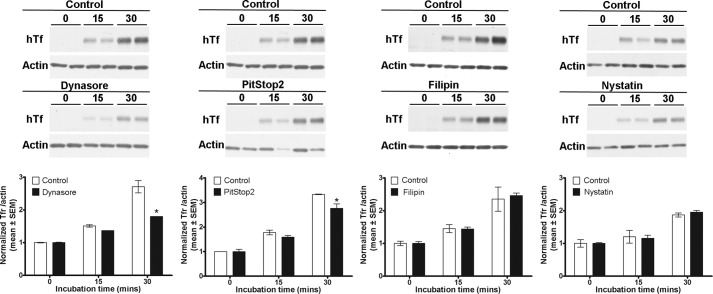
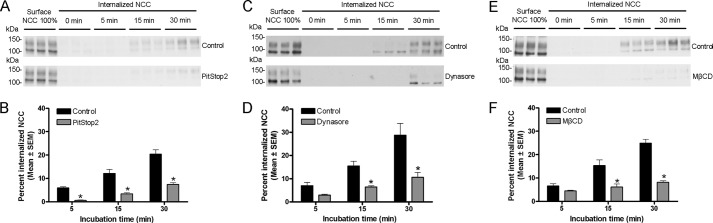
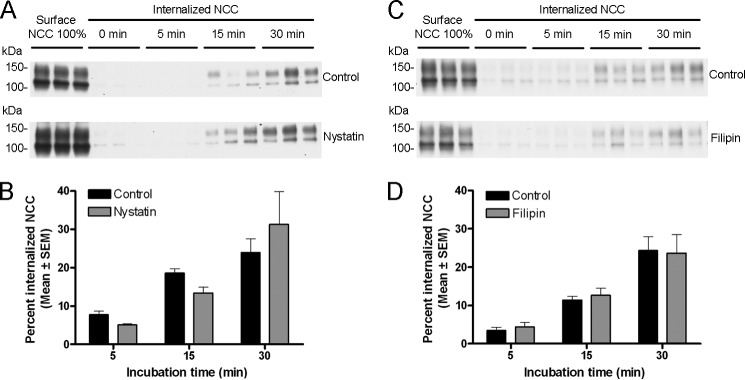
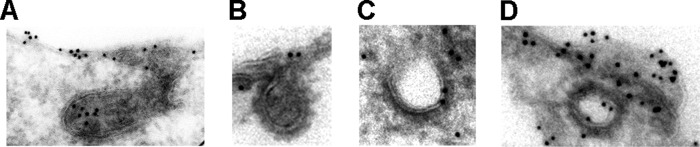
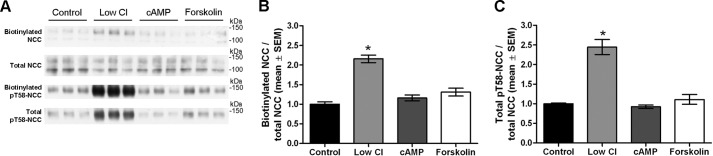
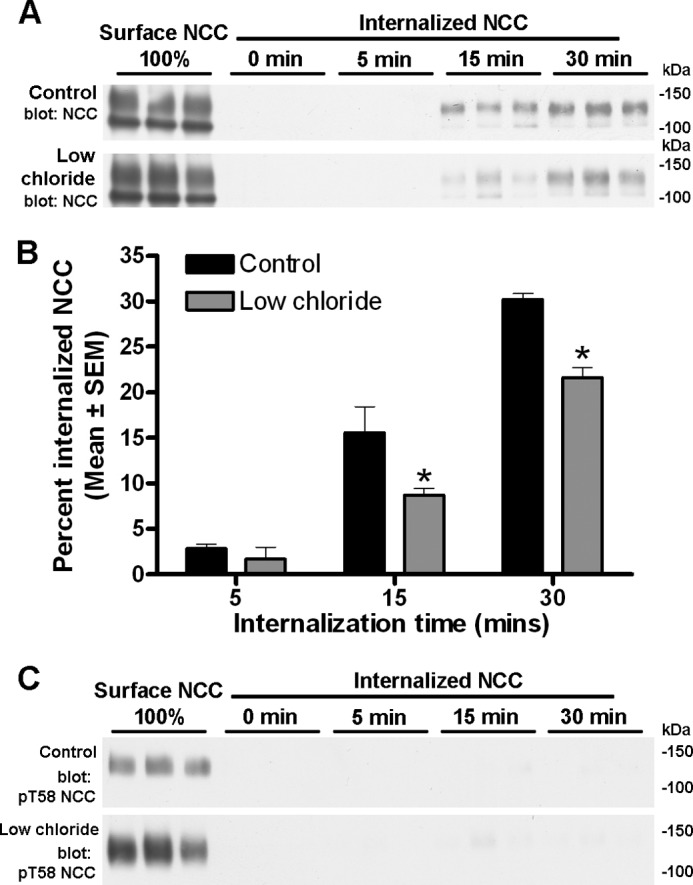
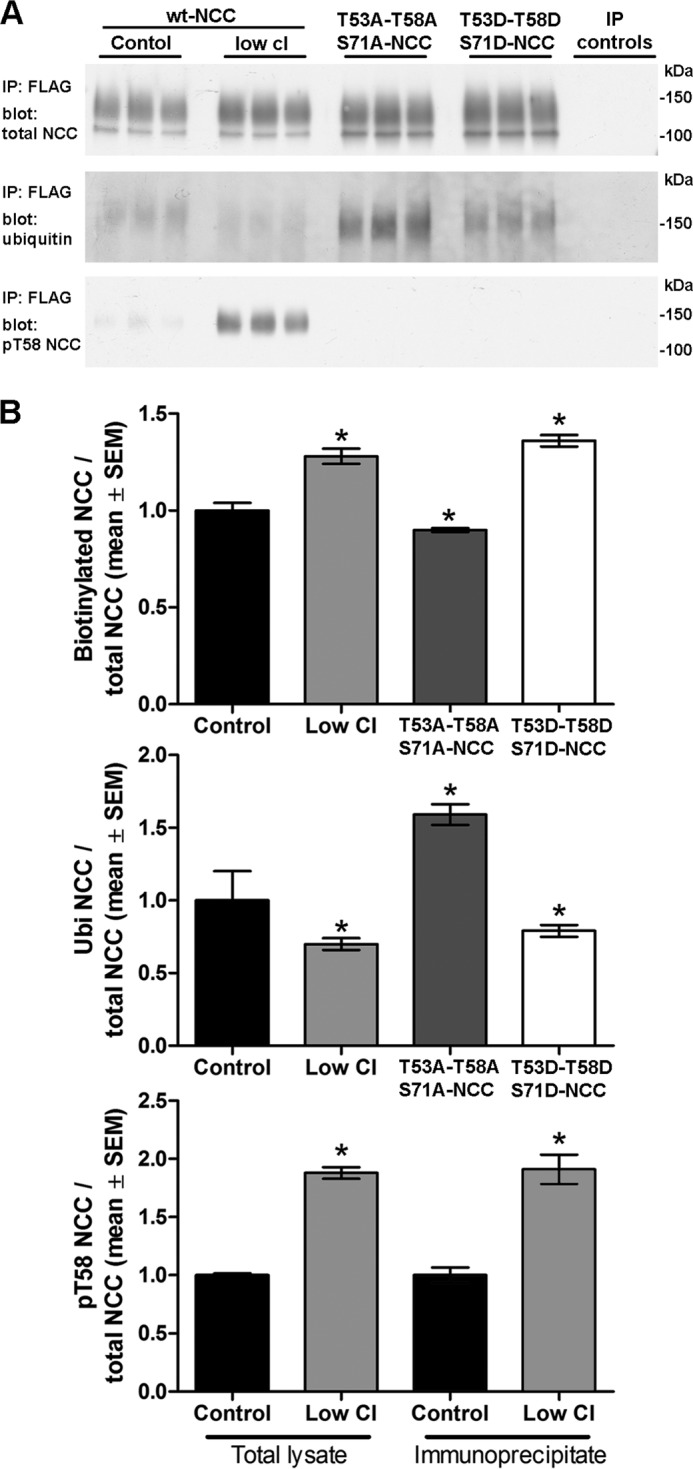
The thiazide-sensitive sodium chloride cotransporter, NCC, is the major NaCl transport protein in the distal convoluted tubule (DCT). The transport activity of NCC can be regulated by phosphorylation, but knowledge of modulation of NCC trafficking by phosphorylation is limited. In this study, we generated novel tetracycline-inducible Madin-Darby canine kidney type I (MDCKI) cell lines expressing NCC to examine the role of NCC phosphorylation and ubiquitylation on NCC endocytosis. In MDCKI-NCC cells, NCC was highly glycosylated at molecular weights consistent with NCC monomers and dimers. NCC constitutively cycles to the apical plasma membrane of MDCKI-NCC cells, with 20-30% of the membrane pool of NCC internalized within 30 min. The use of dynasore, PitStop2, methyl-β-cyclodextrin, nystatin, and filipin (specific inhibitors of either clathrin-dependent or -independent endocytosis) demonstrated that NCC is internalized via a clathrin-mediated pathway. Reduction of endocytosis resulted in greater levels of NCC in the plasma membrane. Immunogold electron microscopy confirmed the association of NCC with the clathrin-mediated internalization pathway in rat DCT cells. Compared with controls, inducing phosphorylation of NCC via low chloride treatment or mimicking phosphorylation by replacing Thr-53, Thr-58, and Ser-71 residues with Asp resulted in increased membrane abundance and reduced rates of NCC internalization. NCC ubiquitylation was lowest in the conditions with greatest NCC phosphorylation, thus providing a mechanism for the reduced endocytosis. In conclusion, our data support a model where NCC is constitutively cycled to the plasma membrane, and upon stimulation, it can be phosphorylated to both increase NCC activity and decrease NCC endocytosis, together increasing NaCl transport in the DCT.

Keywords: Endocytosis; Epithelium; Phosphorylation; Plasma Membrane; Trafficking; Ubiquitylation.


Figures

FIGURE 1.
FIGURE 1.
Characterization of a novel inducible MDCKI-NCC cell line. A, representative immunoblot of total protein samples extracted from MDCKI-NCC cells grown until confluent on semi-permeable supports and treated for the last 16 h with various concentrations of tetracycline. NCC is predominantly detected as a diffuse protein band between 100 and 150 kDa using an NCC-specific antibody. Higher molecular weight protein bands (possibly NCC dimers) can be detected above 250 kDa. i.b., immunoblot. B, representative immunoblot of total protein samples extracted from MDCKI-NCC cells grown until confluent on semi-permeable supports and treated with 10 μg/ml tetracycline for various time points. C, confocal laser micrographs (top, xy plane; bottom, xz plane) of MDCKI-NCC cells grown on semi-permeable supports labeled with mouse anti-FLAG (NCC, red) and anti-ZO-1 (blue). NCC labeling is observed intracellularly but also at the level of the tight junction complex. D, left, following immunoprecipitation (IP) of NCC (500 μg of lysate) using a rabbit FLAG antibody, the higher molecular mass bands above 250 kDa are more apparent. Control is noninduced MDCKI-NCC cells. Right, following PNGase treatment, both the higher and lower molecular weight protein bands are reduced in size, confirming that NCC exists as a complex glycosylated protein in MDCKI-NCC cells. Temperatures refer to those used for denaturation of the protein sample prior to PNGase treatment. E, expression of NCC and various genes involved in NCC regulation in MDCKI-NCC cells grown on semi-permeable supports. Conventional RT-PCR analysis of RNA extracted from MDCKI-NCC cells with primers specific for NCC, OSR1, SPAK, WNK1, WNK4, WNK3, and V2R.
FIGURE 2.
FIGURE 2.
NCC is constitutively internalized from the apical plasma membrane. A, representative Western blots showing NCC internalization in MDCKI-NCC cells grown on semi-permeable supports. Following biotinylation, MDCKI-NCC cells were incubated for 5 min (7th to 9th lanes), 15 min (10th to 12th lanes), 30 min (13th to 15th lanes), or 60 min (16th to 18th lanes) at 37 °C to allow internalization before treatment with the reducing agent MesNa (stripping biotin). Top blot, 1st to 3rd lanes show expression of steady-state surface NCC. The 4th to 6th lanes show surface NCC after treatment with the reducing agent MesNa. Internalized NCC was isolated, detected by Western blot, and quantified by densitometry. Note: all biotinylated samples are run on the same SDS-polyacrylamide gel, and all total samples are run on the same SDS-polyacrylamide gel, so a direct comparison between the biotinylated and total protein pool to estimate relative abundances is not possible. This applies to all subsequent figures. Bottom blot, lanes show total NCC abundance from corresponding samples. B, semi-quantitative assessment of the percentage of internalized NCC (steady-state surface levels equals 100%), showing a significant increase in NCC endocytosis over time. Data are means ± S.E. (n = 3). * represents significant change compared with 0-min time point. C, confocal laser micrographs (top, xy plane; bottom, xz plane) of MDCKI-NCC cells grown on semi-permeable supports and biotinylated from the apical or basolateral surface and labeled with fluorophore-conjugated streptavidin demonstrating side-specific membrane biotin labeling. D, immunoblotting of apically biotinylated MDCKI-NCC cells detects proteasome 20 S, a marker of intracellular proteins, only in the total protein pool. The Gp135/podocalyxin, an apical plasma membrane marker, is enriched in the biotinylated protein pool but is also detected in lower quantities in the total protein pool.
FIGURE 3.
FIGURE 3.
Characterization of clathrin-dependent and fluid phase endocytosis inhibitors in MDCKI-NCC cells. Internalization assays of fluorescent transferrin (marker for clathrin-mediated endocytosis) or dextran (marker of fluid phase internalization) in MDCKI-NCC cells were grown on plastic. A, internalization of transferrin after a 15- and 30-min incubation time is significantly decreased by 160 μm dynasore and 30 μm PitStop2. 20 mm MβCD significantly reduces transferrin endocytosis after 30 min. 0.4 mg/ml filipin or 25 μg/ml nystatin have no significant inhibitory effect on transferrin uptake. B, 160 μm dynasore, 30 μm PitStop2, 20 mm MβCD, 0.4 mg/ml filipin, or 25 μg/ml nystatin have no significant effect on dextran endocytosis. Data are means ± S.E. (n = 3). * represents significant change compared with control treatment at same time point.
FIGURE 4.
FIGURE 4.
Characterization of clathrin-independent endocytosis inhibitors in MDCKI-NCC cells. Internalization assay of LacCer (BODIPY® FL C5-lactosylceramide complexed to BSA) (marker for clathrin-independent endocytosis) in MDCKI-NCC cells grown on plastic. A, 30 μm PitStop2 has no significant effect on the internalization of LacCer. B, internalization of LacCer after 15 and 30 min is significantly reduced following 25 μg/ml nystatin treatment. C, LacCer endocytosis is significantly inhibited at all time points examined with 20 mm MβCD. Data are means ± S.E. (n = 3). * represents significant change compared with control treatment at same time point.
FIGURE 5.
FIGURE 5.
Dynasore and PitStop2, but not filipin and nystatin, inhibit internalization of human transferrin in MDCKI-NCC cells. Internalization assays of fluorescent transferrin (marker for clathrin-mediated endocytosis) in MDCKI-NCC cells grown on plastic. hTf was added to the cells and subjected to internalization by incubation at 37 °C for 0, 15, or 30 min. Unspecifically bound or nonendocytosed transferrin was removed by acid wash. Representative immunoblots and quantitative assessment of duplicate samples are shown. 160 μm dynasore and 30 μm PitStop2 but not 0.4 mg/ml filipin or 25 μg/ml nystatin decreased internalization of transferrin after 30 min. Data are means ± S.E. * represents significant change compared with control treatment at same time point.
FIGURE 6.
FIGURE 6.
PitStop2, dynasore, and MβCD, but not nystatin or filipin, increase steady-state surface abundance of NCC. A, C, E, G, and I, representative Western blots showing steady-state levels of NCC in the apical plasma membrane of MDCKI-NCC cells grown on semi-permeable supports and treated with vehicle or 30 μm PitStop2 (A), 160 μm dynasore (C), 20 mm MβCD (E), 25 μg/ml nystatin (G), or 0.4 mg/ml filipin (I). Top blots, apical plasma membrane NCC abundance (biotinylated pool). Bottom blots, total NCC abundance. Blots are cropped to fit the figure, but samples are run on the same SDS-PAGE. B, D, F, H, and J, quantitative assessment of steady-state levels of NCC at the apical membrane. 30 μm PitStop2 (B), 160 μm dynasore (D), or 20 mm MβCD (F) significantly increase steady-state apical membrane levels of NCC. 25 μg/ml nystatin (H) or 0.4 mg/ml filipin (J) have no significant effect on the steady-state levels of NCC in the apical membrane. Data are means ± S.E. (n = 6). * represents significant change compared with control treatment.
FIGURE 7.
FIGURE 7.
PitStop2, dynasore, and MβCD inhibit NCC internalization. A, C, and E, representative Western blots showing NCC internalization in MDCKI-NCC cells grown on semi-permeable supports and treated with vehicle or 30 μm PitStop2 (A), 160 μm dynasore (C), or 20 mm MβCD (E). Following biotinylation, MDCKI-NCC cells were incubated for 5 min (7th to 9th lanes), 15 min (10th to 12th lanes), or 30 min (13th to 15th lanes) at 37 °C to allow internalization before treatment with the reducing agent MesNa (stripping biotin). Top blots, 1st to 3rd lanes show expression of steady-state surface NCC. 4th to 6th lanes show surface NCC after treatment with the reducing agent MesNa. Internalized NCC was isolated, detected by Western blot, and quantified by densitometry. Bottom blots, similar setup but following PitStop2, dynasore, or MβCD treatment. B, D, and F, semi-quantitative assessment of the percentage of internalized NCC (steady-state surface levels equals 100%) with vehicle or 30 μm PitStop2 (B), 160 μm dynasore (D), or 20 mm MβCD (F) treatment. PitStop2, dynasore, and MβCD significantly reduce internalization of NCC. Data are means ± S.E. (n = 6). * represents significant change compared with control treatment at same time point.
FIGURE 8.
FIGURE 8.
Nystatin and filipin do not significantly change internalization of NCC. A and C, representative Western blots showing NCC internalization in MDCKI-NCC cells grown on semi-permeable supports and treated with vehicle or 25 μg/ml nystatin (A) or 0.4 mg/ml filipin (C). Following biotinylation, MDCKI-NCC cells were incubated for 5 min (7th to 9th lanes), 15 min (10th to 12th lanes), or 30 min (13th to 15th lanes) at 37 °C to allow internalization before treatment with the reducing agent MesNa (stripping biotin). Top blots, 1st to 3rd lanes show expression of steady-state surface NCC. 4th to 6th lanes show surface NCC after treatment with the reducing agent MesNa. Internalized NCC was isolated, detected by Western blot, and quantified by densitometry. Bottom blots, similar setup but following nystatin or filipin treatment. B and D, semi-quantitative assessment of the percentage of internalized NCC (steady-state surface levels equals 100%) with vehicle or 25 μg/ml nystatin (B) or 0.4 mg/ml filipin (D). Nystatin and filipin have no significantly effect on internalization of NCC. Data are means ± S.E. (n = 6).
FIGURE 9.
FIGURE 9.
NCC localizes to clathrin-coated pits and vesicles in rat DCT cells. Immunogold electron micrographs demonstrating NCC in structures resembling clathrin-coated pits (A and B) and clathrin-coated vesicles (C and D) in the apical domain of rat DCT cells. Gold particle diameter, 10 nm.
FIGURE 10.
FIGURE 10.
Mimicking phosphorylation at Thr-53, Thr-58, and Ser-71 decreases the internalization of NCC from the apical plasma membrane of MDCKI-NCC cells grown on semi-permeable supports. A, representative Western blots showing NCC internalization in MDCKI-NCC cells expressing phospho-deficient (T53A/T58A/S71A) or phospho-mimicking (T53D/T58D/S71D) NCC mutants. Following biotinylation, MDCKI-NCC cells were incubated for 5 min (7th to 9th lanes), 15 min (10th to 12th lanes), or 30 min (13th to 15th lanes) at 37 °C to allow internalization before treatment with the reducing agent MesNa (stripping biotin). Top blot, 1st to 3rd lanes show expression of steady-state surface T53A/T58A/S71A-NCC. 4th to 6th lanes show surface NCC after treatment with the reducing agent MesNa. Internalized NCC was isolated, detected by Western blot, and quantified by densitometry. Bottom blot, similar setup for T53D/T58D/S71D-NCC. B, semi-quantitative assessments of the percentage of internalized T53A/T58A/S71A-NCC or T53D/T58D/S71D-NCC (steady-state surface levels equals 100%). T53D/T58D/S71D-NCC displays reduced NCC abundance in the internalized pool at 15 and 30 min compared with T53A/T58A/S71A-NCC. Data are means ± S.E. (n = 3). * represents significant change in T53D/T58D/S71D-NCC compared with T53A/T58A/S71A-NCC at same time point.
FIGURE 11.
FIGURE 11.
Hypotonic low chloride treatment of MDCKI-NCC cells increases NCC membrane abundance and Thr-58 phosphorylation. A, representative Western blot of samples from an apical surface biotinylation experiment of MDCKI-NCC cells grown on semi-permeable supports and treated with hypotonic low chloride, 25 μm forskolin, 50 μm (Sp)-cAMP, or control conditions. Biotinylated and total pools were blotted for total NCC and Thr(P)-58NCC. B, semi-quantitative assessment of apical membrane NCC abundance. Hypotonic low chloride conditions significantly increased surface levels of NCC. C, semi-quantitative assessment of total Thr(P)-58NCC levels. Thr(P)-58NCC abundance is significantly increased with hypotonic low chloride. Data are means ± S.E. (n = 6). * represents significant change compared with control treatment.
FIGURE 12.
FIGURE 12.
Hypotonic low chloride decreases NCC endocytosis in MDCKI-NCC cells grown on semi-permeable supports. A, representative western blots showing NCC internalization in MDCKI-NCC cells treated with vehicle or low chloride. Following biotinylation, MDCKI-NCC cells were incubated for 5 min (7th to 9th lanes), 15 min (10th to 12th lanes), or 30 min (13th to 15th lanes) at 37 °C to allow internalization before treatment with the reducing agent MesNa (stripping biotin). Top blot, 1st to 3rd lanes show expression of steady-state surface NCC. 4th to 6th lanes show surface NCC after treatment with MesNa. Internalized NCC was isolated, detected by Western blot, and quantified by densitometry. Bottom blot, similar set-up but following low chloride treatment. B, semi-quantitative assessments of the percentage of internalized NCC (steady-state surface levels equals 100%) with hypotonic low chloride or control conditions. Cells stimulated with hypotonic low chloride have reduced abundance of NCC in the internalized pool at 15 and 30 min compared with control conditions. Data are means ± S.E. (n = 6). * represents significant change compared with control treatment at same time point. C, representative Western blots of the same samples demonstrating no Thr(P)-58NCC in the internalized pool.
FIGURE 13.
FIGURE 13.
Phosphorylation of NCC at Thr-53, Thr-58, and Ser-71 decreases NCC ubiquitylation at the cell surface. MDCKI-NCC cells grown on semi-permeable supports under control or after treatment with low chloride, T53D/T58D/S71D-NCC cells, and T53A/T58A/S71A-NCC cells were apically biotinylated, and the surface pool of proteins was utilized for NCC immunoprecipitation using FLAG antibodies. A, representative immunoblots of the levels of total NCC, ubiquitylated NCC, and Thr(P)-58NCC. The pool of ubiquitylated NCC isolated from MDCKI-NCC cells treated with low chloride or T53D/T58D/S71D-NCC cells was lower compared with MDCKI-NCC cells under control conditions or T53A/T58A/S71A-NCC cells. Control IPs are FLAG antibody without lysate, no antibody without lysate, and anti-AQP1 antibody with lysate. B, semi-quantitative assessments of the levels of surface (biotinylated) NCC, ubiquitylated NCC, and Thr(P)-58NCC under the various conditions (n = 6). Data are means ± S.E. * represents significant change compared with MDCKI-NCC control cells.

Similar articles

Cited by

References

    1. Gamba G. (2005) Molecular physiology and pathophysiology of electroneutral cation-chloride cotransporters. Physiol. Rev. 85, 423–493 - PubMed
    1. Plotkin M. D., Kaplan M. R., Verlander J. W., Lee W. S., Brown D., Poch E., Gullans S. R., Hebert S. C. (1996) Localization of the thiazide sensitive Na-Cl cotransporter, rTSC1 in the rat kidney. Kidney Int. 50, 174–183 - PubMed
    1. Gamba G., Miyanoshita A., Lombardi M., Lytton J., Lee W. S., Hediger M. A., Hebert S. C. (1994) Molecular cloning, primary structure, and characterization of two members of the mammalian electroneutral sodium-(potassium)-chloride cotransporter family expressed in kidney. J. Biol. Chem. 269, 17713–17722 - PubMed
    1. de Jong J. C., Willems P. H., Mooren F. J., van den Heuvel L. P., Knoers N. V., Bindels R. J. (2003) The structural unit of the thiazide-sensitive NaCl cotransporter is a homodimer. J. Biol. Chem. 278, 24302–24307 - PubMed
    1. Hoover R. S., Poch E., Monroy A., Vázquez N., Nishio T., Gamba G., Hebert S. C. (2003) N-Glycosylation at two sites critically alters thiazide binding and activity of the rat thiazide-sensitive Na(+):Cl(−) cotransporter. J. Am. Soc. Nephrol. 14, 271–282 - PubMed

Publication types

LinkOut - more resources