

Expression profiling stratifies mesothelioma tumors and signifies deregulation of spindle checkpoint pathway and microtubule network with therapeutic implications
- PMID: 24669013
- PMCID: PMC4037861
- DOI: 10.1093/annonc/mdu127
Expression profiling stratifies mesothelioma tumors and signifies deregulation of spindle checkpoint pathway and microtubule network with therapeutic implications
Abstract
Background: Malignant pleural mesothelioma (MPM) is a lethal neoplasm exhibiting resistance to most treatment regimens and requires effective therapeutic options. Though an effective strategy in many cancer, targeted therapy is relatively unexplored in MPM because the therapeutically important oncogenic pathways and networks in MPM are largely unknown.
Materials and methods: We carried out gene expression microarray profiling of 53 surgically resected MPMs tumors along with paired normal tissue. We also carried out whole transcriptomic sequence (RNA-seq) analysis on eight tumor specimens. Taqman-based quantitative Reverse-transcription polymerase chain reaction (qRT-PCR), western analysis and immunohistochemistry (IHC) analysis of mitotic arrest deficient-like 1 (MAD2L1) was carried out on tissue specimens. Cell viability assays of MPM cell lines were carried out to assess sensitivity to specific small molecule inhibitors.
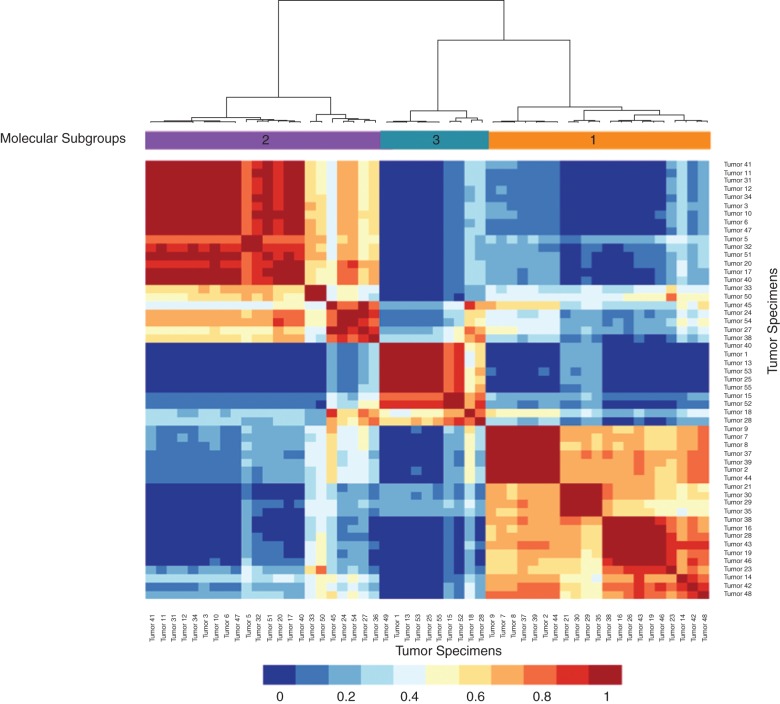
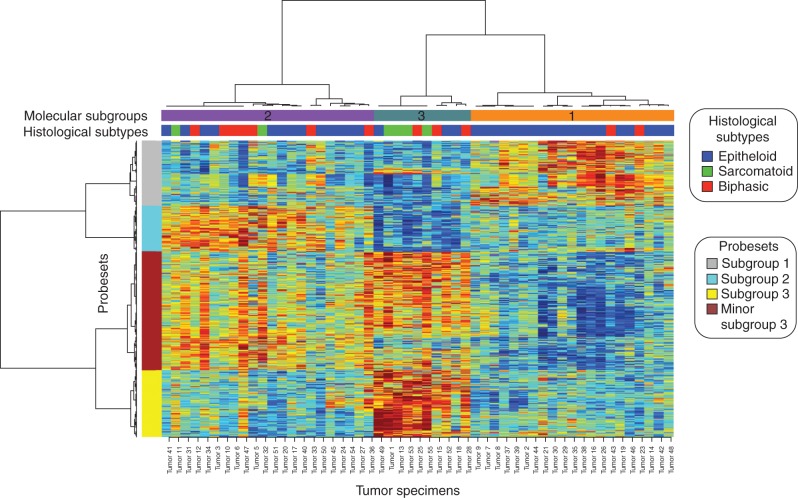
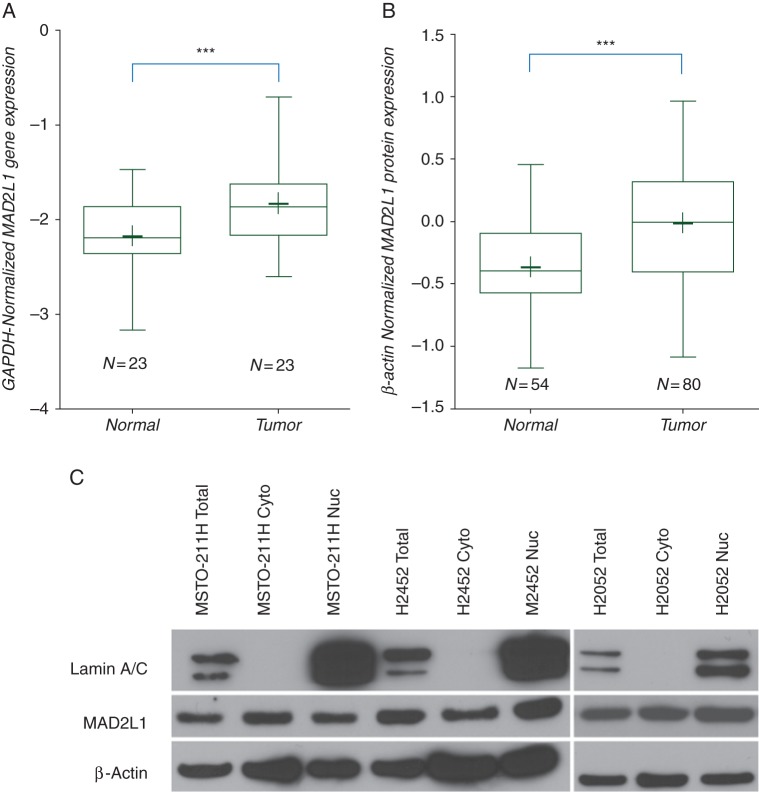
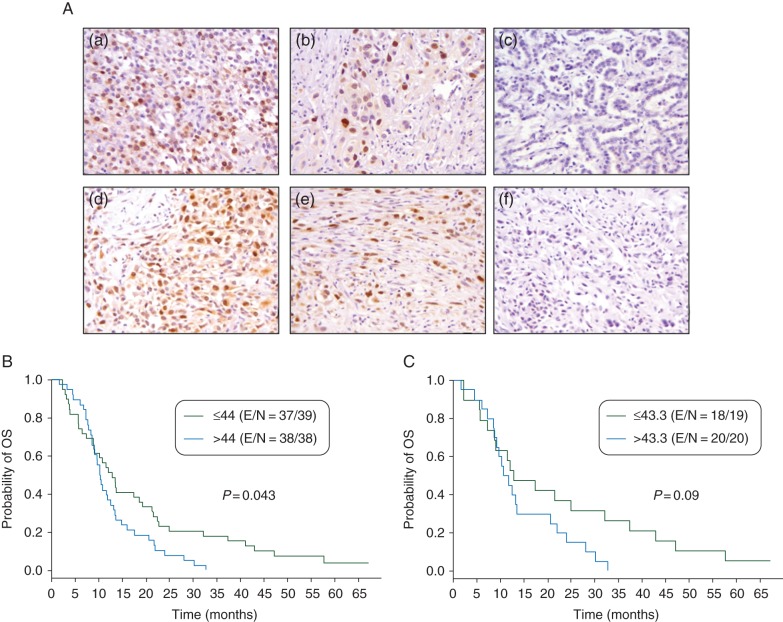
Results: Bioinformatics analysis of the microarray data followed by pathway analysis revealed that the mitotic spindle assembly checkpoint (MSAC) pathway was most significantly altered in MPM tumors with upregulation of 18 component genes, including MAD2L1 gene. We validated the microarray data for MAD2L1 expression using quantitative qRT-PCR and western blot analysis on tissue lysates. Additionally, we analyzed expression of the MAD2L1 protein by IHC using an independent tissue microarray set of 80 MPM tissue samples. Robust clustering of gene expression data revealed three novel subgroups of tumors, with unique expression profiles, and showed differential expression of MSAC pathway genes. Network analysis of the microarray data showed the cytoskeleton/spindle microtubules network was the second-most significantly affected network. We also demonstrate that a nontaxane small molecule inhibitor, epothilone B, targeting the microtubules have great efficacy in decreasing viability of 14 MPM cell lines.
Conclusions: Overall, our findings show that MPM tumors have significant deregulation of the MSAC pathway and the microtubule network, it can be classified into three novel molecular subgroups of potential therapeutic importance and epothilone B is a promising therapeutic agent for MPM.
Keywords: MAD2L1; epothilone B; mesothelioma; microarray; network; therapeutics.
© The Author 2014. Published by Oxford University Press on behalf of the European Society for Medical Oncology. All rights reserved. For permissions, please email: journals.permissions@oup.com.
Figures
Similar articles
-
ZIC1 is silenced and has tumor suppressor function in malignant pleural mesothelioma.J Thorac Oncol. 2013 Oct;8(10):1317-28. doi: 10.1097/JTO.0b013e3182a0840a. J Thorac Oncol. 2013. PMID: 24457242
-
Functional Analysis of the Adrenomedullin Pathway in Malignant Pleural Mesothelioma.J Thorac Oncol. 2016 Jan;11(1):94-107. doi: 10.1016/j.jtho.2015.09.004. J Thorac Oncol. 2016. PMID: 26762744
-
SORORIN and PLK1 as potential therapeutic targets in malignant pleural mesothelioma.Int J Oncol. 2016 Dec;49(6):2411-2420. doi: 10.3892/ijo.2016.3765. Epub 2016 Nov 10. Int J Oncol. 2016. PMID: 27840913
-
A review of transcriptome studies combined with data mining reveals novel potential markers of malignant pleural mesothelioma.Mutat Res. 2012 Apr-Jun;750(2):132-140. doi: 10.1016/j.mrrev.2011.12.003. Epub 2011 Dec 15. Mutat Res. 2012. PMID: 22198210 Review.
-
LncRNAs and related molecular basis in malignant pleural mesothelioma: Challenges and potential.Crit Rev Oncol Hematol. 2023 Jun;186:104012. doi: 10.1016/j.critrevonc.2023.104012. Epub 2023 Apr 26. Crit Rev Oncol Hematol. 2023. PMID: 37116816 Review.
Cited by
-
KCa1.1, a calcium-activated potassium channel subunit alpha 1, is targeted by miR-17-5p and modulates cell migration in malignant pleural mesothelioma.Mol Cancer. 2016 Jun 1;15(1):44. doi: 10.1186/s12943-016-0529-z. Mol Cancer. 2016. PMID: 27245839 Free PMC article.
-
The diagnostic or prognostic values of FADD in cancers based on pan‑cancer analysis.Biomed Rep. 2023 Sep 11;19(5):77. doi: 10.3892/br.2023.1659. eCollection 2023 Nov. Biomed Rep. 2023. PMID: 37829257 Free PMC article.
-
How asbestos drives the tissue towards tumors: YAP activation, macrophage and mesothelial precursor recruitment, RNA editing, and somatic mutations.Oncogene. 2018 May;37(20):2645-2659. doi: 10.1038/s41388-018-0153-z. Epub 2018 Mar 6. Oncogene. 2018. PMID: 29507420 Free PMC article.
-
Secreted primary human malignant mesothelioma exosome signature reflects oncogenic cargo.Sci Rep. 2016 Sep 8;6:32643. doi: 10.1038/srep32643. Sci Rep. 2016. PMID: 27605433 Free PMC article.
-
Mesotheliomas in Genetically Engineered Mice Unravel Mechanism of Mesothelial Carcinogenesis.Int J Mol Sci. 2018 Jul 27;19(8):2191. doi: 10.3390/ijms19082191. Int J Mol Sci. 2018. PMID: 30060470 Free PMC article. Review.
References
-
- Campbell NP, Kindler HL. Update on malignant pleural mesothelioma. Semin Respir Crit Care Med. 2011;32:102–110. - PubMed
-
- Steele JP. Prognostic factors for mesothelioma. Hematol Oncol Clin North Am. 2005;19:1041–1052. vi. - PubMed
-
- Singhal S, Wiewrodt R, Malden LD, et al. Gene expression profiling of malignant mesothelioma. Clin Cancer Res. 2003;9:3080–3097. - PubMed
Publication types
MeSH terms
Substances
Grants and funding
LinkOut - more resources
Full Text Sources
Other Literature Sources
Medical
Molecular Biology Databases
