

Different isolation methods alter the gene expression profiling of adipose derived stem cells
- PMID: 24669199
- PMCID: PMC3964446
- DOI: 10.7150/ijms.7697
Different isolation methods alter the gene expression profiling of adipose derived stem cells
Abstract
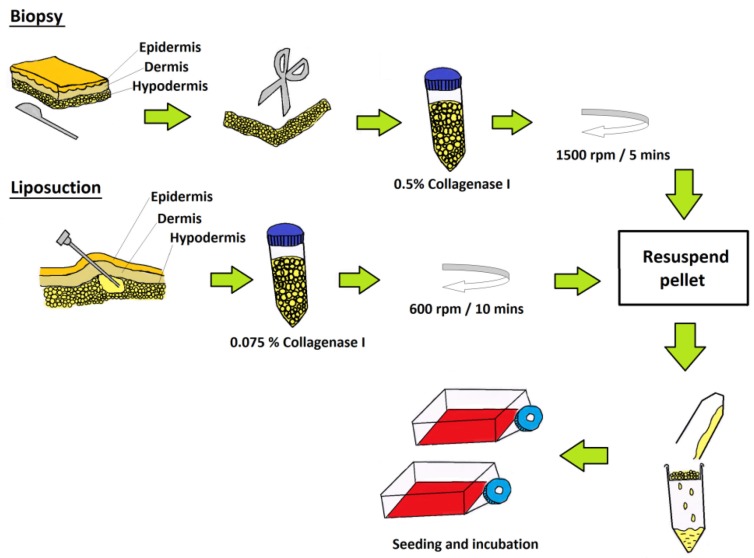
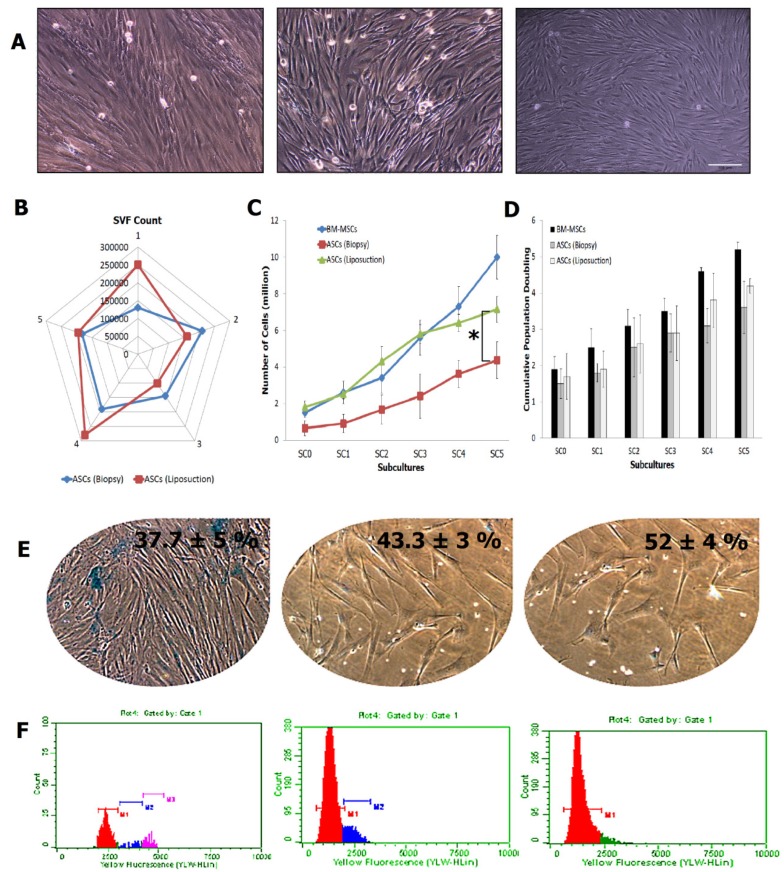
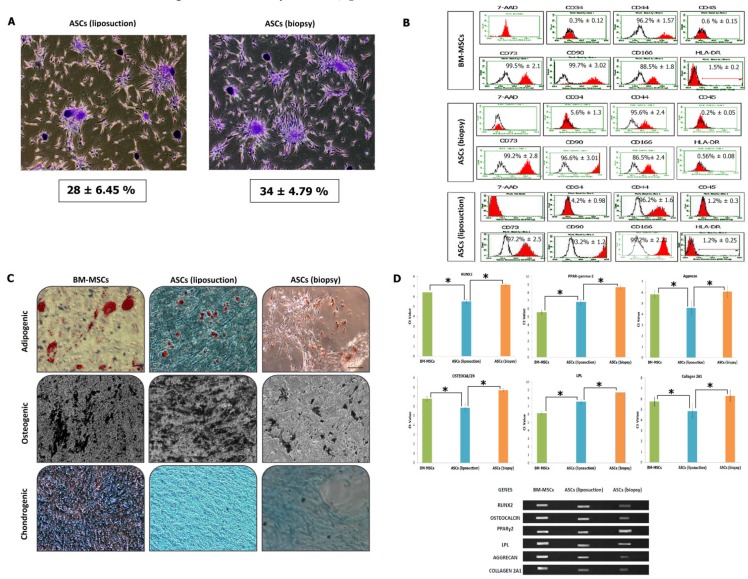
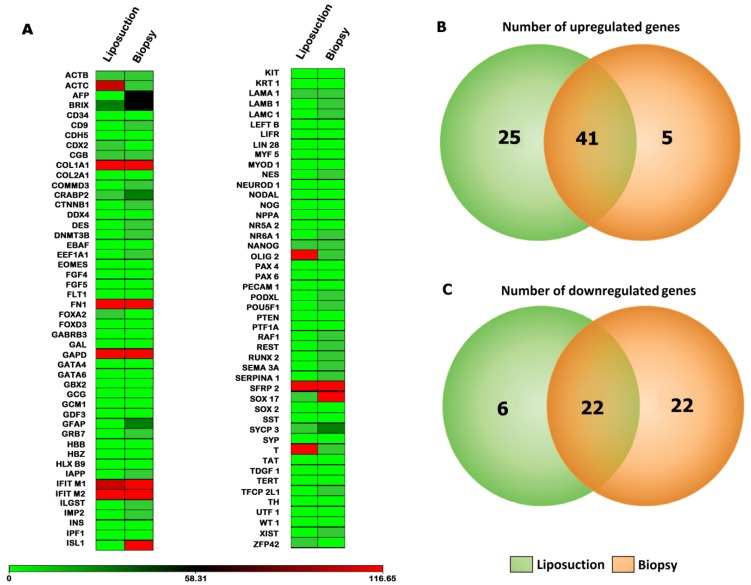
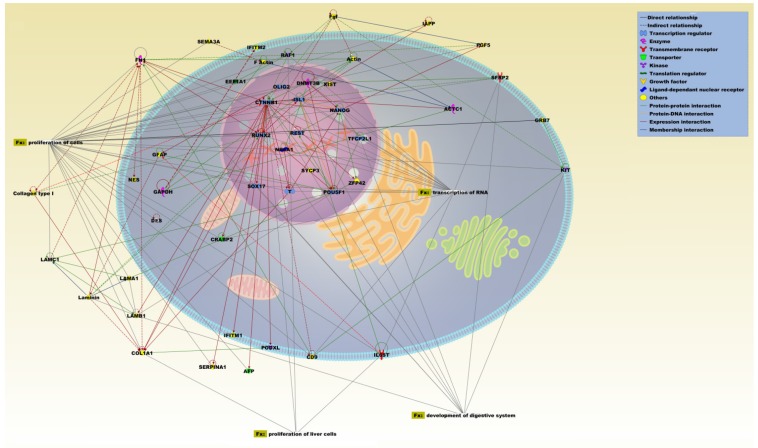
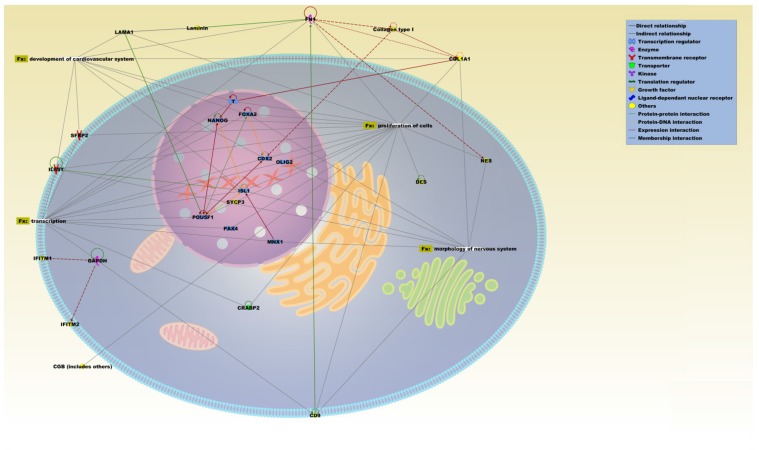
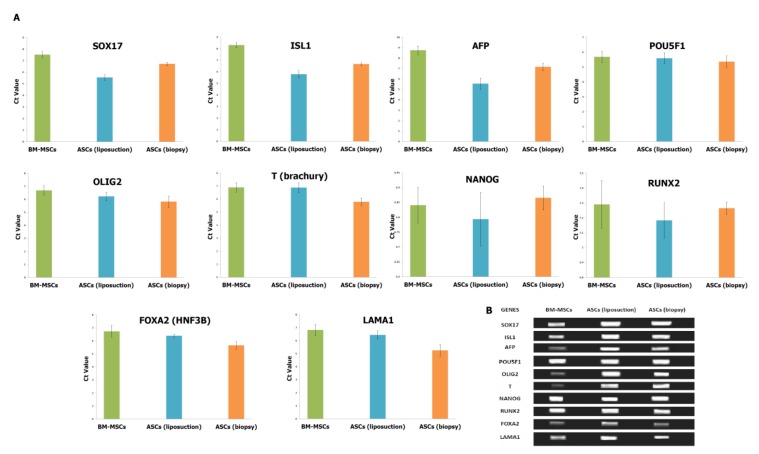
Human adipose stem cells (ASCs) has been in the limelight since its discovery as a suitable source of mesenchymal stem cells (MSCs) in regenerative medicine. Currently, two major techniques are used to isolate ASCs, namely liposuction and tissue biopsy. These two methods are relatively risk-free but the question as to which method could give a more efficient output remains unclear. Thus, this study was carried out to compare and contrast the output generated in regards to growth kinetics, differentiation capabilities in vitro, and gene expression profiling. It was found that ASCs from both isolation methods were comparable in terms of growth kinetics and tri-lineage differentiation. Furthermore, ASCs from both populations were reported as CD44(+), CD73(+), CD90(+), CD166(+), CD34(-), CD45(-) and HLA-DR(-). However, in regards to gene expression, a group of overlapping genes as well as distinct genes were observed. Distinct gene expressions indicated that ASCs (liposuction) has endoderm lineage propensity whereas ASCs (biopsy) has a tendency towards mesoderm/ectoderm lineage. This information suggests involvement in different functional activity in accordance to isolation method. In conclusion, future studies to better understand these gene functions should be carried out in order to contribute in the applicability of each respective cells in regenerative therapy.
Keywords: Ingenuity Pathway Analysis.; TLDA; biopsy; liposuction; mesenchymal.
Conflict of interest statement
Conflict of interest: The authors declare no conflicts of interest.
Figures
Similar articles
-
[Cell biological study of cultured cells derived from the fattyoffluid portions of liposuction aspirates].Zhonghua Zheng Xing Wai Ke Za Zhi. 2008 Mar;24(2):138-44. Zhonghua Zheng Xing Wai Ke Za Zhi. 2008. PMID: 18590220 Chinese.
-
[Cell biological study of adipose-derived stem cells].Nan Fang Yi Ke Da Xue Xue Bao. 2007 Apr;27(4):518-23. Nan Fang Yi Ke Da Xue Xue Bao. 2007. PMID: 17545049 Chinese.
-
Stromal cells from the adipose tissue-derived stromal vascular fraction and culture expanded adipose tissue-derived stromal/stem cells: a joint statement of the International Federation for Adipose Therapeutics and Science (IFATS) and the International Society for Cellular Therapy (ISCT).Cytotherapy. 2013 Jun;15(6):641-8. doi: 10.1016/j.jcyt.2013.02.006. Epub 2013 Apr 6. Cytotherapy. 2013. PMID: 23570660 Free PMC article.
-
Cell Surface Markers on Adipose-Derived Stem Cells: A Systematic Review.Curr Stem Cell Res Ther. 2017;12(6):484-492. doi: 10.2174/1574888X11666160429122133. Curr Stem Cell Res Ther. 2017. PMID: 27133085
-
Adipose-derived stem cells: Sources, potency, and implications for regenerative therapies.Biomed Pharmacother. 2019 Jun;114:108765. doi: 10.1016/j.biopha.2019.108765. Epub 2019 Mar 25. Biomed Pharmacother. 2019. PMID: 30921703 Review.
Cited by
-
Bone tissue engineering using adipose-derived stem cells and endothelial cells: Effects of the cell ratio.J Cell Mol Med. 2020 Jun;24(12):7034-7043. doi: 10.1111/jcmm.15374. Epub 2020 May 12. J Cell Mol Med. 2020. PMID: 32394620 Free PMC article.
-
Optimization of seeding cell density for differentiation of adipose-derived stem cells into epithelial-like cells on bioengineered composite scaffolds.Differentiation. 2025 May-Jun;143:100870. doi: 10.1016/j.diff.2025.100870. Epub 2025 May 20. Differentiation. 2025. PMID: 40414118
-
Adipose-Derived Stem Cells: Current Applications and Future Directions in the Regeneration of Multiple Tissues.Stem Cells Int. 2020 Dec 10;2020:8810813. doi: 10.1155/2020/8810813. eCollection 2020. Stem Cells Int. 2020. PMID: 33488736 Free PMC article. Review.
-
Implications for human adipose-derived stem cells in plastic surgery.J Cell Mol Med. 2015 Jan;19(1):21-30. doi: 10.1111/jcmm.12425. Epub 2014 Nov 26. J Cell Mol Med. 2015. PMID: 25425096 Free PMC article. Review.
-
The use of adipose stem cells in cranial facial surgery.Stem Cell Rev Rep. 2014 Oct;10(5):671-85. doi: 10.1007/s12015-014-9522-3. Stem Cell Rev Rep. 2014. PMID: 24913279 Free PMC article. Review.
References
-
- Ishikawa T, Hagiwara K, Ochiya T. Generation and Hepatic Differentiation of Human iPS Cells. Meth Mol Biol. 2012;826:103–114. doi: 10.1007/978-1-61779-468-1_9. - PubMed
-
- Schambach A, Cantz T, Baum C, Cathomen T. Generation and genetic modification of induced pluripotent stem cells. Expet Opin Biol Ther. 2010;10(7):1089–1103. - PubMed
-
- Rodríguez JP, Astudillo P, Ríos S, Pino AM. Involvement of adipogenic potential of human bone marrow mesenchymal stem cells (MSCs) in osteoporosis. Curr Stem Cell Res Ther. 2008;3(3):208–218. - PubMed
Publication types
MeSH terms
LinkOut - more resources
Full Text Sources
Other Literature Sources
Medical
Research Materials
Miscellaneous
