

Physiologically based pharmacokinetic modeling framework for quantitative prediction of an herb-drug interaction
- PMID: 24670388
- PMCID: PMC4042458
- DOI: 10.1038/psp.2013.69
Physiologically based pharmacokinetic modeling framework for quantitative prediction of an herb-drug interaction
Abstract
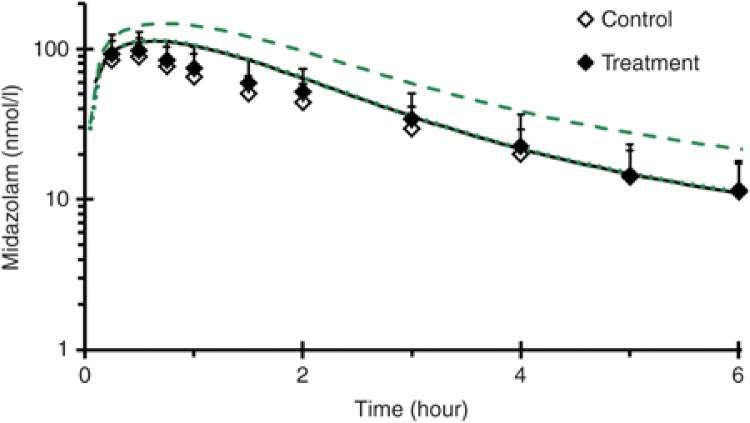
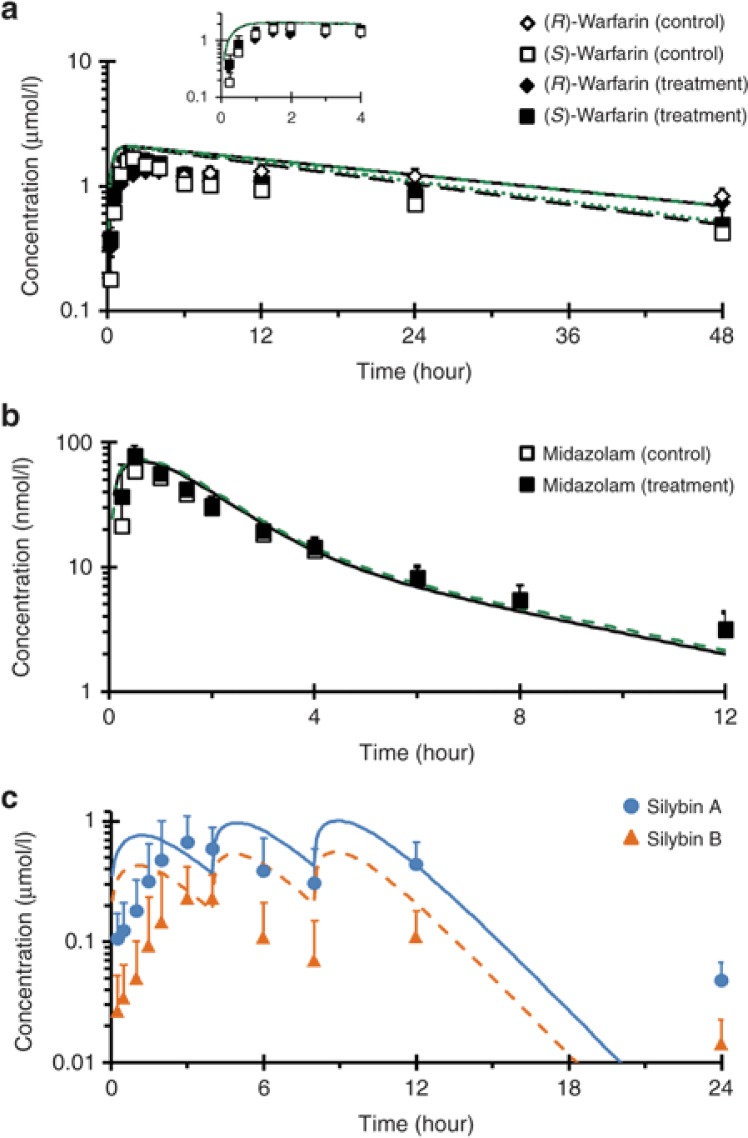
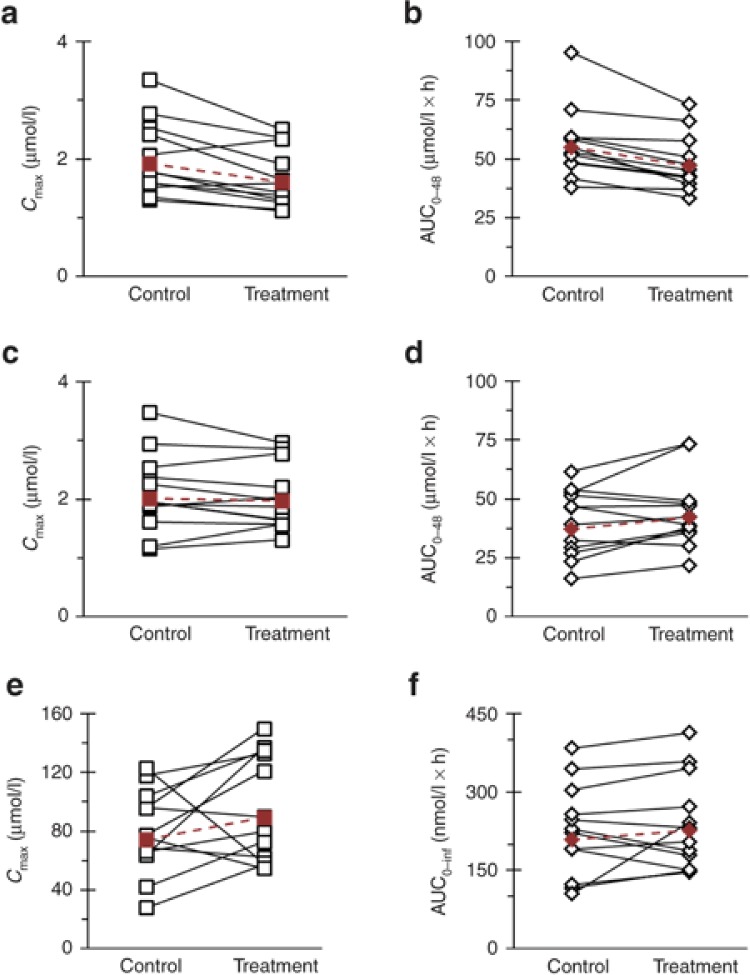
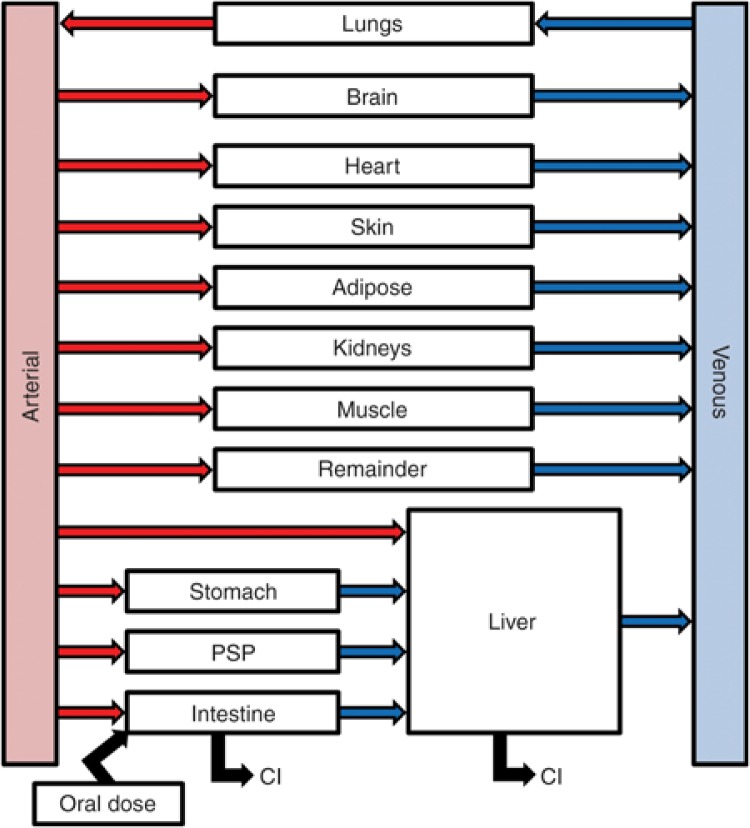
Herb-drug interaction predictions remain challenging. Physiologically based pharmacokinetic (PBPK) modeling was used to improve prediction accuracy of potential herb-drug interactions using the semipurified milk thistle preparation, silibinin, as an exemplar herbal product. Interactions between silibinin constituents and the probe substrates warfarin (CYP2C9) and midazolam (CYP3A) were simulated. A low silibinin dose (160 mg/day × 14 days) was predicted to increase midazolam area under the curve (AUC) by 1%, which was corroborated with external data; a higher dose (1,650 mg/day × 7 days) was predicted to increase midazolam and (S)-warfarin AUC by 5% and 4%, respectively. A proof-of-concept clinical study confirmed minimal interaction between high-dose silibinin and both midazolam and (S)-warfarin (9 and 13% increase in AUC, respectively). Unexpectedly, (R)-warfarin AUC decreased (by 15%), but this is unlikely to be clinically important. Application of this PBPK modeling framework to other herb-drug interactions could facilitate development of guidelines for quantitative prediction of clinically relevant interactions.CPT Pharmacometrics Syst. Pharmacol. (2014) 3, e107; doi:10.1038/psp.2013.69; advance online publication 26 March 2014.
Figures
References
-
- Gurley B.J. Pharmacokinetic herb-drug interactions (part 1): origins, mechanisms, and the impact of botanical dietary supplements. Planta Med. 2012;78:1478–1489. - PubMed
-
- Hermann R., von Richter O. Clinical evidence of herbal drugs as perpetrators of pharmacokinetic drug interactions. Planta Med. 2012;78:1458–1477. - PubMed
-
- de Lima Toccafondo Vieira M., Huang S.M. Botanical-drug interactions: a scientific perspective. Planta Med. 2012;78:1400–1415. - PubMed
-
- Paine M.F., Oberlies N.H. Clinical relevance of the small intestine as an organ of drug elimination: drug-fruit juice interactions. Expert Opin. Drug Metab. Toxicol. 2007;3:67–80. - PubMed
-
- European Medicines Agency Guideline on the Investigation of Drug Interactions 2012 ). http://www.ema.europa.eu/docs/en_GB/document_library/Scientific_guidelin... Accessed 2 August 2012.
Grants and funding
LinkOut - more resources
Full Text Sources
Other Literature Sources
Miscellaneous
