. 2014 Apr 3;508(7494):108-12.
doi: 10.1038/nature13110. Epub 2014 Mar 16.

Metabolic determinants of cancer cell sensitivity to glucose limitation and biguanides

Affiliations

Metabolic determinants of cancer cell sensitivity to glucose limitation and biguanides

Kıvanç Birsoy et al. Nature. .

Abstract

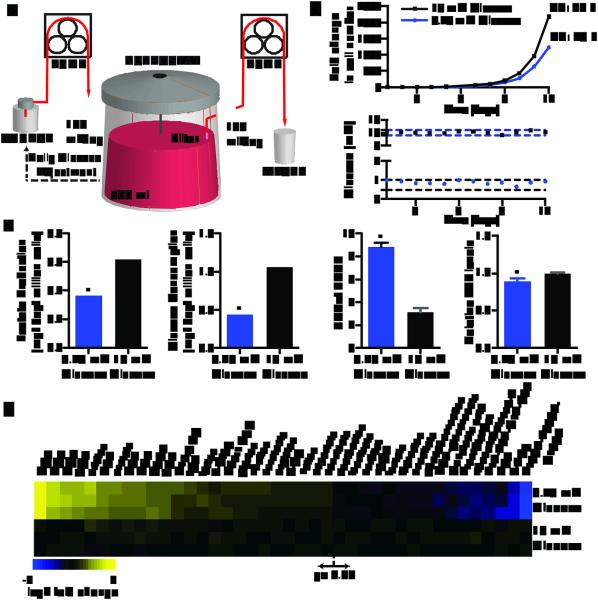
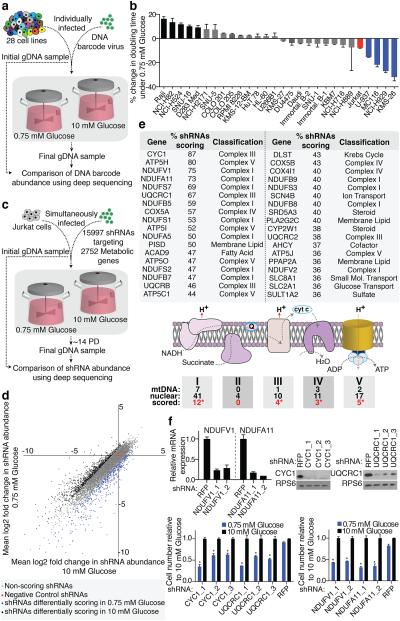
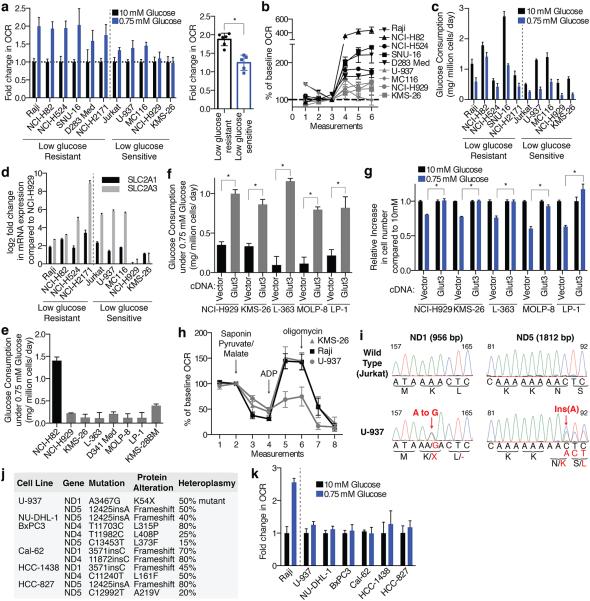
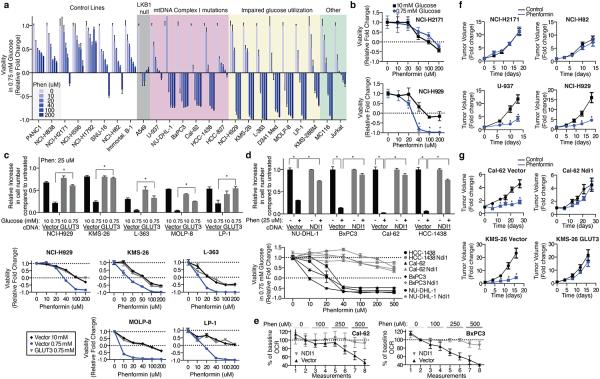
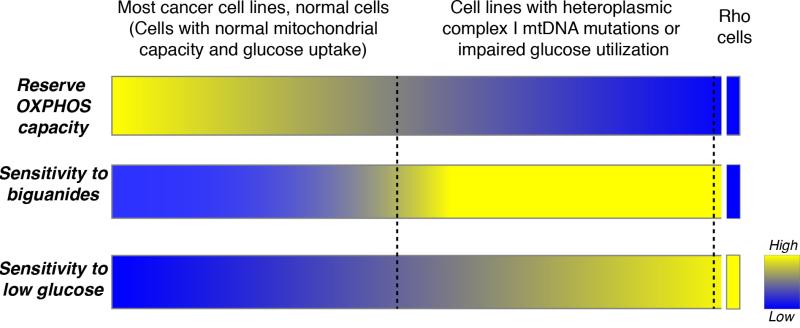
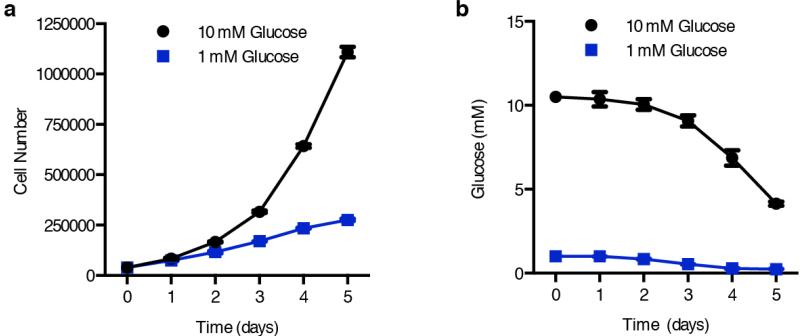
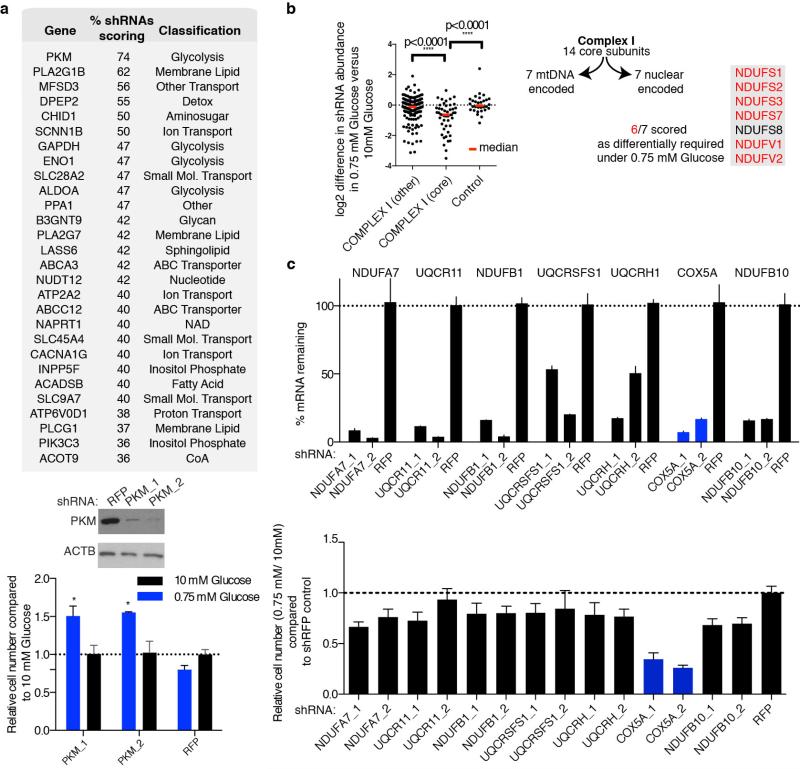
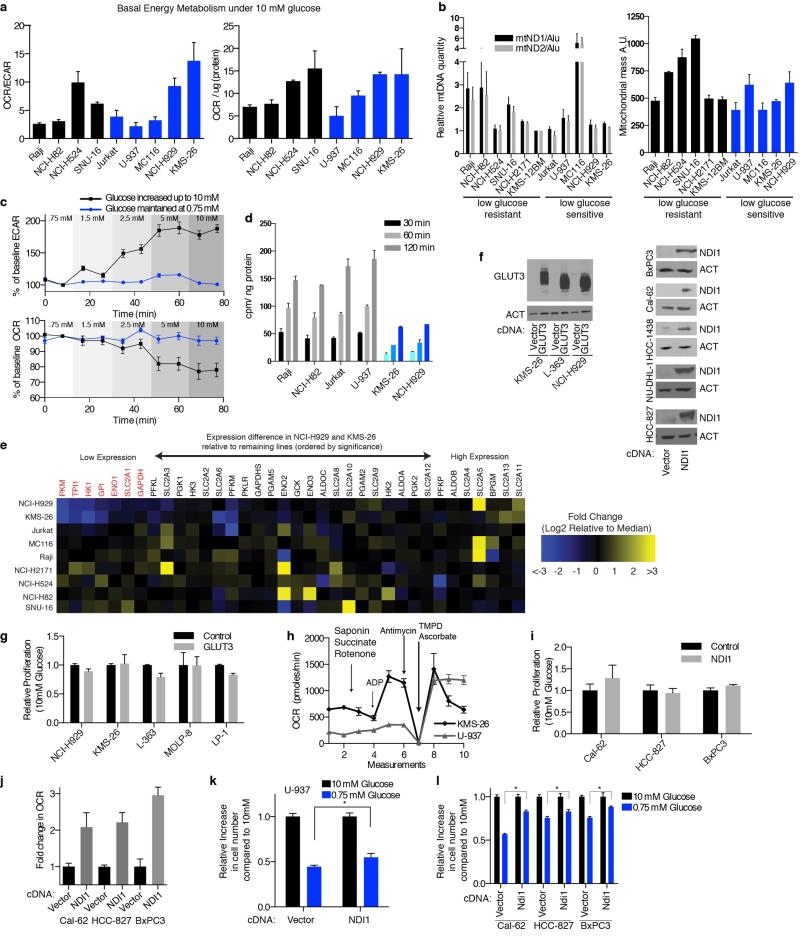
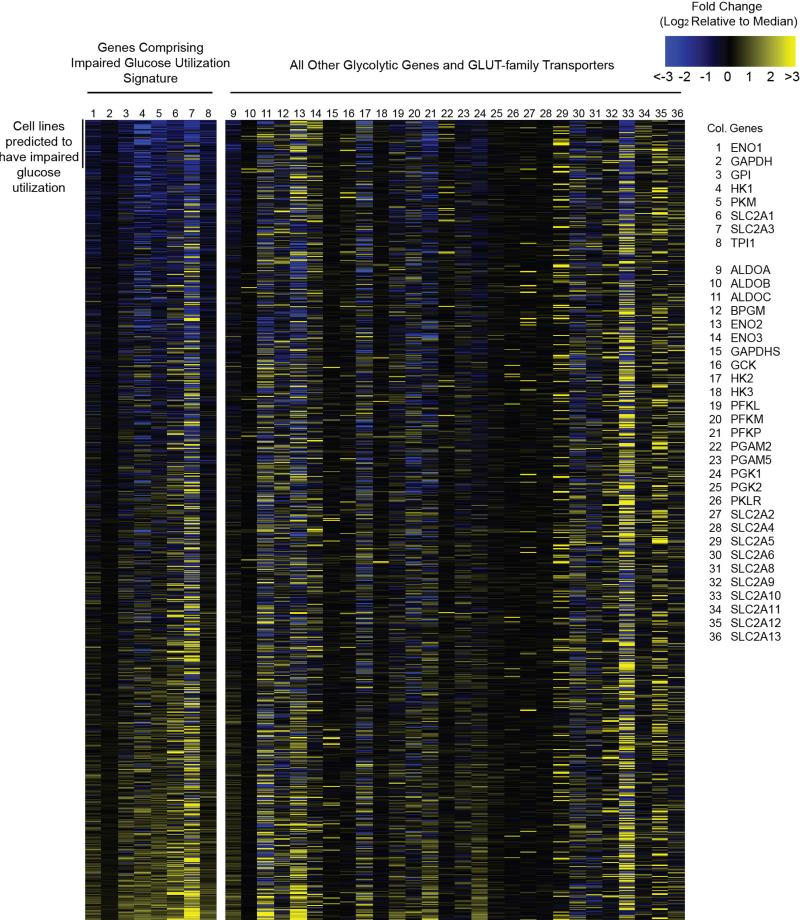
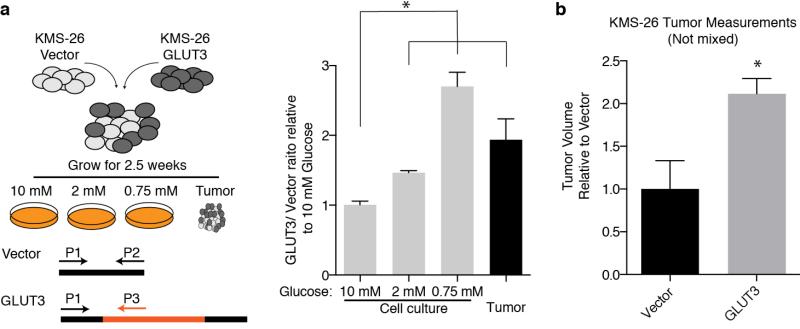
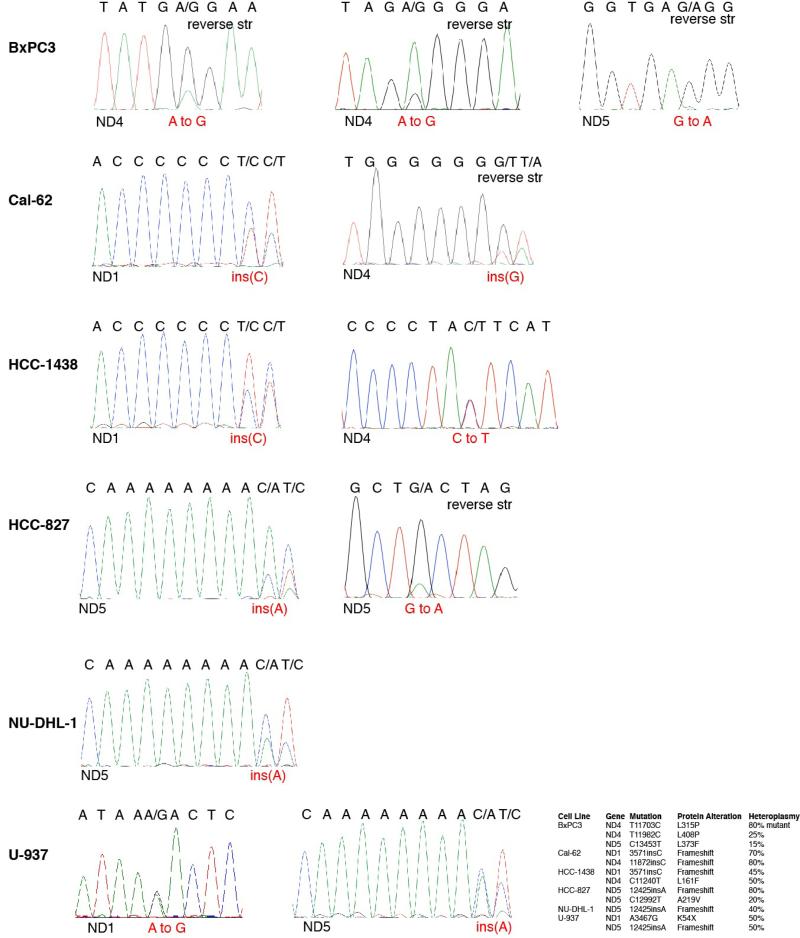
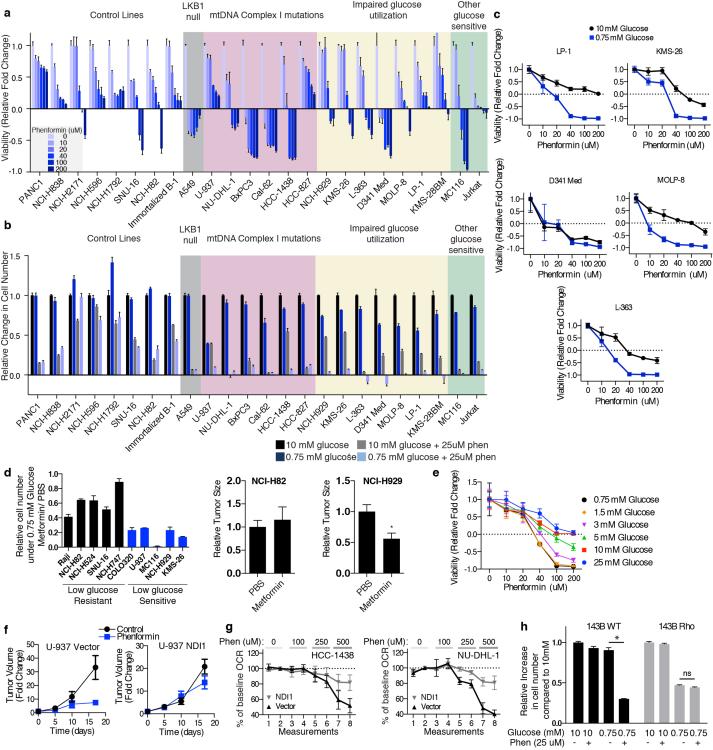
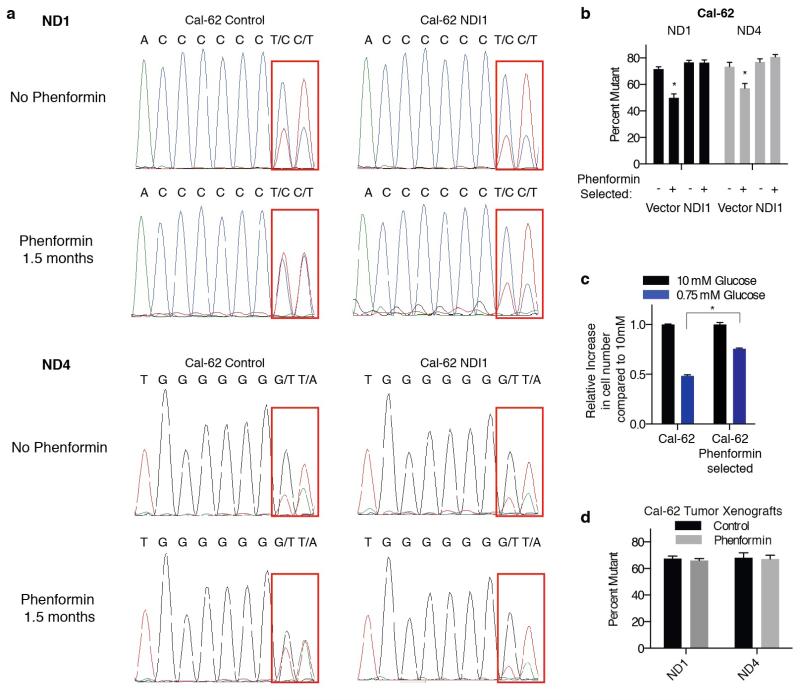
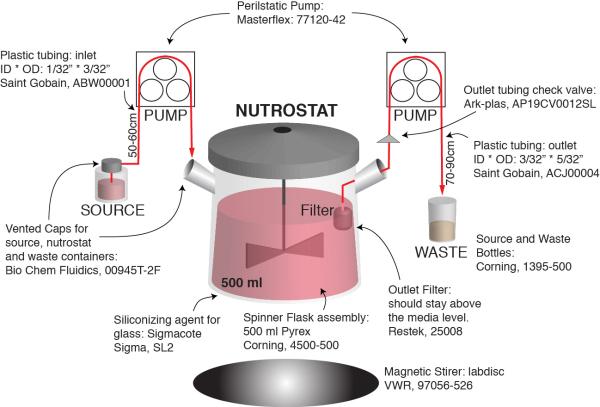
As the concentrations of highly consumed nutrients, particularly glucose, are generally lower in tumours than in normal tissues, cancer cells must adapt their metabolism to the tumour microenvironment. A better understanding of these adaptations might reveal cancer cell liabilities that can be exploited for therapeutic benefit. Here we developed a continuous-flow culture apparatus (Nutrostat) for maintaining proliferating cells in low-nutrient media for long periods of time, and used it to undertake competitive proliferation assays on a pooled collection of barcoded cancer cell lines cultured in low-glucose conditions. Sensitivity to low glucose varies amongst cell lines, and an RNA interference (RNAi) screen pinpointed mitochondrial oxidative phosphorylation (OXPHOS) as the major pathway required for optimal proliferation in low glucose. We found that cell lines most sensitive to low glucose are defective in the OXPHOS upregulation that is normally caused by glucose limitation as a result of either mitochondrial DNA (mtDNA) mutations in complex I genes or impaired glucose utilization. These defects predict sensitivity to biguanides, antidiabetic drugs that inhibit OXPHOS, when cancer cells are grown in low glucose or as tumour xenografts. Notably, the biguanide sensitivity of cancer cells with mtDNA mutations was reversed by ectopic expression of yeast NDI1, a ubiquinone oxidoreductase that allows bypass of complex I function. Thus, we conclude that mtDNA mutations and impaired glucose utilization are potential biomarkers for identifying tumours with increased sensitivity to OXPHOS inhibitors.


Figures

Figure 1
Figure 1. Nutrostat design and metabolic characterization of cancer cells under chronic glucose limitation
a, Nutrostat Schematic. b, Fold change in cell number (top) and media glucose concentration (bottom) of Jurkat cells grown in Nutrostats at 10 mM (black) or 0.75 mM (blue) glucose. DT = doubling time. c, Indicated metabolite levels in Nutrostats at 10 mM (black) or 0.75 mM (blue) glucose. d, Differential intracellular metabolite abundances (p < 0.05) from cells in Nutrostats at 10 mM (bottom three rows) or 0.75 mM (top three rows) glucose. Color bar indicates scale (Log2 transformed). Error bars where shown are SEM (n=2 (glucose and lactate), 3 (NAD(H) ratio) and 8 for ATP levels). Replicates are biological, means reported. Asterisks indicate significance p < 0.05 by two-sided student’s t-test.
Figure 2
Figure 2. Barcode-based cell competition assay and RNAi screen in Nutrostats
a, Experimental design of cell competition assay. b, Percent changes in doubling times of indicated cell lines in the competition assay, benchmarked to Jurkat cells (red). Significant increase (black) or decrease (blue) in doubling time indicated (p < 0.05). c, Experimental design outline of RNAi-based screen. d, Primary screening data (mean Log2 fold change) in 10 mM (X-axis) versus 0.75 mM (Y-axis) glucose. e, Genes scoring as preferentially required in 0.75 mM glucose (top). Diagram of mitochondrial OXPHOS Complexes. Number of mitochondria- or nuclear-encoded components and number of nuclear-encoded genes that scored indicated (red text). Asterisks indicate significance of gene class: Complex I (p < 9.3 × 10−49), III (p < 6.6 × 10⁻²⁰), IV (p < 8.3 × 10⁻¹⁰) and V (p < 5.6 × 10⁻¹⁹) by chi-squared test. f, Gene suppression of cells expressing indicated shRNAs (top) and proliferation (bottom) in 0.75 mM (blue) relative to 10 mM glucose (black). Asterisks indicate significance (p < 0.05) relative to shRFP, 0.75 mM glucose. Error bars are SEM (n=3). Replicates are biological, means reported. Asterisks in f indicate significance p < 0.05 by two-sided student’s t-test.
Figure 3
Figure 3. Deficiencies in glucose utilization or Complex I underlie low glucose sensitivity of cancer cells
a, Fold change in oxygen consumption rate (OCR) in 0.75 (blue) relative to 10 mM glucose (black) in indicated cell lines individually (left) or in aggregate (right). b, Percent change in OCR relative to third basal measurement and upon addition of FCCP (measurements 4-6) in low glucose resistant (black) or sensitive lines (grey). c, Glucose consumption rate in 10 mM (black) or 0.75 mM glucose (blue). d, Expression (qPCR) of SLC2A1 (black) or SLC2A3 (grey) of indicated cell lines (log2 scale relative to NCI-H929). e-f, Glucose consumption rate of indicated cell lines under 0.75 mM glucose. g, Proliferation (4 days) of control (Vector) or GLUT3 over-expressing (GLUT3) cell lines in 10 mM (black) or 0.75 mM glucose (blue). h, OCR of saponin-permeabilized lines given indicated substrates. i, Sanger sequencing of ND1 and ND5 with corresponding wild-type (black) and mutant (red) nucleotide and protein sequences. j, mtDNA mutations in Complex I genes identified in indicated cell lines. k, Fold increase in OCR of indicated cell lines in 0.75 mM (blue) relative to 10 mM glucose (black). Error bars are SEM (n=6 for a, b, h, k; n=5 for c, e, f; n=3 for d, g). Replicates are biological, means reported. Asterisks indicate significance p < 0.05 by two-sided student’s t-test.
Figure 4
Figure 4. Cancer cells with deficiencies in glucose utilization or Complex I are sensitive to phenformin
a, Viability of indicated lines, as measured by ATP levels on Day 3 at phenformin concentrations indicated by black-blue scale, in 0.75 mM glucose, compared to ATP levels on Day 0. Value of 1 indicates fully viable cells (untreated). Value of 0 indicates no change in ATP level compared to Day 0 (cytostatic). Negative values indicate decrease in ATP levels (-1 indicates no ATP). b, Viability as in a of NCI-H2171 and NCI-H929 cell lines under 0.75 and 10 mM glucose. c, Relative increase in cell number (top) and viability as in a (bottom) of control (Vector) or GLUT3 over-expressing (GLUT3) cell lines in 10 mM or 0.75 mM glucose at indicated phenformin concentrations relative to untreated cells in 10 mM glucose. d, Relative increase in cell number (top) and viability as in a (bottom) of vector control (black) or NDI1 (grey) expressing lines in 0.75 mM glucose at indicated phenformin concentrations relative to untreated cells in 0.75 mM glucose. e, Percent change in oxygen consumption rate (OCR) of control (Vector) or NDI1-expressing lines (NDI1) relative to the second basal measurement at indicated phenformin concentrations. f, Average volume (relative to Day 0) of established xenografted tumours derived from control (NCI-H2171, NCI-H82), mtDNA Complex I mutant (U-937), or impaired glucose utilization (NCI-H929) cell lines in mice treated with vehicle (black) or phenformin (blue) in drinking water starting at Day 0. g, Average tumor volume as in f of indicated cell lines infected with control, NDI1- or GLUT3-expressing vectors. Error bars are SEM (n=5 for a, b, c (bottom), d (bottom), e and f; n=6 (control) or n=8 (GLUT3 or NDI1) for g; n=3 for c (top) and d (top)). Replicates are biological, means reported. Asterisks indicate significance p < 0.05 by two-sided student’s t-test.
Extended Data Fig. 1
Extended Data Fig. 1. Model of the metabolic determinants of sensitivity to low glucose and biguanides.
This diagram outlines the interplay between reserve oxidative phosphorylation (OXPHOS) capacity, sensitivity to biguanides, and sensitivity to culture in low glucose. Most cancer cell lines and normal cells tested exhibited an ability to respond to glucose limitation by upregulating OXPHOS, rendering them less sensitive to biguanides and low glucose conditions. In contrast, cell lines harboring mutations in mtDNA encoded Complex I subunits or exhibiting impaired glucose utilization have a limited reserve OXPHOS capacity and are therefore unable to properly respond to biguanides and low glucose, rendering them sensitive to these perturbations. At the extreme, cells artificially engineered to have no OXPHOS (Rho cells) exhibit extreme low glucose sensitivity, but resistance to further inhibition of OXPHOS. Thus, mtDNA mutant cancer cells exist at an intermediate state of OXPHOS functionality that renders them sensitive to treatment with biguanides in vitro and in vivo. Similarly, cell lines with impaired glucose utilization exhibit biguanide sensitivity specifically under the low glucose conditions seen in the tumor microenvironment.
Extended Data Fig. 2
Extended Data Fig. 2. Proliferation and media glucose levels in standard culture conditions.
a, Jurkat cell proliferation under 10 mM (black) versus 1 mM (blue) glucose in standard culture conditions. b, Media glucose concentrations over time from cultures in (a). Error bars are SEM, n=3. Replicates are biological, means reported. Asterisks indicate significance p < 0.05 by two-sided student’s t-test.
Extended Data Fig. 3
Extended Data Fig. 3. Additional Data supporting RNAi Screen.
a, Genes scoring as differentially required in 10 mM glucose compared to 0.75 mM glucose (top). Percent shRNAs scoring and pathway classification indicated. Immunoblots (below) depict suppression of PKM by shRNAs (PKM_1, PKM_2) compared to control (RFP). Bottom, proliferation of cells in 0.75 mM (blue) relative to 10 mM glucose (black) harboring shRNAs targeting PKM or control. Asterisks indicate probability value (p) < 0.05 relative to RFP 0.75 mM glucose. b, Nuclearly encoded core Complex I genes are written in the grey box indicating those which score (right, red text). Dot plot reports differential essentiality in 10 mM versus 0.75 mM glucose of individual shRNAs targeting non-core Complex I genes, core Complex I genes, or non-targeting controls. Red bar is the population median. c, Top, mRNA levels of the non-scoring OXPHOS genes (black) and the scoring OXPHOS gene (blue) indicated upon suppression with the shRNAs indicated as measured by qPCR, relative to a non-targeting shRNA (RFP). Bottom, cell number from seven day proliferation assay of cells in 0.75 mM glucose relative to 10 mM glucose (not shown) harboring the indicated shRNAs. shRFP control normalized to 1. Error bars are SEM, n=3. Replicates are biological, means reported. Asterisks indicate significance p < 0.05 by two-sided student’s t-test.
Extended Data Fig. 4
Extended Data Fig. 4. Additional data characterizing mitochondrial dysfunction and impaired glucose utilization in cancer cell lines.
a, Oxygen consumption rate (OCR) to extracellular acidification rate (ECAR) ratio (left) or OCR normalized to protein content (right) for glucose limitation resistant (black) or sensitive (blue) cell lines. b, Left, mitochondrial DNA content for indicated cell lines by qPCR using primers targeting ND1 (black) or ND2 (grey) normalized to gDNA repetitive element (Alu) relative to KMS-12BM. Right, mitochondrial mass measured by fluorescence intensity of mitotracker green dye for indicated cell lines. c, Percent change from baseline (second measurement) of ECAR or OCR in Jurkat cells where glucose concentration was maintained at 0.75 mM (blue) or increased to indicated concentrations (black). d, Uptake of 3H-labeled 2-DG (counts per minute per ng protein) in 0.75 mM glucose at indicated timepoints in GLUT3 high (grey) or low (blue) cell lines. e, Heatmap of gene expression values for genes indicated at top and cell lines indicated at left. Genes organized by p-value with lowest expressed genes in NCI-H929 and KMS-26 at left, those significantly lower are colored red. Expression values reported are Log2 transformed fold difference from the median (scale color bar at right). f, Immunoblots for GLUT3 and NDI1 expression in indicated cell lines (beta-actin loading control). g,i, Proliferation of cell number in cells over-expressing GLUT3 or NDI1 relative to control vector (4 days). h, OCR of permeabilized cell indicated upon addition of indicated metabolic toxins and substrates. j, Fold change in OCR in indicated cells expressing NDI1 relative to control vector. k-l, Proliferation for 4 days of control (Vector) or NDI1 expressing cell lines indicated (NDI1) under 10 mM (black) and 0.75 mM glucose (blue). Error bars are SEM, n=4 for a-c, h, j; n=3 for d, g, i, k, l. Replicates are biological, means reported. Asterisks indicate significance p < 0.05 by two-sided student’s t-test.
Extended Data Fig. 5
Extended Data Fig. 5. Gene expression signature for identifying cell lines with impaired glucose utilization.
Heatmap of gene expression values for the genes indicated on the right for the cell lines in the CCLE set. Gene expression values are reported as the difference from the median across the entire sample set according to the scale color bar on the upper right. Genes 1-8 comprised the gene expression signature used to identify samples with impaired glucose utilization. Samples are sorted based upon this signature with those predicted to exhibit impaired glucose utilization at the top. The order of samples and all values are reported in Supplementary Table 4.
Extended Data Fig. 6
Extended Data Fig. 6. GLUT3 over-expression increases tumor xenograft growth and cell proliferation in low glucose media.
a, KMS-26 cell lines infected with GLUT3 overexpressing vector or infected with control vector were mixed in equal proportions and cultured under different glucose concentrations. Additionally, these mixed cell lines were injected into NOD/SCID mice subcutaneously. 2.5 weeks later, genomic DNA was isolated from tumors as well as cells grown in vitro under the indicated glucose concentrations. Using qPCR, relative abundance of control vector and GLUT3 vector were determined and plotted relative to 10 mM glucose in culture (n=9). b, Average volume of unmixed tumor xenografts from KMS-26 cell lines infected with GLUT3 overexpressing vector relative to control vector (2.5 weeks) (n=6). Replicates are biological, means reported. Asterisks indicate significance p < 0.05 by two-sided student’s t-test.
Extended Data Fig. 7
Extended Data Fig. 7. Sanger sequencing traces validating mtDNA mutations.
The table summarizing mtDNA mutations in Complex I subunits from Fig. 3j is reproduced at the lower right. Traces for each cell line (left) are shown in the order indicated by the table. “Reverse str” indicates instances when the sequence shown is in the reverse orientation to the revised Cambridge Reference Sequence. For each trace, the gene sequenced is at the bottom left, the DNA sequence is at the top, and the nucleotide alteration is in red text.
Extended Data Fig. 8
Extended Data Fig. 8. Additional data supporting the hypersensitivity of cell lines with the identified biomarkers to biguanides.
a-b, Viability (a, 10 mM glucose) or relative change in cell number (b, 4 days, glucose concentration indicated in key) of indicated cell lines at phenformin concentrations indicated. Viability measured by ATP levels on Day 3 at phenformin concentrations indicated by black-blue scale, compared to ATP levels on Day 0. Value of 1 indicates fully viable cells (untreated). Value of 0 indicates no change in ATP level compared to Day 0 (cytostatic). Negative values indicate decrease in ATP levels (-1 indicates no ATP). c, Viability as in (a) of indicated cell lines under 0.75 mM and 10 mM glucose at indicated phenformin concentrations. d, Left, relative change in cell number in 0.75 mM glucose, 2 mM metformin relative to untreated in glucose limitation resistant (black) and sensitive (blue) cell lines. Right, relative size of tumor xenografts derived from the indicated cell lines in mice injected with PBS or metformin (IP, 300 mg/kg/day). e, Viability as in (a) of NCI-H929 cells at the indicated concentrations of phenformin and glucose. f, Relative size of indicated cell line xenografts in mice treated with PBS or phenformin (1.7 mg/ml in drinking water). g, Percent change in oxygen consumption rate (OCR) of control (Vector) or NDI1-expressing lines (NDI1) relative to the second basal measurement and at indicated phenformin concentrations. h, Proliferation of 143B wild type or 143B rho (no mtDNA) cell lines under 0.75 mM or 10 mM glucose with or without phenformin treatment. Error bars are SEM (n=4 for a, c, e, g; n=3 for b, d, and h (left); n=5 for d (right) and f). Replicates are biological, means reported. Asterisks indicate significance p < 0.05 by two-sided student’s t-test.
Extended Data Fig. 9
Extended Data Fig. 9. Long term treatment of mtDNA mutant cells with phenformin.
a, Sanger-sequencing traces of mtDNA encoded ND1 and ND4 genes from Cal-62 cells expressing NDI1 or control vector cultured under 5-20 uM phenformin or no phenformin for 1.5 months. Regions containing mutant sequence indicated by red box. b, Heteroplasmy levels for mutation in ND1 or ND4 were assessed by measuring the relative areas under the curve from Sanger-sequencing and plotted. c, Cal-62 cell lines cultured with or without phenformin for 1.5 months assessed for their ability to proliferate in 0.75 mM glucose (blue) relative to 10 mM glucose (black). The proliferation assay was for 4 days in the absence of phenformin. d, Heteroplasmy levels of ND1 and ND4 as in b of Cal-62 tumor xenografts in mice treated with or without phenformin for 28 days. Error bars are SEM, n=3. Replicates are biological (c) or technical (b,d), means reported. Asterisks indicate significance p < 0.05 by two-sided student’s t-test.
Extended Data Fig. 10
Extended Data Fig. 10. Schematic of Nutrostat setup.
Part numbers, sizes, and dimensions for the Nutrostat assembly are indicated. See methods for additional details.

References

    1. Hirayama A, et al. Quantitative metabolome profiling of colon and stomach cancer microenvironment by capillary electrophoresis time-of-flight mass spectrometry. Cancer Res. 2009;69:4918–4925. - PubMed
    1. Gullino PM, Grantham FH, Courtney AH. Glucose consumption by transplanted tumors in vivo. Cancer Res. 1967;27:1031–1040. - PubMed
    1. Owen MR, Doran E, Halestrap AP. Evidence that metformin exerts its anti-diabetic effects through inhibition of complex 1 of the mitochondrial respiratory chain. Biochem J. 2000;348(Pt 3):607–614. - PMC - PubMed
    1. El-Mir MY, et al. Dimethylbiguanide inhibits cell respiration via an indirect effect targeted on the respiratory chain complex I. J Biol Chem. 2000;275:223–228. - PubMed
    1. Seo BB, Matsuno-Yagi A, Yagi T. Modulation of oxidative phosphorylation of human kidney 293 cells by transfection with the internal rotenone-insensitive NADH-quinone oxidoreductase (NDI1) gene of Saccharomyces cerevisiae. Biochim Biophys Acta. 1999;1412:56–65. - PubMed

Publication types

MeSH terms